Live Attenuated Vaccines Market Size and Share
Market Overview
| Study Period | 2019 - 2030 |
|---|---|
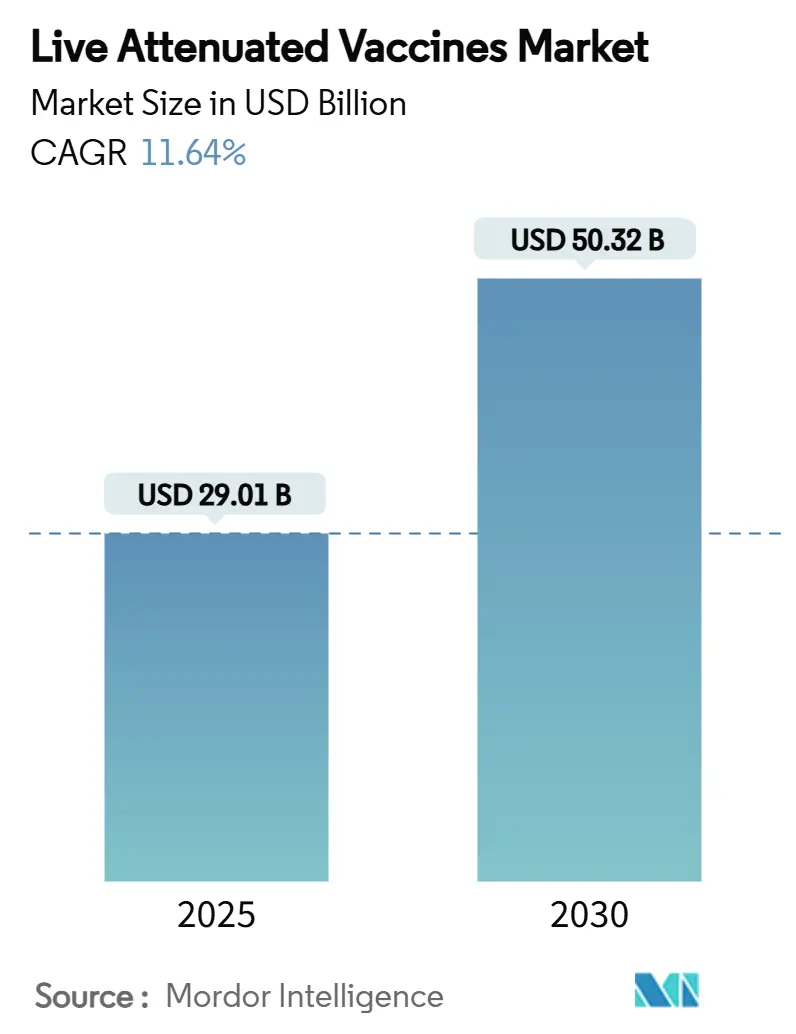
| Market Size (2025) | USD 29.01 Billion |
| Market Size (2030) | USD 50.32 Billion |
| Growth Rate (2025 - 2030) | 11.64% CAGR |
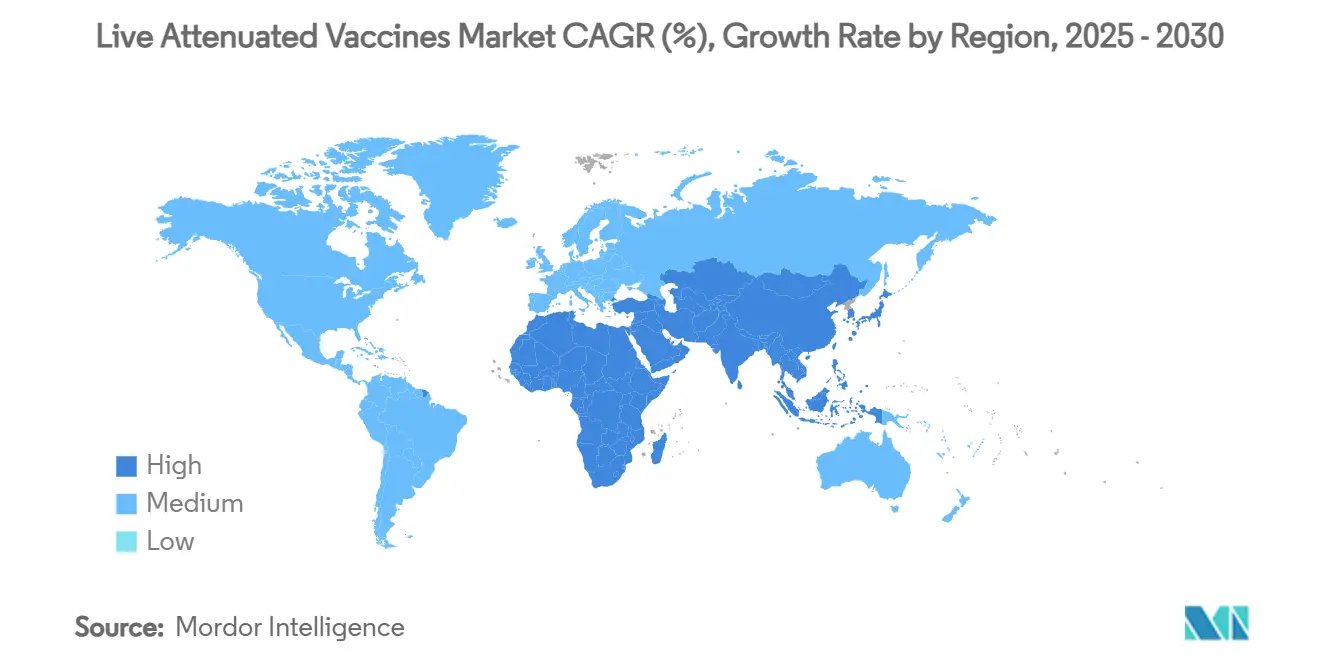
| Fastest Growing Market | Asia Pacific |
| Largest Market | North America |
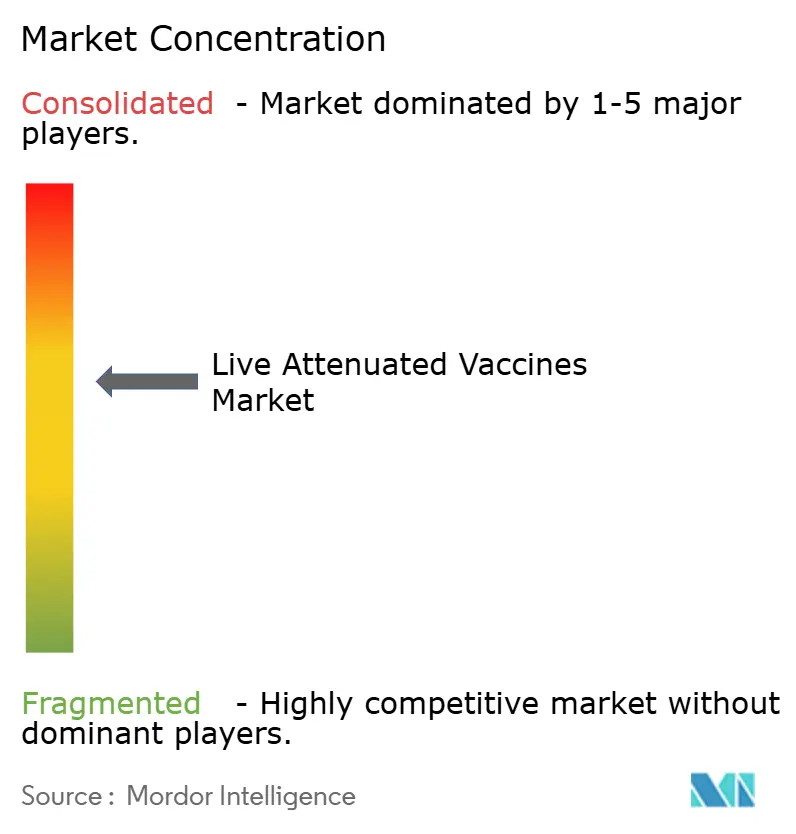
| Market Concentration | Medium |
Major Players *Disclaimer: Major Players sorted in no particular order Image © Mordor Intelligence. Reuse requires attribution under CC BY 4.0. | |
Live Attenuated Vaccines Market Analysis by Mordor Intelligence
The live attenuated vaccines market size reached USD 29.01 billion in 2025 and is forecast to attain USD 50.32 billion by 2030, registering an 11.64% CAGR over 2025-2030. Growth stems from expanded immunization schedules in emerging economies, the World Health Organization’s (WHO) intensified eradication programs, and synthetic biology platforms that accelerate attenuation while preserving immunogenicity.[1]World Health Organization, “Statement of the Forty-First Meeting of the Polio IHR Emergency Committee,” who.int Elevated demand is further supported by thermostable formulation breakthroughs that simplify off-grid delivery, while cross-species initiatives to curb zoonotic spillover amplify veterinary uptake. Competition revolves around rapid pipeline development, strategic licensing, and facility upgrades that align with evolving regulatory expectations for bio-containment and genetic stability.[2]Center for Biologics Evaluation and Research, “2025 Biological License Application Supplement Noteworthy Approvals,” fda.gov
Key Report Takeaways
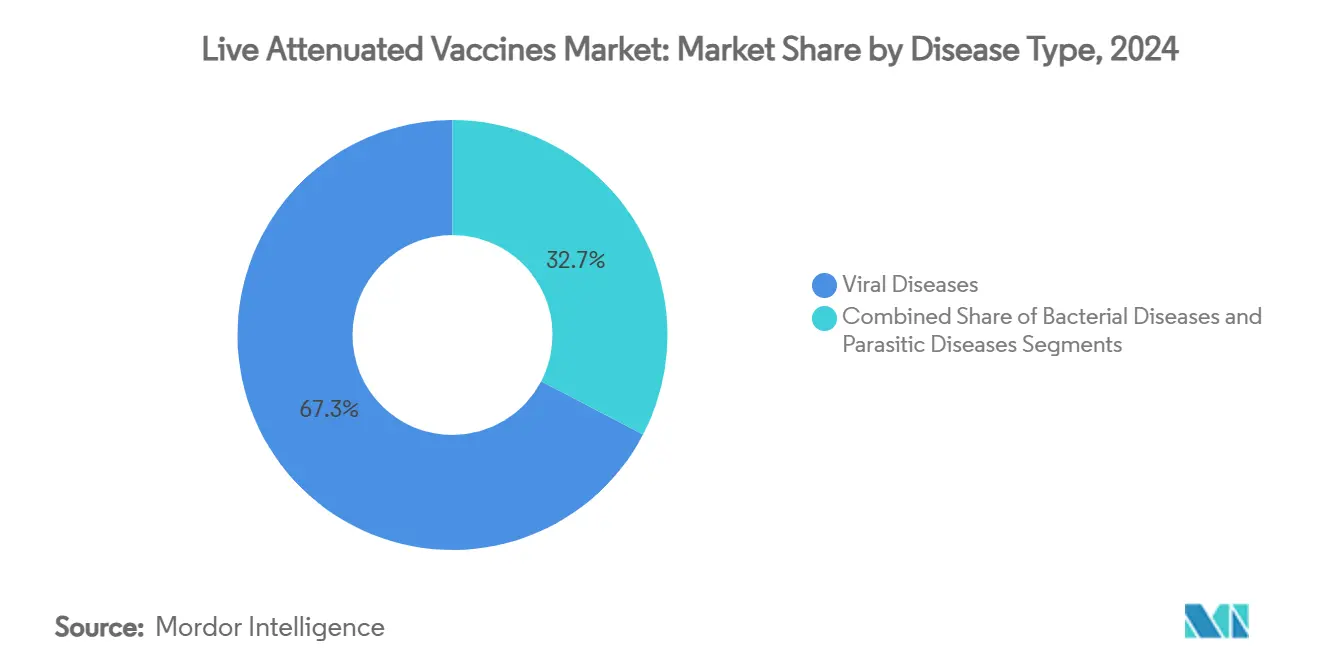
- By disease type, viral diseases led with 67.34% of the live attenuated vaccines market share in 2024. Parasitic diseases are projected to expand at a 13.07% CAGR through 2030.
- By route of administration, injectable products accounted for 69.89% of the live attenuated vaccines market size in 2024. Intranasal delivery is advancing at a 13.78% CAGR during 2025-2030.
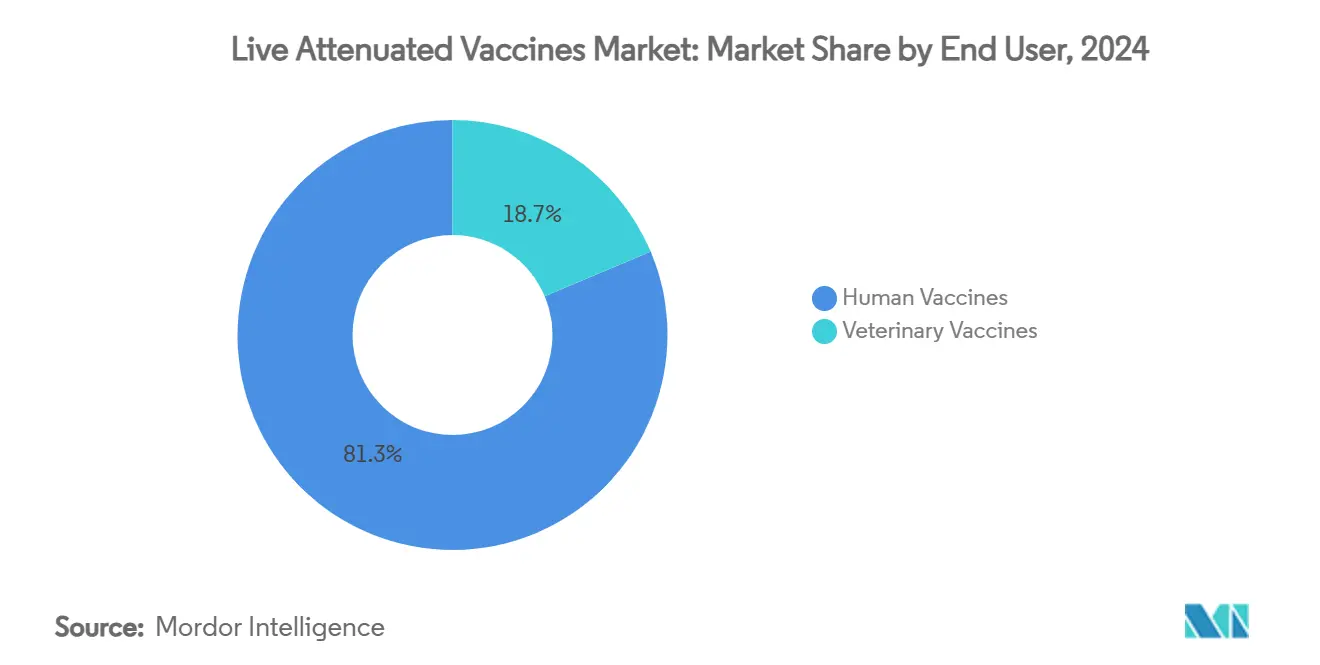
- By end user, human vaccines captured 81.34% revenue share in 2024, whereas veterinary vaccines are set to rise at a 12.89% CAGR.
- By valency, monovalent formulations controlled 54.24% share in 2024; multivalent vaccines are poised for a 14.02% CAGR.
- By geography, North America held 36.77% of the live attenuated vaccines market size in 2024, while Asia-Pacific exhibits a 13.33% CAGR to 2030.
Global Live Attenuated Vaccines Market Trends and Insights
Drivers Impact Analysis*
| Driver | (~) % Impact on CAGR Forecast | Geographic Relevance | Impact Timeline |
|---|---|---|---|
| Expansion Of National Immunization Schedules In Emerging Economies | +2.1% | Asia-Pacific, Africa, Latin America | Medium term (2-4 years) |
| WHO Eradication Initiatives For Polio, Measles & Rubella | +1.8% | Global, with focus on Afghanistan, Pakistan, Nigeria | Short term (≤ 2 years) |
| Superior Mucosal Immunity & Single-Dose Efficacy Over Inactivated/Recombinant Vaccines | +1.5% | Global | Long term (≥ 4 years) |
| Thermostable Lyophilization Tech Enabling Off-Grid Delivery | +1.3% | Sub-Saharan Africa, Southeast Asia, Rural Americas | Medium term (2-4 years) |
| Synthetic Biology Rapid Codon-De-Optimization Platforms | +1.7% | North America, Europe, developed APAC | Long term (≥ 4 years) |
| Veterinary Crossover Demand For Zoonotic-Spillover Prevention | +1.2% | Global, concentrated in livestock-intensive regions | Medium term (2-4 years) |
| Source: Mordor Intelligence | |||
Expansion of National Immunization Schedules in Emerging Economies
India, Colombia, and Peru updated childhood vaccine schedules to include booster or combination live attenuated components, reflecting renewed coverage drives after COVID-19 disruptions.[3]Lora Shimp, Raj Shankar Ghosh, Katharine Elkes, “Addressing Immunization Inequity—What Have the International Community and India Learned over 35 Years?,” mdpi.com Catch-up campaigns, digital registries such as India’s CoWIN, and the WHO Immunization Agenda 2030 converge to improve equity, which directly lifts demand across public procurement channels. Integrated hexavalent formulations simplify clinic visits and lower per-dose administration costs in Latin America. Government financing mechanisms and Gavi co-funding maintain affordability for pediatric vaccines priced below USD 1.00 per dose, sustaining volume growth. Parallel investments in domestic manufacturing—exemplified by Brazil and Argentina—anchor regional self-sufficiency.
WHO Eradication Initiatives for Polio, Measles & Rubella
WHO emergency committee communiqués from December 2024 and April 2025 highlighted a surge in wild poliovirus cases in Afghanistan and Pakistan, magnifying pressure for rapid oral vaccine rollout. The novel oral poliovirus vaccine type 2 (nOPV2) shows enhanced genetic stability and lower reversion risk than Sabin strains, reinforcing live attenuated preference for outbreak response. Member-state endorsement at the 2025 World Health Assembly secures multiyear funding streams earmarked for routine immunization integration. Stalled childhood coverage—2.7 million additional un- and under-vaccinated children in 2023—creates pent-up demand for measles-mumps-rubella catch-ups. Collectively, these factors buoy procurement volumes through UNICEF and PAHO Revolving Fund channels.
Superior Mucosal Immunity & Single-Dose Efficacy Over Inactivated/Recombinant Vaccines
Live attenuated candidates stimulate robust mucosal IgA alongside systemic IgG, a profile now prized for respiratory pathogens. A live attenuated SARS-CoV-2 construct with one-to-stop genome edits protected animals from multiple variants while blocking transmission. FDA pre-IND disclosures confirm interest in intranasal formats that could outperform intramuscular mRNA boosters by curbing nasal shedding. Single-dose efficacy minimizes cold-chain touchpoints and clinic revisits, demonstrated by live measles-rubella-COVID combination prototypes achieving sterilizing immunity in hamsters without boosters. In health systems where drop-out rates between first and second doses exceed 20%, these attributes translate into higher effective coverage.
Thermostable Lyophilization Tech Enabling Off-Grid Delivery
Stablevax preserved tetanus-diphtheria potency for 10 months at 45 °C, eliminating the need for passive cold boxes in rural supply chains. Lyophilized adenovirus-vectored vaccines maintained infectivity at 30 °C, cutting wastage linked to temperature excursions. Alcohol-dilution lyophilization of mRNA-LNPs—now applied to live vectors—supports 4 °C storage for 4 months, crucial for veterinary field use. These advances remove logistical bottlenecks and open previously inaccessible markets such as Sahelian pastoral zones and Amazonian river communities.
Restraints Impact Analysis*
| Restraint | (~) % Impact on CAGR Forecast | Geographic Relevance | Impact Timeline |
|---|---|---|---|
| Cold-Chain Dependency & Reversion-To-Virulence Risk | -1.9% | Global, acute in tropical regions | Short term (≤ 2 years) |
| Regulatory Shift Toward Non-Replicating Platforms Post-COVID-19 | -1.6% | North America, Europe | Medium term (2-4 years) |
| CAPEX Diversion To Mrna Stockpiles Limiting LA Production | -1.4% | Global, concentrated in developed markets | Short term (≤ 2 years) |
| Rising Bio-Containment Insurance Costs For LA Plants | -1.1% | North America, Europe | Long term (≥ 4 years) |
| Source: Mordor Intelligence | |||
Cold-Chain Dependency & Reversion-to-Virulence Risk
Most live attenuated presentations still require 2-8 °C storage, exposing supply chains to outages in regions where grid stability is below 60%. Freeze-preventive cold boxes tested in Nepal eliminated crystal-induced potency loss but proved bulky for mountain transport. Parallel safety concerns persist; 522 confirmed circulating vaccine-derived poliovirus cases were tracked in 2023, sustaining political scrutiny. Together, infrastructure fragility and genetic instability elevate regulatory hurdles and deter donor financing for legacy Sabin-based orals.
Regulatory Shift Toward Non-Replicating Platforms Post-COVID-19
The pandemic mainstreamed mRNA and replication-defective vectors; FDA 2023-2024 approvals favored these modalities, prompting tougher containment rules for live manufacturing suites. Sponsors must now satisfy extended environmental release dossiers, real-time sequencing audits, and dual-chamber vial validation. Compliance inflates per-batch QC costs by up to 30%, eroding price competitiveness versus synthetic platforms. Venture capital gravitates toward nucleic-acid technologies, narrowing funding channels for live pipeline entrants.
*Our forecasts treat driver/restraint impacts as directional, not additive. The impact forecasts reflect baseline growth, mix effects, and variable interactions.
Segment Analysis
By Disease Type: Viral Leadership Endures While Parasitic Formulations Gain Traction
The live attenuated vaccines market size for viral diseases stood highest in 2024, as established measles-mumps-rubella, varicella, and rotavirus programs locked in 67.34% of global revenue. Strength persists because these formulations deliver durable, often lifelong immunity that national schedules rarely alter. Pipeline momentum, exemplified by codon-engineered parainfluenza and attenuated SARS-CoV-2 candidates, indicates sustained licensing activity through 2030. In contrast, parasitic applications such as attenuated Leishmania or malaria lines begin to close the gap, supported by One-Health funding that targets neglected tropical diseases.
Parasitic vaccines now post a 13.07% CAGR, the fastest of any disease grouping, as African and South-Asian ministries pilot dog and livestock rabies-Leishmania cross-protection campaigns. Early phase read-outs show live parasites that lack virulence genes still provoke multi-antigenic responses—an outcome that inactivated formats have struggled to match. Bacterial candidates grow steadily via veterinary channels, where live Salmonella and Mycoplasma offerings reduce antibiotic reliance and bolster food security targets. Together, these dynamics keep the viral segment dominant but point to a broader pathogen mix steering the live attenuated vaccines market toward more diversified public-health portfolios.


By Route of Administration: Injectables Hold Ground as Intranasal Solutions Surge
Injectables delivered 69.89% of 2024 revenue because clinicians trust dose accuracy and multi-antigen co-administration in a single visit. Stable vial formats suit UNICEF procurement rules and cold-chain norms built over decades; accordingly, the injectable slice of the live attenuated vaccines market share remains the reference standard. Oral dosing, led by novel oral poliovirus vaccine type 2, retains its niche for outbreak response in hard-to-reach locales.
Intranasal delivery now charts a 13.78% CAGR, the highest within administration routes, as synthetic biology increases genetic stability and patients prefer needle-free options. Nasal candidates for RSV and COVID-19 have progressed to Phase II, highlighting mucosal IgA generation that blocks community transmission. Device makers support uptake with pre-filled unit-dose sprayers that cut nurse training time by half. By 2030, intranasal penetration is forecast to double, adding meaningful volume to the live attenuated vaccines market while injectables continue to serve high-throughput birth-cohort clinics.
By End User: Human Doses Dominate Yet Veterinary Demand Accelerates
Human applications commanded 81.34% of sales in 2024 as every country subsidized childhood immunization packs that combine at least two live antigens. Adult indications also help: shingles and intranasal influenza boosters sustain recurring volume in ageing populations. Even so, veterinary demand advances at a 12.89% CAGR, carving out new space within the live attenuated vaccines market size for livestock and companion-animal health.
Drivers include H5N1 incidents in dairy herds and quick-onset swine respiratory vaccines that show protective titers within three days. Regulators apply less stringent lot-release testing than for human doses, enabling faster time-to-market and price flexibility. Livestock producers, facing antimicrobial bans, increasingly view vaccination as the cheapest route to productivity gains and zoonotic-risk mitigation. As a result, veterinary orders help stabilize fermenter utilization for manufacturers, anchoring economies of scale that radiate back into the human side of the live attenuated vaccines market.
By Valency: Monovalent Stability Meets Multivalent Convenience
Monovalent products owned 54.24% revenue in 2024 and will keep a sizeable chunk because their safety dossiers are familiar to regulators. Single-antigen design reduces antigen interference and simplifies potency assays, ensuring predictable production yields. For many public contracts, a proven monovalent base is non-negotiable—especially where measles outbreaks still loom.
Yet multivalent and combination lines now post a 14.02% CAGR and are set to lift their live attenuated vaccines market share as clinics hunt cost efficiencies. Hexavalent pediatric packs, for instance, cut injection sessions by 40%, boosting compliance and freeing nursing hours for outreach work. Synthetic-biology spacers and lyophilization advances limit cross-antigen suppression, allowing developers to merge legacy viral strains with emergent pathogens such as SARS-CoV-2. Taken together, monovalent reliability and multivalent convenience will coexist, ensuring the live attenuated vaccines market offers options aligned to both regulatory caution and health-system logistics.
Geography Analysis
North America’s leadership stems from decades-long uptake of live attenuated measles-mumps-rubella, varicella, and intranasal influenza programs, underpinned by CDC recommendations and state-funded Vaccines for Children subsidies. The region’s advanced cold-chain infrastructure minimizes wastage to below 3%, supporting predictable demand planning. Nonetheless, the regulatory pivot favoring non-replicating modalities raises compliance costs for refurbished BSL-2 plants, nudging some manufacturers to outsource bulk stages to lower-cost geographies.
Asia-Pacific expansion is propelled by India’s Universal Immunization Program that integrates digital registries for real-time coverage analytics, revealing micro-pockets of under-vaccination and directing targeted outreach. China’s veterinary live market flourishes through compulsory poultry immunization against H9N2 avian influenza and pork sector biosafety mandates. Japan channels post-COVID economic packages into dual-use facilities capable of live attenuated and mRNA production, safeguarding supply autonomy.
European growth remains steady; EMA’s streamlined Article 58 procedure expedites pre-qualification for global health vaccines produced within the bloc, reinforcing export competitiveness. Pandemic-readiness hubs, such as Serum Institute’s Netherlands plant, add 300 million-dose swing capacity, ensuring supply continuity during outbreaks. Africa’s medium-term gains depend on continental regulator AMA achieving operational status and aligning dossier assessment criteria to WHO standards, thereby shortening approval lag for imported live products. Latin America capitalizes on thermostable formulations suited to equatorial climates where ambient shipment avoids costly refrigerated trucks.

Competitive Landscape
The market displays moderate concentration. Entrenched players—Merck, Sanofi, GSK, AstraZeneca, and Serum Institute—command share through broad portfolios and global manufacturing footprints. They continuously refresh product labels via post-marketing studies to uphold safety credentials in the face of mRNA competition. Synthetic-biology start-ups attract venture backing by offering rapid codon-engineering services that slash development timelines to under 24 months. Established firms hedge by in-licensing such platforms, exemplified by AstraZeneca’s USD 800 million takeover of Icosavax for RSV/hMPV assets.
Strategic moves include Takeda’s plan to localize dengue vaccine production in India under the Make-in-India policy framework, ensuring tariff advantages and expedited regulatory review. Serum Institute joined CEPI’s network to guarantee at-cost supply of outbreak vaccines and secure volume commitments mitigating demand volatility. Contract manufacturers pivot toward multipurpose facilities; SK Bioscience’s acquisition of IDT Biologika extends its European footprint, improving access to EMA-accredited fill-finish lines. Collectively, these maneuvers reinforce value-chain resilience and sustain competitive parity amid evolving platform preferences.
Live Attenuated Vaccines Industry Leaders
Merck & Co., Inc.
GlaxoSmithKline plc
Pfizer Inc.
Sanofi
AstraZeneca plc
- *Disclaimer: Major Players sorted in no particular order

Recent Industry Developments
- May 2025: EMA’s safety committee initiated a review of Ixchiq, a live attenuated chikungunya vaccine, following serious adverse event reports in older adults.
- May 2025: Takeda confirmed plans to launch its dengue vaccine Qdenga in India through a manufacturing partnership with Biological E.
- February 2025: IAVI and Biofabri began dosing volunteers with MTBVAC in the IMAGINE tuberculosis trial in South Africa.


Global Live Attenuated Vaccines Market Report Scope
| Viral Diseases |
| Bacterial Diseases |
| Parasitic Diseases |
| Oral |
| Injectable (IM/SC/ID) |
| Intranasal |
| Human Vaccines |
| Veterinary Vaccines |
| Monovalent |
| Multivalent / Combination |
| North America | United States |
| Canada | |
| Mexico | |
| Europe | Germany |
| United Kingdom | |
| France | |
| Italy | |
| Spain | |
| Rest of Europe | |
| Asia-Pacific | China |
| Japan | |
| India | |
| Australia | |
| South Korea | |
| Rest of Asia-Pacific | |
| Middle East and Africa | GCC |
| South Africa | |
| Rest of Middle East and Africa | |
| South America | Brazil |
| Argentina | |
| Rest of South America |
| By Disease Type | Viral Diseases | |
| Bacterial Diseases | ||
| Parasitic Diseases | ||
| By Route of Administration | Oral | |
| Injectable (IM/SC/ID) | ||
| Intranasal | ||
| By End User | Human Vaccines | |
| Veterinary Vaccines | ||
| By Valency | Monovalent | |
| Multivalent / Combination | ||
| By Geography | North America | United States |
| Canada | ||
| Mexico | ||
| Europe | Germany | |
| United Kingdom | ||
| France | ||
| Italy | ||
| Spain | ||
| Rest of Europe | ||
| Asia-Pacific | China | |
| Japan | ||
| India | ||
| Australia | ||
| South Korea | ||
| Rest of Asia-Pacific | ||
| Middle East and Africa | GCC | |
| South Africa | ||
| Rest of Middle East and Africa | ||
| South America | Brazil | |
| Argentina | ||
| Rest of South America | ||


Key Questions Answered in the Report
What is the current size of the global live attenuated vaccines market?
The live attenuated vaccines market size stood at USD 29.01 billion in 2025 and is projected to surpass USD 50 billion by 2030.
Which region is growing fastest for live attenuated vaccines?
Asia-Pacific is the fastest-growing region, advancing at a 13.33% CAGR due to expanding national immunization schedules and heightened manufacturing investment.
Which disease segment leads the live attenuated vaccines market?
Viral diseases dominate, accounting for 67.34% revenue in 2024 on the back of established measles, mumps, rubella, and rotavirus programs.
Why are intranasal live attenuated vaccines gaining traction?
Intranasal delivery elicits strong mucosal immunity and avoids needles, supporting a 13.78% CAGR and heightened pediatric acceptance.
How are synthetic biology tools impacting live attenuated vaccine development?
Codon-pair deoptimization and gene-deletion platforms accelerate attenuation, improve safety, and cut development timelines, enhancing pipeline velocity.
What are key restraints limiting live attenuated vaccine adoption?
Dependence on cold-chain logistics, regulatory preference for non-replicating platforms, and higher bio-containment insurance costs temper growth prospects.
Page last updated on:


