License Management Market Size and Share
Market Overview
| Study Period | 2020 - 2031 |
|---|---|
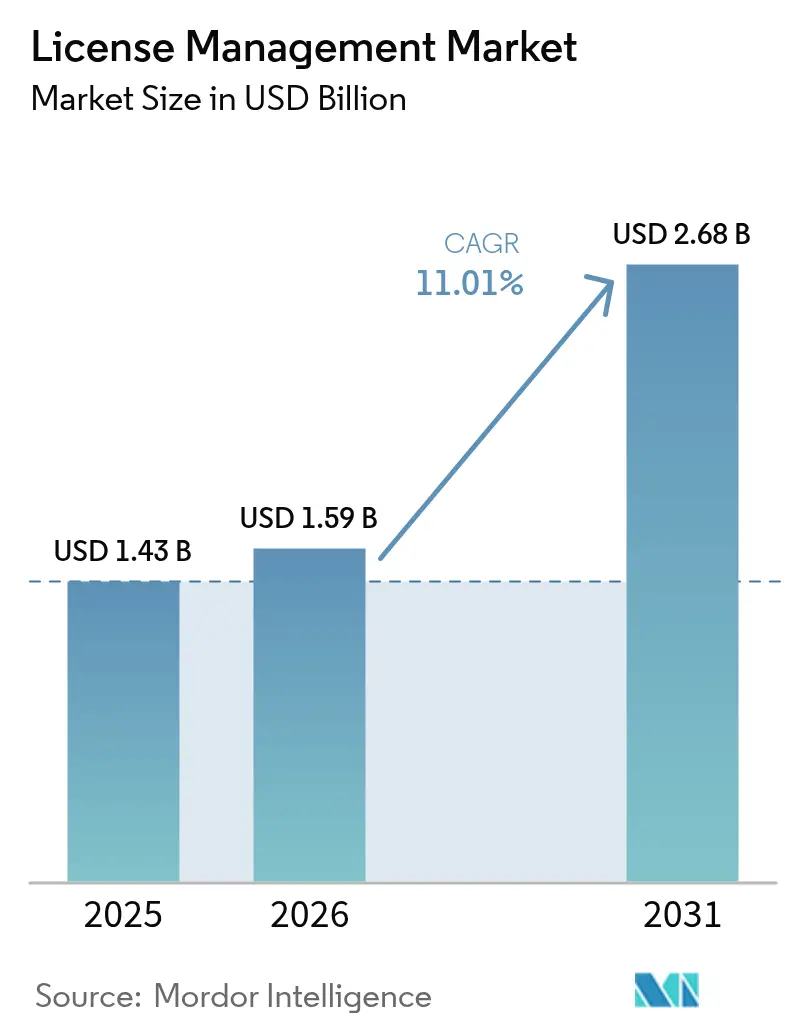
| Market Size (2026) | USD 1.59 Billion |
| Market Size (2031) | USD 2.68 Billion |
| Growth Rate (2026 - 2031) | 11.01% CAGR |
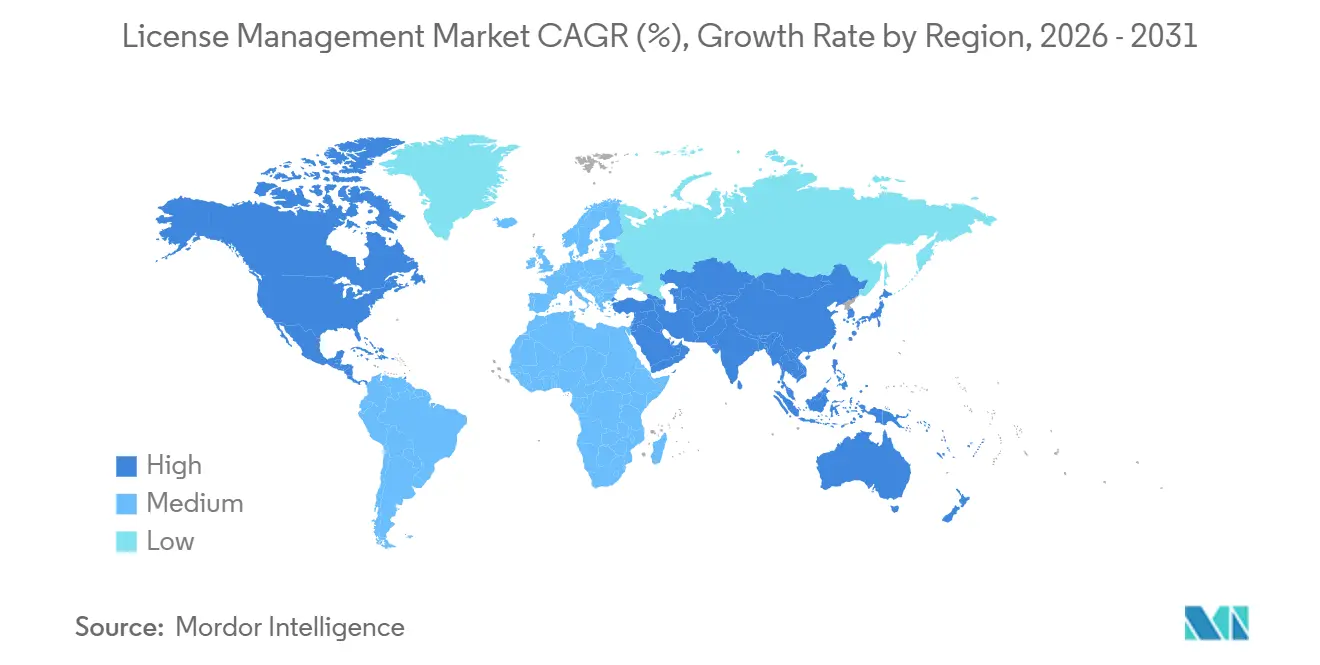
| Fastest Growing Market | Asia-Pacific |
| Largest Market | North America |
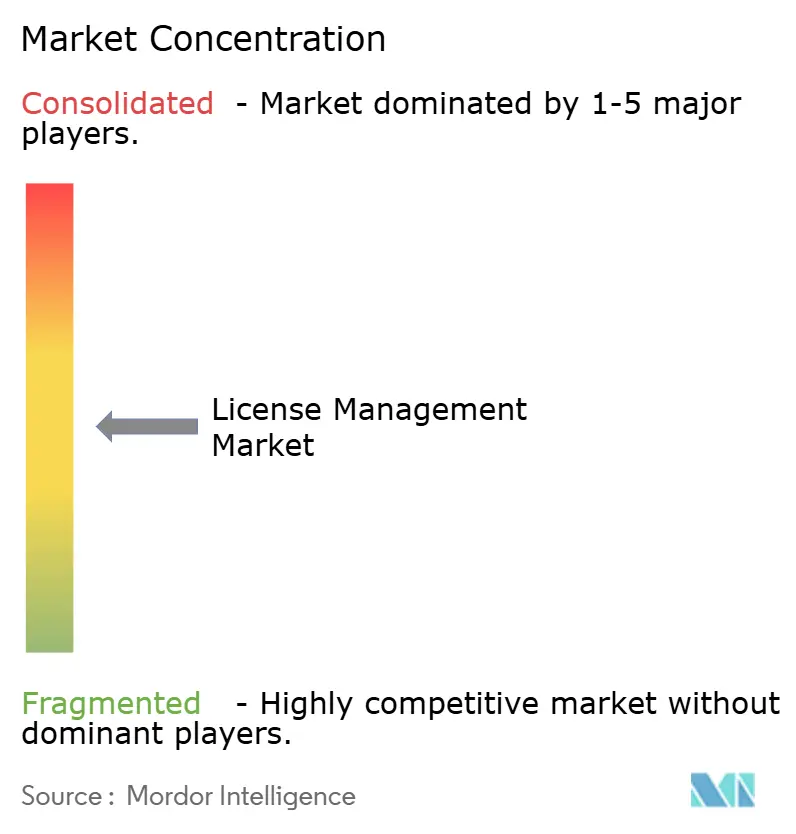
| Market Concentration | Medium |
Major Players *Disclaimer: Major Players sorted in no particular order Image © Mordor Intelligence. Reuse requires attribution under CC BY 4.0. | |
License Management Market Analysis by Mordor Intelligence
The License Management Market size is projected to be USD 1.43 billion in 2025, USD 1.59 billion in 2026, and reach USD 2.68 billion by 2031, growing at a CAGR of 11.01% from 2026 to 2031. Rapid migration to subscription pricing, stricter regulatory audits, and board-level FinOps mandates are elevating software entitlement governance from an IT back-office task to an enterprise-wide priority. Cloud-native license platforms that ingest SaaS, infrastructure, and on-premise telemetry in real time are displacing legacy on-device asset registers, while embedded AI engines highlight unused or duplicative contracts for reclamation. Vendors are adding pre-built connectors to identity providers and container orchestrators to flag compliance gaps before workloads go live, a capability viewed as critical by highly regulated banking, healthcare, and telecom operators. Competitive intensity is rising as incumbents acquire point solutions to deliver single-pane visibility across hybrid estates, yet mid-market challengers that promise agent-less discovery continue to gain traction.
Key Report Takeaways
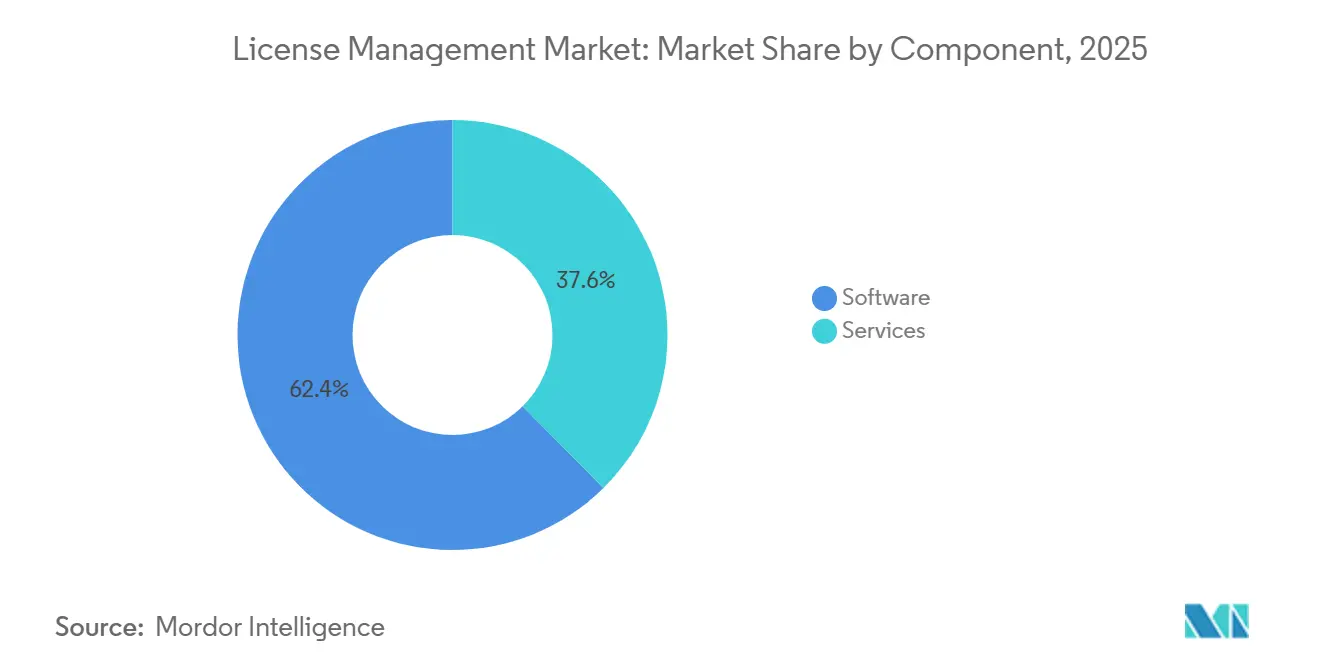
- By component, software solutions held the dominant 62.39% share of 2025 revenue, while advisory services are projected to log the fastest 11.29% CAGR between 2026 and 2031.
- By deployment, cloud-based platforms accounted for 72.34% of 2025 spending, and the same category is forecast to expand at a 11.26% CAGR through 2031.
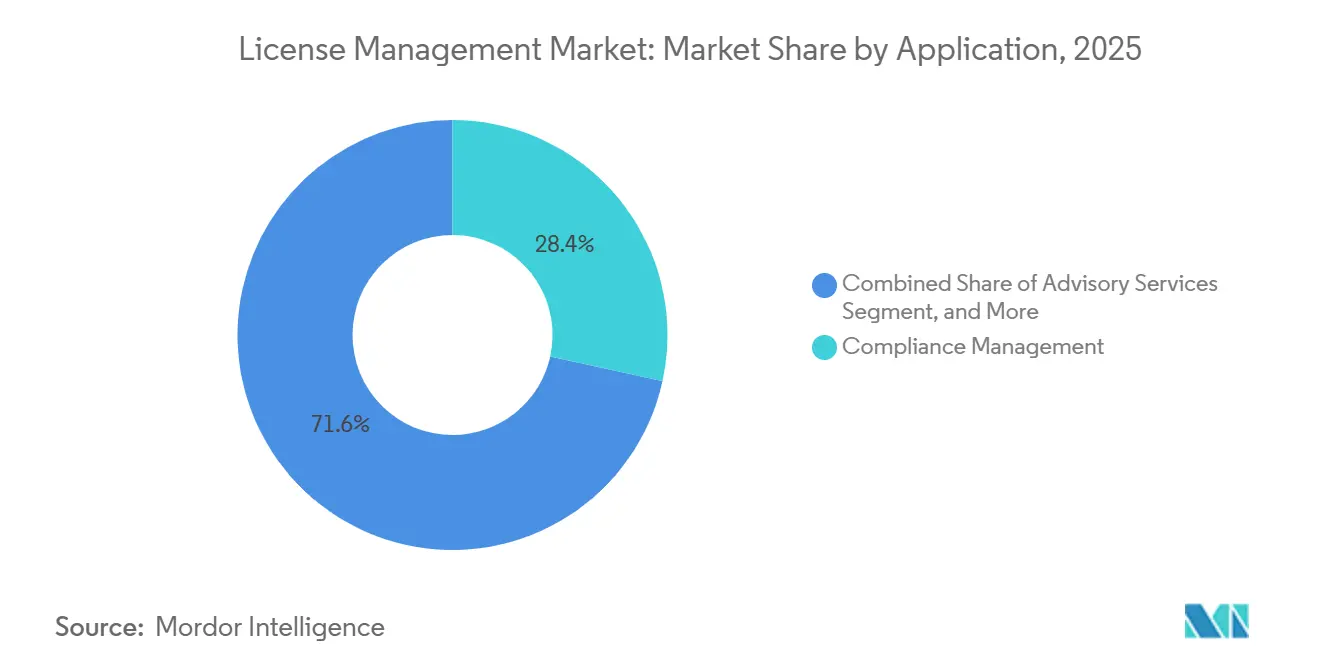
- By application, compliance management led with 28.44% of market revenue in 2025; advisory services are expected to advance at the quickest 12.34% CAGR over the forecast horizon.
- By end-user industry, banking, financial services, and insurance accounted for the largest 27.36% share in 2025, whereas healthcare and life sciences are set to grow at a leading 12.11% CAGR through 2031.
- By geography, North America accounted for the top 41.22% revenue share in 2025, while Asia-Pacific is projected to record the highest regional growth at a 12.07% CAGR through 2031.
Note: Market size and forecast figures in this report are generated using Mordor Intelligence’s proprietary estimation framework, updated with the latest available data and insights as of 2026.
Global License Management Market Trends and Insights
Drivers Impact Analysis*
| Driver | (~) % Impact on CAGR Forecast | Geographic Relevance | Impact Timeline |
|---|---|---|---|
| Accelerated Shift to SaaS and Subscription-Based Licensing | +2.8% | Global, strongest in North America and Western Europe | Medium term (2-4 years) |
| Heightened Frequency and Cost of Vendor Audits | +2.2% | North America, Europe, and Asia-Pacific enterprises | Short term (≤ 2 years) |
| Mandatory IT-Asset Optimization under FinOps Mandates | +1.9% | North America and Europe, emerging in Asia-Pacific financial services | Medium term (2-4 years) |
| AI-Driven Discovery of Shadow IT Licenses | +1.5% | Global, early adoption in North America technology and BFSI | Long term (≥ 4 years) |
| EU Digital Operational Resilience Act (DORA) Compliance Deadline | +1.2% | European Union, spillover to United Kingdom and Switzerland | Short term (≤ 2 years) |
| Embedded-Device License Monetization in IIoT Platforms | +0.9% | Germany, United States, China, Japan, South Korea | Long term (≥ 4 years) |
| Source: Mordor Intelligence | |||
Accelerated Shift to SaaS and Subscription-Based Licensing
Enterprises allocated 68% of new software spending to subscription contracts in 2025, up from 54% in 2023, as vendors retired perpetual models in favor of predictable annual revenue. Each tiered subscription, base seat, premium module, or usage-metered API creates separate entitlement records that must match invoices, driving demand for consolidated license platforms that can reconcile billing, telemetry, and renewal dates. Subscription sprawl is rising; large organizations managed an average of 364 SaaS applications last year, of which 31% showed no monthly active users.[1]Torii, “SaaS Management Index 2025,” toriihq.com Modern tools now embed recommendation engines that flag redundant contracts and trigger automated downgrade or cancellation workflows, helping firms prevent waste before renewals lock in costs. These savings-oriented features have become a top-five evaluation criterion when chief financial officers approve new software governance budgets.
Heightened Frequency and Cost of Vendor Audits
Software publishers expanded their compliance teams in 2025, conducting 22% more audits than in 2024 and raising the average Fortune 1000 settlement to USD 4.2 million.[2]Anglepoint, “Software Audit Trends 2025,” anglepoint.com Metric updates, such as Oracle’s revised core factor table and doubled license counts on select AMD EPYC instances, sparked 140 dispute filings within one quarter. Enterprises now integrate license platforms with hypervisor and Kubernetes APIs so that new virtual machines or pods cannot launch if entitlements are exhausted, preventing surprises when auditors arrive. Audit exposure also influences mergers and acquisitions, with buyers demanding escrow reserves averaging 18% of deal value when target companies cannot prove software compliance. This financial risk elevates proactive license governance from an IT concern to a board-level imperative.
Mandatory IT-Asset Optimization under FinOps Mandates
The FinOps Foundation’s 2024 standards made cross-functional cost accountability a board metric, and adopters cut per-employee software spend by 23% in 2025 versus peers without formal programs. Native dashboards in AWS Cost Explorer and Microsoft Azure now surface license utilization alongside infrastructure charges, enabling finance teams to allocate costs to projects or departments in real time.[3]Microsoft Investor Relations, “Fiscal 2025 Annual Report,” microsoft.com Database estates show the biggest gains; optimization engines recommended consolidating underused Oracle and SQL Server cores, trimming entitlement counts by up to 40%. Clear cost attribution strengthens negotiation positions at renewal, with enterprises achieving average contract savings of 17% when actual usage data accompanies bid requests. Regulators amplify urgency, as Sarbanes-Oxley auditors increasingly flag capitalized software assets that lack supporting license evidence.
AI-Driven Discovery of Shadow IT Licenses
Machine-learning engines embedded in modern platforms analyze identity-provider logs, expense feeds, and network traffic to uncover unsanctioned applications, surfacing 47 shadow tools per 1,000 employees in 2025. Collaboration and design apps like Notion and Figma comprised 38% of these findings, often duplicating capabilities already licensed in enterprise suites. Real-time risk scoring flags vendors lacking data-processing agreements that meet GDPR or CCPA standards, prompting immediate de-provisioning requests. Predictive models then correlate historical consumption with hiring plans, enabling proactive purchases or cancellations that reduced emergency procurement events by 29% last year. As ISO/IEC 19770 guidance now recommends autonomous discovery controls, AI-driven platforms are moving from early adoption to mainstream requirement for large enterprises.
Restraints Impact Analysis*
| Restraint | (~) % Impact on CAGR Forecast | Geographic Relevance | Impact Timeline |
|---|---|---|---|
| Opaque, Vendor-Specific License Terms and Metrics | -1.8% | Global, highest complexity within North America and Europe | Medium term (2-4 years) |
| Fragmented Point-Tool Ecosystem Increases Integration Costs | -1.2% | Global, mid-market enterprises most affected | Short term (≤ 2 years) |
| Limited Availability of Certified SAM Talent | -0.8% | Global, severe shortages in Asia-Pacific and emerging markets | Long term (≥ 4 years) |
| Rising Open-Source Adoption Reduces Commercial-License Volume | -0.6% | Global, highest in technology and telecommunications | Long term (≥ 4 years) |
| Source: Mordor Intelligence | |||
Opaque, Vendor-Specific License Terms and Metrics
Hybrid agreements bundle perpetual, subscription, and consumption charges but map prepaid “credits” to services at ratios that shift when workloads move, forcing constant recalculation. IBM’s processor value unit schedule assigns 120 PVUs to Intel Xeon Platinum cores versus 100 to AMD EPYC, exposing firms to penalties when they migrate instances across clouds without realigning entitlements. SAP’s digital access rules around indirect system use have generated USD 1.8 billion in settlements since 2024 and remain the subject of 340 legal disputes as of early 2026. Because internal teams rarely master these nuances, organizations spend an additional 12-18% of their total license outlay on external consultants charging USD 350 per hour to interpret the terms. Smaller businesses often over-purchase as a defensive tactic, inflating vendor revenue at the expense of true value realization.
Fragmented Point-Tool Ecosystem Increases Integration Costs
More than 200 niche vendors handle discrete tasks such as SaaS discovery or usage analytics, yet only 23% ship ready-made connectors for ERP or IT service management systems. Organizations that stitch together best-of-breed stacks invest about USD 280,000 annually in custom APIs and data-reconciliation scripts to keep records aligned across tools. Inventory silos invite audit discrepancies because entitlement counts in procurement systems rarely match deployments tracked by endpoint agents. Although consolidation is underway, as evidenced by Flexera’s 2025 acquisition of SaaS Manager, the complexity of migration and the sunk costs of legacy installations slow platform rationalization. Until standards such as ISO/IEC 19770-2 for software identification tags are widely adopted, integration friction will continue to suppress overall return on investment.
*Our forecasts treat driver/restraint impacts as directional, not additive. The impact forecasts reflect baseline growth, mix effects, and variable interactions.
Segment Analysis
By Component: Advisory Services Expand On Growing Complexity
Software platforms dominated the license management market with 62.39% market share in 2025, reflecting entrenched investments in discovery, reconciliation, and reporting engines that automate baseline compliance. These suites underpin the core of the license management market, yet mounting hybrid-contract and audit pressures expose coverage gaps that internal teams struggle to fill. Enterprises, therefore, lean on external specialists to interpret vendor-specific metrics, renegotiate enterprise agreements, and defend against audits that now assume seven-figure penalties. Advisory partners embed policy controls into existing tools, ensuring consumption baselines remain accurate when workloads shift from physical cores to virtual machines or serverless pods. The resulting blend of automated telemetry and expert oversight delivers quicker payback than software alone, anchoring platforms while expanding addressable services revenue.
The services segment is projected to grow at a 12.34% CAGR through 2031, outpacing every other component, as boards tie executive compensation to demonstrable cost avoidance and risk reduction. Typical engagements now combine short-burst audit defenses with multi-year managed operations, moving the fee model from time-and-materials to outcome-based contracts pegged to verified savings. Providers leverage generative AI to summarize unstructured contracts, freeing consultants to focus on high-value negotiation and architecture redesign. They also curate benchmark data that shows clients how their license densities compare with peers, a persuasive lever when seeking budget for remediation. As most large enterprises still carry dormant entitlements equal to 15-20% of their software estates, the expansion runway for advisory and managed services remains considerable.


By Deployment: Cloud Suites Command Structural Advantage
Cloud-hosted platforms captured 72.34% of the license management market in 2025, as buyers favored elastic analytics engines that ingest SaaS, infrastructure-as-a-service, and on-premises feeds without local maintenance. Continuous publisher-delivered updates let customers keep pace with shifting metric rules, avoiding the version freezes that plague on-site installations. Native connectors to Okta, Azure Active Directory, and public-cloud billing APIs surface provisioning anomalies within minutes, allowing remediation before audits uncover gaps. Security objections have receded now that leading vendors hold ISO 27001, SOC 2 Type II, and FedRAMP authorizations, opening U.S. federal and defense sectors to cloud deployment. This credibility drives a flywheel effect: each new regulated customer win becomes a proof-point marketing for the next prospect.
On-premise suites persist in air-gapped manufacturing lines, classified defense programs, and sovereignty-heavy jurisdictions, but their relative share declines annually as vendors discontinue perpetual licenses and raise support prices. Hybrid architectures offer a bridge, with lightweight collectors securing raw inventories behind the firewall and forwarding hashed metadata to cloud analytics cores located in certified regions. Such patterns satisfy both data-residency statutes and the demand for global dashboards that benchmark business-unit usage side by side. Cloud providers also promote bring-your-own-license optimization bundles, rewarding customers who centralize entitlements on their marketplaces with discounted compute. As migration complexity eases, the economic case for hosted suites strengthens, solidifying their leadership through the forecast window.
By Application: Compliance Core, Advisory Fastest
Compliance management tools accounted for 28.44% of 2025 revenue, validating that audit readiness remains the entry point for most purchasers. These modules reconcile inventory against entitlement records, flag over-deployment, and compile evidence packs aligned to ISO 19770 or SOX controls. Enterprises integrate them directly into IT service management workflows so that change tickets automatically create or retire license positions, shrinking manual reconciliation windows from weeks to hours. Usage dashboards overlay cost and consumption data, letting finance teams allocate charges by project or department in line with FinOps principles. Automation of these fundamentals frees practitioners to focus on proactive optimization rather than reactive cleanup.
Advisory services, however, stand out as the quickest-growing application, advancing at 12.34% CAGR through 2031 as vendors push complex indirect-access and consumption clauses. Consultants decode gray-area triggers, for example, when robotic process automation bots access SAP tables and redesign process flows to avoid premium SKUs. They guide clients on license portability, showing how shifting Oracle Database to AWS RDS Custom can cut core counts by up to 40%. True-up analytics predict renewal surprises 6 months in advance, enabling staged reallocation to prevent budget shock. Over time, insights from these engagements loop back into product roadmaps, catalyzing new automation that further expands the optimization category.

By End-User Industry: Healthcare Ascendant Under Regulatory Mandates
Banking, financial services, and insurance led spending, accounting for 27.36% of 2025 revenue, as Basel III and Sarbanes-Oxley audits require continuously attested software inventories. Financial institutions embed entitlement checkpoints in DevOps pipelines so that any code promoted to production first passes license compliance gates, a practice that has cut post-deployment audit findings by one-third. They also leverage granular cost attribution to justify closing underutilized database clusters and redirect savings toward regulatory tech modernization. Yet cost pressure remains acute as vendor audit teams concentrate on high-margin segments; consequently, BFSI buyers increasingly favor multi-vendor optimization strategies rather than single-suite dependence.
Healthcare and life sciences are projected to log a 12.11% CAGR to 2031, the fastest among all verticals, driven by FDA 21 CFR Part 11 mandates that require immutable audit trails for every software change affecting clinical data. Pharmaceutical manufacturers use license platforms to link firmware versions on lab instruments with electronic batch records, ensuring traceability from reagent to finished drug. Europe’s MDR extends similar obligations to software embedded in medical devices, accelerating demand for entitlement tracking across distributed fleets of imaging and diagnostic equipment. Heightened scrutiny following high-profile ransomware attacks also pushes hospitals to verify that patches and updates are within their licensed rights, thereby averting both security breaches and audit penalties. The intersection of patient safety, data privacy, and cost containment cements healthcare’s position as the growth engine for license governance.
Geography Analysis
North America retained 41.22% of 2025 revenue, the largest regional share of the license management market, as Sarbanes-Oxley Section 404 audits classify unlicensed software as a material weakness and drive continuous-monitoring investments. Mature FinOps disciplines and proximity to major publishers speed vendor-customer feedback loops, so rule changes propagate quickly through hosted compliance dashboards. The region’s public-sector appetite is also expanding because FedRAMP-authorized suites now meet U.S. federal and defense security thresholds, removing earlier deployment barriers. Cloud-first buyers further boost spend by bundling bring-your-own-license entitlements with discounted compute, a tactic that locks contracts into multi-year terms and sustains recurring revenue.
Europe accounted for 28% of global sales in 2025 and is growing steadily, as the EU Digital Operational Resilience Act obliges financial institutions to produce real-time software inventories within 72 hours of an incident. Multilingual contract bases complicate reconciliation, elevating demand for AI summarization that parses French, German, and Spanish license clauses into English-language dashboards. Sovereign-cloud preferences remain strong, so leading vendors host mirrored analytics nodes within the European Economic Area to comply with data-residency requirements. The continent also shows early adoption of embedded-device metering in industrial IoT hubs from Germany and the Nordics, expanding the market for license management of consumption-based entitlements tied to connected assets.
Asia-Pacific is the fastest mover, with a projected 12.07% CAGR through 2031, catalyzed by India’s Digital Personal Data Protection Act, which imposes fines of up to INR 2.5 billion (USD 30 million) for breaches traced to unpatched software. China’s Multi-Level Protection Scheme compels state-owned enterprises to deliver real-time ledgers to government portals, so local vendors embed connectors to Alibaba and Tencent clouds that publish inventories on demand. Japan’s 72-hour breach-notification window, added in the 2024 APPI amendments, is pushing healthcare and financial firms toward automated patch and entitlement orchestration. South America, the Middle East, and Africa together represent under 10% of the license management market today, yet both regions are logging high-single-digit growth as Brazil’s LGPD and the UAE’s DIFC rules mirror GDPR-style accountability and usher in first-time compliance investments.

Competitive Landscape
The top five suppliers, Flexera, Snow Software, ServiceNow, IBM, and Oracle, accounted for roughly 48% of 2025 revenue, confirming a moderately concentrated market in which no single player holds more than a 20% stake. Flexera intensified consolidation by acquiring SaaS Manager in December 2025, extending discovery coverage to 1,400 cloud apps and embedding automated rightsizing playbooks inside its Flexera One suite. SAP pursued a similar path by paying EUR 1.2 billion (USD 1.3 billion) for LeanIX to graft real-time architecture mapping onto its Business Technology Platform. These moves reflect a race to deliver end-to-end visibility across on-premises, SaaS, and container workloads under a single contract.
Platform roadmaps now converge on AI and cloud-native metering. ServiceNow launched SAM Pro AI in February 2026, using generative models to extract entitlement clauses from PDF contracts and autopopulate compliance fields, trimming manual data entry by 70%. Snow Atlas 2.0, released October 2025, added per-pod metering for Kubernetes, blocking container launches that exceed license caps and providing DevOps teams with real-time guardrails. IBM went the partnership route, embedding FlexNet Manager into its ITAM suite so that hybrid IBM Z and x86 estates can reconcile PVU counts in a single console.
Mid-market challengers remain disruptive despite consolidation at the top. Zylo and Torii advertise 30-day agent-less rollouts that mine SaaS admin APIs rather than desktop agents, a pitch that resonates with security-sensitive industries wary of endpoint installs. Thales Sentinel targets industrial IoT by offering consumption meters for device firmware, while open-source gateways such as Eclipse Kura nibble at low-budget deployments. Patent filings hint at next-wave differentiation: IBM secured three U.S. patents in 2025 covering blockchain-based entitlement ledgers that promise tamper-evident audit trails, though production use remains scarce. With more than 200 vendors still active, price competition coexists with specialization, and buyers increasingly mix heavyweight suites with niche optimizers to tailor coverage across sprawling hybrid estates.
License Management Industry Leaders
Flexera Software LLC
USU Software AG
DXC Technology Company
OpenLM Ltd
Reprise Software Inc.
- *Disclaimer: Major Players sorted in no particular order

Recent Industry Developments
- February 2026: ServiceNow released SAM Pro AI, adding generative models that auto-extract license clauses from vendor PDFs, cutting manual entry by 70%.
- December 2025: Flexera finalized the takeover of SaaS Manager, expanding its discovery catalog to 1,400 SaaS apps.
- November 2025: IBM and Flexera announced a partnership to unify mainframe and x86 license oversight under a single console.
- October 2025: Snow Software debuted Snow Atlas 2.0 with native Kubernetes pod metering and compliance gates.


Global License Management Market Report Scope
The License Management Market Report is Segmented by Component (Software, and Services), Deployment (On-Premise, and Cloud), Application (Audit Services, Advisory Services, Compliance Management, Licence Entitlement and Optimisation, Operations and Analytics, Other Applications), End-User Industry (Banking, Financial Services and Insurance, Healthcare and Life Sciences, Information Technology and Telecommunications, Media and Entertainment, Other End-User Industries), and Geography (North America, South America, Europe, Asia-Pacific, Middle East and Africa). The Market Forecasts are Provided in Terms of Value (USD).
| Software |
| Services |
| On-Premise |
| Cloud |
| Audit Services |
| Advisory Services |
| Compliance Management |
| Licence Entitlement and Optimisation |
| Operations and Analytics |
| Other Applications |
| Banking, Financial Services and Insurance |
| Healthcare and Life Sciences |
| Information Technology and Telecommunications |
| Media and Entertainment |
| Other End-User Industries |
| North America | United States | |
| Canada | ||
| Mexico | ||
| South America | Brazil | |
| Argentina | ||
| Rest of South America | ||
| Europe | United Kingdom | |
| Germany | ||
| France | ||
| Italy | ||
| Rest of Europe | ||
| Asia Pacific | China | |
| Japan | ||
| India | ||
| South Korea | ||
| Rest of Asia Pacific | ||
| Middle East and Africa | Middle East | United Arab Emirates |
| Saudi Arabia | ||
| Rest of Middle East | ||
| Africa | South Africa | |
| Egypt | ||
| Rest of Africa | ||
| By Component | Software | ||
| Services | |||
| By Deployment | On-Premise | ||
| Cloud | |||
| By Application | Audit Services | ||
| Advisory Services | |||
| Compliance Management | |||
| Licence Entitlement and Optimisation | |||
| Operations and Analytics | |||
| Other Applications | |||
| By End-User Industry | Banking, Financial Services and Insurance | ||
| Healthcare and Life Sciences | |||
| Information Technology and Telecommunications | |||
| Media and Entertainment | |||
| Other End-User Industries | |||
| By Geography | North America | United States | |
| Canada | |||
| Mexico | |||
| South America | Brazil | ||
| Argentina | |||
| Rest of South America | |||
| Europe | United Kingdom | ||
| Germany | |||
| France | |||
| Italy | |||
| Rest of Europe | |||
| Asia Pacific | China | ||
| Japan | |||
| India | |||
| South Korea | |||
| Rest of Asia Pacific | |||
| Middle East and Africa | Middle East | United Arab Emirates | |
| Saudi Arabia | |||
| Rest of Middle East | |||
| Africa | South Africa | ||
| Egypt | |||
| Rest of Africa | |||


Key Questions Answered in the Report
How large will global spending on dedicated license tools be by 2031?
The license management market is forecast to reach USD 2.68 billion by 2031, expanding at an 11.01% CAGR from 2026.
Which deployment model grows fastest over the next five years?
Cloud platforms maintain structural momentum, rising at 11.26% CAGR as vendors retire on-premise editions and enterprises seek unified visibility.
Why is healthcare adoption accelerating?
FDA 21 CFR Part 11 and EU MDR rules demand immutable audit trails for every software change that touches clinical or device data, driving a 12.11% CAGR in healthcare and life sciences.
What fuels rising audit exposure across industries?
Vendors intensified compliance reviews, updated metric tables, and broadened indirect-access clauses, pushing average Fortune 1000 settlements to USD 4.2 million in 2025.
How do modern platforms detect shadow IT usage?
They apply machine-learning models to identity-provider logs, network flow data, and expense records, uncovering an average of 47 unsanctioned apps per 1,000 employees last year.
Which regions present the highest near-term growth?
Asia-Pacific leads with a projected 12.07% CAGR through 2031 as data protection statutes in India, China, and Japan mandate real-time software inventories.
Page last updated on:


