Non-Profit Software Market Size and Share
Market Overview
| Study Period | 2020 - 2031 |
|---|---|
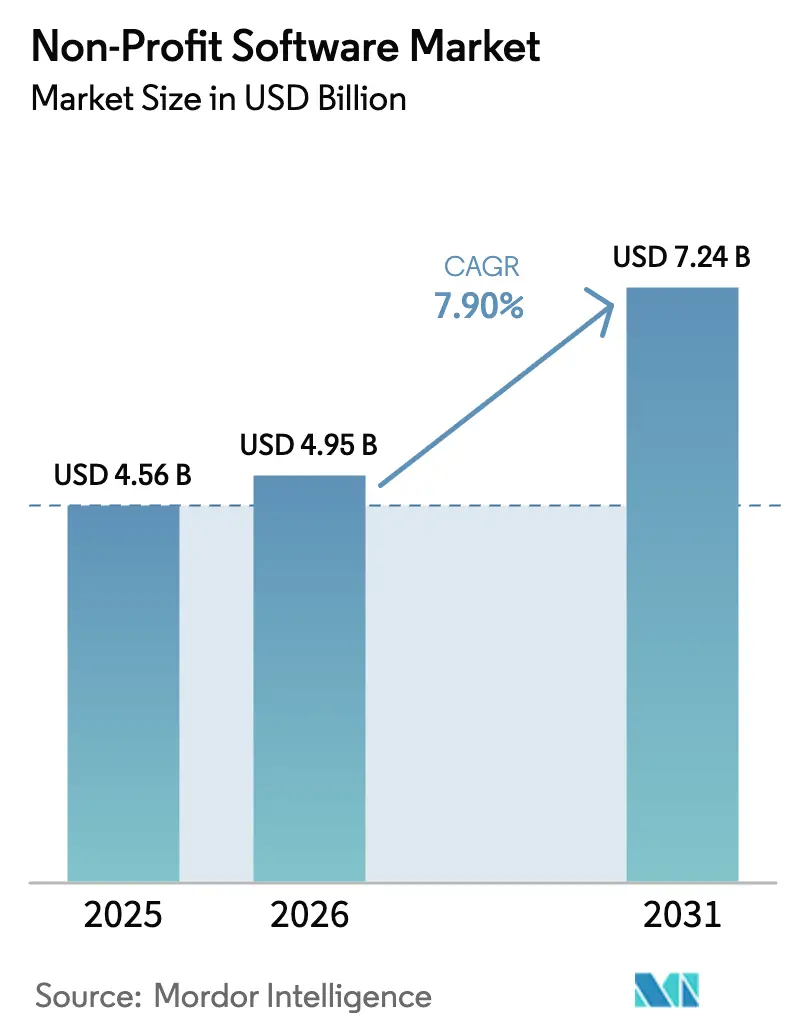
| Market Size (2026) | USD 4.95 Billion |
| Market Size (2031) | USD 7.24 Billion |
| Growth Rate (2026 - 2031) | 7.90% CAGR |
| Fastest Growing Market | Asia Pacific |
| Largest Market | North America |
| Market Concentration | Low |
Major Players*Disclaimer: Major Players sorted in no particular order Image © Mordor Intelligence. Reuse requires attribution under CC BY 4.0. | |
Non-Profit Software Market Analysis by Mordor Intelligence
The non-profit software market size is projected to expand from USD 4.59 billion in 2025 and USD 4.95 billion in 2026 to USD 7.24 billion by 2031, registering a CAGR of 7.9% between 2026 to 2031. Rising cloud subscription adoption, tighter regulatory reporting mandates, and expanding donor expectations for real-time transparency are reshaping budget priorities. Cloud-based deployments already account for more than four-fifths of revenue, and pricing models that spread costs over monthly operating budgets are accelerating uptake among small organizations. Large nonprofits remain the single biggest buyers, yet their share is slipping as mid-market adopters close the digital gap through freemium tiers and no-code tools. Competitive intensity is moderate, giving specialized vendors room to scale vertical solutions even while the top players deepen portfolios with AI, volunteer scheduling, and grant compliance.
Key Report Takeways
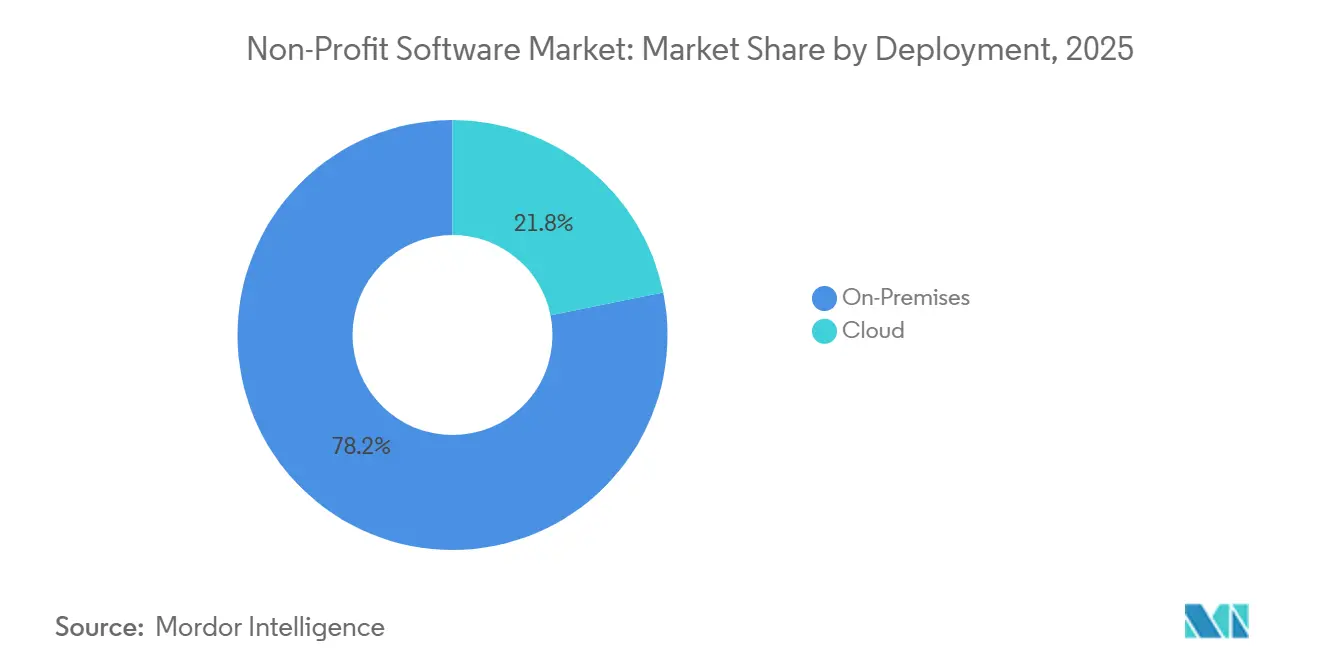
By deployment, cloud solutions led with 78.16% of the non-profit software market share in 2025, while on-premises alternatives lagged; cloud is advancing at an 8.67% CAGR through 2031.
By enterprise size, large nonprofits captured 52.18% revenue share in 2025, whereas small and medium organizations are expanding at an 8.94% CAGR to 2031.
By functional module, fundraising and donation management accounted for 44.74% of the non-profit software market size in 2025, and AI-enhanced analytics is forecast to expand at an 8.38% CAGR.
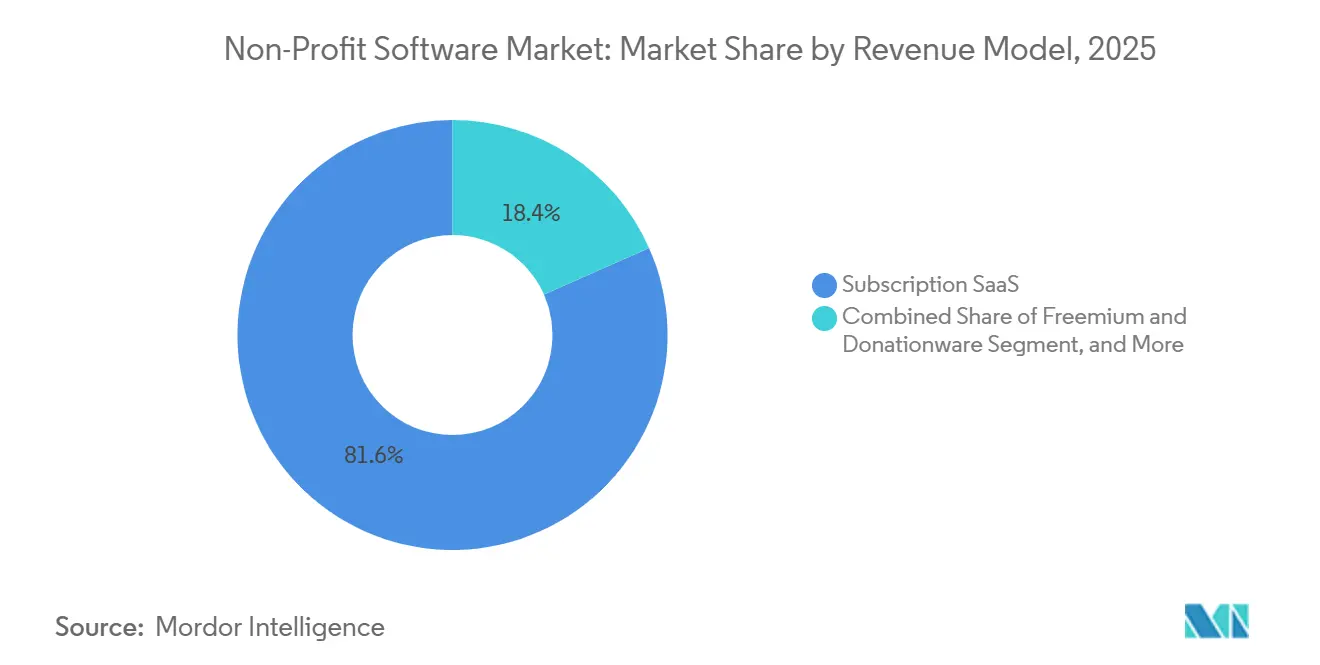
By revenue model, subscription SaaS commanded 81.64% share of the non-profit software market size in 2025, with freemium and donationware growing fastest at an 8.72% CAGR.
By end-user vertical, faith-based nonprofits held 31.93% share in 2025, while environmental and animal welfare organizations recorded the highest projected 8.49% CAGR.
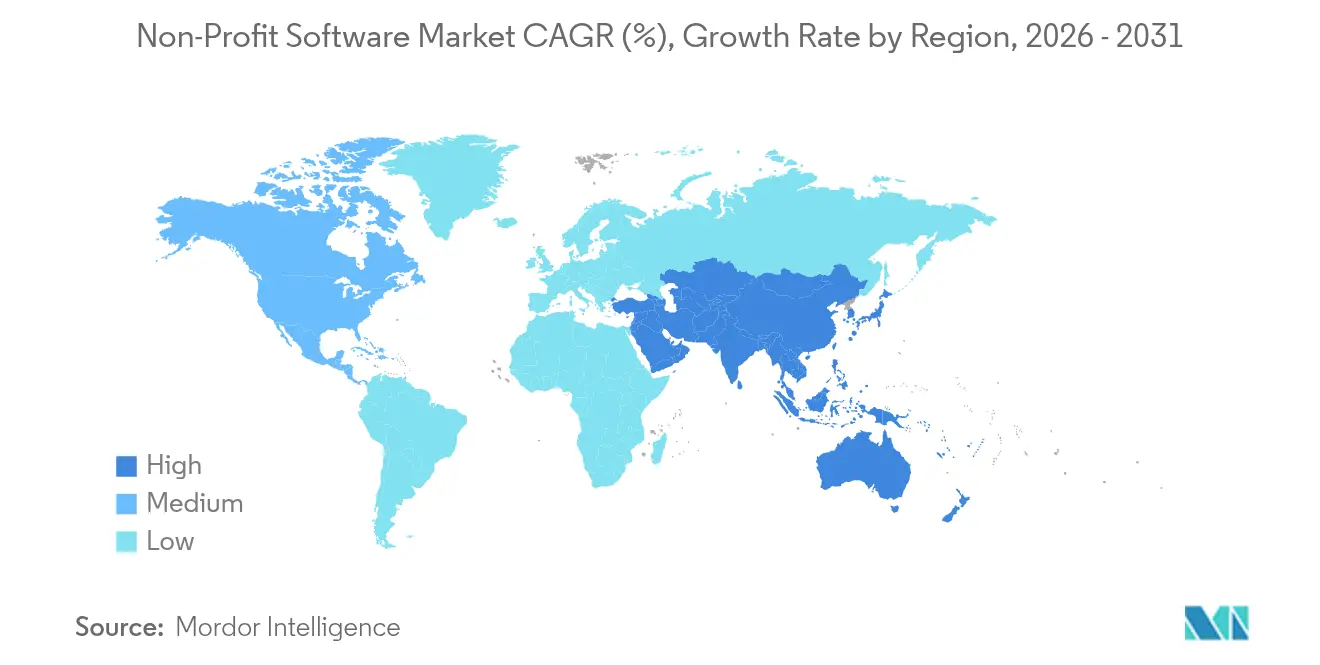
By geography, North America led with 38.59% revenue share in 2025; Asia-Pacific is the fastest-growing region at a 9.05% CAGR through 2031.
Note: Market size and forecast figures in this report are generated using Mordor Intelligence’s proprietary estimation framework, updated with the latest available data and insights as of 2026.
Global Non-Profit Software Market Trends and Insights
Driver Impact Analysis*
| Driver | (~) % Impact on CAGR Forecast | Geographic Relevance | Impact Timeline |
|---|---|---|---|
| Proliferation of Cloud-Based SaaS Solutions | +2.10% | Global, with early concentration in North America and Europe | Medium term (2-4 years) |
| Growing Demand for Integrated Fundraising and Donor Management Platforms | +1.80% | Global, particularly North America and Asia-Pacific | Medium term (2-4 years) |
| Emergence of AI-Driven Predictive Donor Analytics Boosting ROI | +1.50% | North America, Europe, Australia, urban centers in Asia-Pacific | Long term (≥ 4 years) |
| Rising Automation of Routine Nonprofit Workflows | +1.20% | Global, with faster uptake in organizations with revenue exceeding USD 500 million | Short term (≤ 2 years) |
| Expansion of Mobile and Digital Giving Channels | +0.90% | Global, led by North America, followed by Asia-Pacific and Europe | Short term (≤ 2 years) |
| Unified Data Ecosystems Allowing API-Based Sharing with Funder Discovery Networks | +0.60% | North America, Europe, select Asia-Pacific markets | Long term (≥ 4 years) |
| Source: Mordor Intelligence | |||


Proliferation Of Cloud-Based SaaS Solutions
Cloud deployments held 78.16% of revenue in 2025 and are growing at an 8.67% annual clip, nearly triple the pace of on-premises software. A 2025 ServiceNow-ThoughtLab survey of 300 nonprofit executives found that two-thirds now run end-to-end cloud platforms and plan deeper investments in collaboration and data infrastructure over the next three years.[1]ServiceNow, “Nonprofits and Digital Transformation in 2025,” SERVICENOW.COM Subscription pricing removes upfront capital commitments, shifting security and compliance burdens to vendors that can amortize those tasks across thousands of tenants. Remote-work norms locked in after 2023 further accelerated browser-based adoption, because staff require secure access from any device. Challenger vendors exploit this transition with niche modules such as tithing automation or memorial-day notifications that integrate natively with AWS or Microsoft Azure back-ends. The resulting ecosystem diversity pressures incumbents to innovate or risk churn among mid-tier buyers seeking specialized functionality.
Growing Demand for Integrated Fundraising and Donor Management Platforms
Fundraising modules served as the system of record for 44.74% of market spending in 2025, and nonprofits are actively collapsing point solutions into unified donor databases. DonorPerfect reported facilitating more than USD 100 billion in gifts for 50,000 professionals, with religious-sector clients achieving year-one giving lifts of 25%.[2]DonorPerfect, “Nonprofit Software Solutions,” DONORPERFECT.COM Integration reduces manual data entry that previously consumed up to one-fifth of development-staff hours, freeing teams to focus on relationship building. Vendor alliances illustrate consolidation momentum: Bloomerang embedded Qgiv’s peer-to-peer tools in May 2025, and Sage co-developed Intacct Fundraising for full ledger-to-donor transparency. Unified stacks also simplify compliance reporting by ensuring gift restrictions, event proceeds, and volunteer hours share a single audit trail. As mobile and digital giving norms mature, the appetite for one-stop platforms that merge email, text, events, and accounting continues to strengthen.
Emergence Of AI-Driven Predictive Donor Analytics Boosting ROI
AI-enhanced analytics is the fastest-growing module at 8.38% through 2031, enabling nonprofits to forecast churn, optimize ask amounts, and surface major-gift prospects. Salesforce.org’s 2025 Connected Nonprofit study found that more than three-quarters of surveyed organizations now use some form of artificial intelligence, with predictive scoring improving email open rates by up to 25%.[3]Salesforce.org, “State of the Connected Nonprofit 2025,” SALESFORCE.ORG Machine-learning engines demand large, clean datasets, which incentivizes nonprofits to centralize constituent records and digitize offline interactions. Vendors are adding explainability dashboards that display the variables driving each recommendation, a key transparency safeguard as regulators finalize algorithmic accountability statutes. Early adopters report double-digit boosts in campaign response and recurring-gift upgrades, validating the investment even for mid-sized charities. However, only 14-16% maintain formal AI governance frameworks, opening a compliance risk that providers must mitigate through templated policy kits and configurable privacy controls.
Rising Automation of Routine Nonprofit Workflows
Automation reduces back-office drag by triggering receipts, reconciling gifts, and reminding volunteers without human intervention. Bloomerang’s May 2025 release of a standalone volunteer module eliminated spreadsheet scheduling by handling shift reminders and hour logging automatically. The ServiceNow study noted that nonprofits allocate just 3.9% of revenue to technology, yet nearly half of executives concede insufficient digital expertise. Automation packages that ship pre-configured best practices therefore resonate with lean teams lacking IT staff. Time saved on monthly closes often trimmed by 30-40% funnels toward program delivery and donor cultivation. Vendors that simplify configuration through wizard-based setups or AI-assisted onboarding are gaining share among resource-constrained buyers seeking quick wins.
Restraints Impact Analysis*
| Restraint | (~) % Impact on CAGR Forecast | Geographic Relevance | Impact Timeline |
|---|---|---|---|
| Budget Constraints among Small Nonprofits | -1.40% | Global, most acute in South America, Africa, and rural areas of Asia-Pacific | Short term (≤ 2 years) |
| Data Security and Privacy Concerns with Cloud Solutions | -0.90% | Global, with heightened sensitivity in Europe and North America due to GDPR and CCPA | Medium term (2-4 years) |
| Rising Transaction Fees from Embedded Payment Platforms Eroding Donation Value | -0.70% | Global, disproportionately affecting small-dollar donations in North America and Europe | Medium term (2-4 years) |
| Growing Regulatory Scrutiny over AI-Generated Donor Insights | -0.50% | North America, Europe, Australia, with emerging frameworks in Asia-Pacific | Long term (≥ 4 years) |
| Source: Mordor Intelligence | |||
Budget Constraints Among Small Nonprofits
Organizations with revenue under USD 500,000 struggle to justify software outlays, and 51% report technology costs consume an outsized share of operating budgets. Freemium tiers alleviate entry barriers but often gate advanced reporting or multi-user permissions behind paywalls, forcing trade-offs between capability and cash flow. Tiered pricing based on database size introduces budgeting uncertainty for grant-funded groups that must lock expenditures a year ahead. While philanthropic tech grants exist, application cycles add latency, and awards seldom cover long-term subscription renewals. Vendors experimenting with outcome-based pricing where fees scale with dollars raised face resistance from boards wary of revenue-share optics. Bridging this affordability gap remains essential for sustaining non-profit software market expansion among grassroots entities.
Data Security and Privacy Concerns with Cloud Solutions
Phishing and ransomware battered 43% of nonprofits in 2024, yet many still lack multi-factor authentication or regular security audits.[4]Infoxchange, “APAC NGO Digital Capability Report 2024,” INFOXCHANGE.ORG Consolidating donor and beneficiary data on third-party clouds amplifies breach repercussions and triggers strict GDPR and CCPA liabilities, including fines of up to 4% of global revenue. Vendors tout ISO 27001 and SOC 2 credentials, but smaller charities often cannot assess the nuance between attestations, defaulting to legacy providers perceived as safer. Data-residency mandates further complicate global deployments by requiring localized hosting or encryption keys. In response, platform roadmaps now prioritize zero-trust architectures, field-level encryption, and granular consent management. Adoption hinges on vendors packaging these safeguards in human-readable dashboards that demystify risk for non-technical administrators.
*Our forecasts treat driver/restraint impacts as directional, not additive. The impact forecasts reflect baseline growth, mix effects, and variable interactions.
Segment Analysis
By Deployment: Cloud Dominance Continues to Widen
Cloud platforms commanded 78.16% of 2025 revenue, underscoring how per-seat subscriptions and automatic updates resonate with organizations lacking IT staff. The non-profit software market size for cloud solutions is projected to climb at an 8.67% CAGR through 2031, far outpacing on-premises growth. Even legacy heavyweights now promote hybrid models that keep sensitive finance data on internal servers while shifting donor outreach to the cloud. Infoxchange’s Asia-Pacific survey shows more than 60% of nonprofits still lack integrated impact-tracking systems, implying substantial headroom for SaaS penetration.
Feature velocity further tilts preference toward SaaS because every tenant receives new fraud-detection algorithms, mobile layouts, and compliance patches simultaneously. Bloomerang’s 2025 Mailchimp sync arrived via an overnight push, sparing customers lengthy upgrade windows. On-premises buyers must stage upgrades, validate custom scripts, and shoulder infrastructure costs, challenges that sway many to phased migrations. Emerging markets leapfrog desktop eras altogether, adopting mobile-first cloud dashboards that operate on modest bandwidth. As internet penetration deepens, the on-premises share of the non-profit software market is expected to erode below 15% by the decade’s end.

By Enterprise Size: Mid-Market Acceleration Narrows the Digital Divide
Large nonprofits held 52.18% of 2025 spending due to complex requirements for multi-currency ledgers, chapter consolidation, and enterprise integrations. However, small and medium organizations are expanding adoption at an 8.94% CAGR, driven by no-code configuration, self-guided training, and price points under USD 1,000 per year. The ServiceNow study segments 20% of nonprofits as digital pacesetters 85% boasting revenue above USD 1 billion yet the advancer tier is swelling as freemium models’ graduate users into paid analytics.
Economic scalability favours vendors that serve both ends of the spectrum: enterprise contracts fund R&D while vast mid-market volumes deliver recurring cash flow. Bonterra’s acquisition of OneCause adds 14,000 mostly mid-sized customers, signalling belief that consolidation will funnel fragmented buyers into integrated suites. Small teams with two to ten staff value turnkey templates for donor journeys, volunteer shifts, and grant calendars over customizable but complex enterprise stacks. Over the forecast horizon, the small-and-medium cohort will capture incremental share of the non-profit software market as vendor competition pushes subscription prices lower and AI onboarding accelerates time to value.
By Functional Module: Predictive Analytics Surges Beyond Core Fundraising
Fundraising and donation management captured 44.74% of 2025 expenditure, yet predictive analytics is the fastest-growing module at 8.38% CAGR. Constituent relationship management databases fuel these engines with longitudinal giving, event attendance, and volunteer history. Salesforce.org reports AI segmentation lifts email open rates by 20-25% relative to rule-based lists. The non-profit software market size attached to AI modules is expected to more than double by 2031 as model training costs fall and pre-built propensity scores proliferate.
Volunteer management is experiencing a renaissance because labour coordination represents a tangible pain point. Bloomerang Volunteer auto-assigns shifts, texts reminders, and tallies hours for impact dashboards. Finance and grant modules remain mission-critical for compliance-heavy sectors like healthcare and international aid, demonstrated by Sage Intacct’s AI Copilot that parses ledgers conversationally. Peer-to-peer fundraising, auctions, and SMS giving are being absorbed into larger suites, suggesting that standalone point solutions must pivot toward deep impact measurement or perish amid platform consolidation.
By Revenue Model: Subscription SaaS Anchors Long-Term Recurring Growth
Subscription SaaS dominated 81.64% of revenue in 2025, reflecting board preferences for predictable monthly costs and vendor accountability for uptime. Freemium and donationware tiers, expanding 8.72% annually, attract early-stage nonprofits and create a low-friction on-ramp to paid analytics once donor files exceed 5,000 contacts. Give Lively famously waives both subscription and transaction fees, monetizing optional add-ons that appeal to scaling charities.
Perpetual licensing survives primarily among institutions with IT departments comfortable patching servers and budgeting multiyear capital projects, though maintenance contracts increasingly mimic subscription economics. The tension in freemium models is lifetime value: nonprofits resist price hikes more than commercial buyers, so vendors cap free tiers by database size or feature depth to force upgrades. Over the forecast period, recurring revenue will remain the yardstick investors apply to valuation, maintaining pressure on vendors to refine monetization without alienating mission-driven clients.

By End-User Vertical: Faith-Based Dominance Meets Environmental Momentum
Faith-based and religious organizations generated 31.93% of 2025 demand, buoyed by recurring gift automation and fund accounting that separates ministries within a single ledger. DonorPerfect serves more than 600 such institutions, citing multi-year giving lifts exceeding 40%. The non-profit software market share of faith-based groups is expected to edge slightly lower as other segments digitize, but absolute spending will still grow.
Environmental and animal welfare nonprofits show the fastest 8.49% CAGR, motivated by donor cohorts that expect blockchain-verified fund allocation and wildlife analytics dashboards. RKD Group’s 2024 benchmark pegged average donor value at USD 215, yet acquisition softness amplifies urgency for predictive retention tools. Healthcare foundations prioritize HIPAA-compliant grant reporting, while education charities integrate alumni CRMs with advancement offices. Human services and international aid demand mobile offline apps for field data capture across multiple currencies. Vendors able to ship vertical plugins like Yahrzeit tracking or camera-trap AI will capture premium pricing by solving mission-specific pain points.
Geography Analysis
North America contributed 38.59% of 2025 revenue on the back of extensive foundation networks, tax incentives, and a mature vendor landscape. Large hospital systems and faith-based megachurches purchase enterprise suites, while tens of thousands of grassroots charities adopt freemium dashboards, sustaining a healthy long-tail. Tight labour markets drive automation demand, and California’s privacy statutes nudge vendors toward robust consent tooling.
Europe follows with steady but regulation-constrained uptake. GDPR compliance inflates the total cost of ownership, and country-specific mandate variations require configurable data-residency controls. Germany, the United Kingdom, and France focus on grant management and impact reporting modules to satisfy government funders. Eastern Europe remains nascent, hampered by limited philanthropic infrastructure.
Asia-Pacific is the breakout growth engine at a projected 9.05% CAGR. Government digital mandates in India, Australia, and Singapore subsidize cloud migrations, while rising middle-class philanthropy widens the addressable base. Infoxchange’s survey noted that only half of 1,500 nonprofits feel technologically confident, highlighting demand for capacity-building services. Middle East adoption centers on Saudi Arabia and the United Arab Emirates as Vision 2030 channels funding into education and culture. In Africa, pockets of sophistication appear in South Africa and Kenya, though low bandwidth steers buyers toward mobile-optimized cloud interfaces. South America’s buyers wrestle with currency volatility, prompting appetite for low-fee payment processors and churn-prediction analytics that maximize donor lifetime value.

Competitive Landscape
The five largest vendors Blackbaud, Salesforce, Bonterra, Microsoft, and Oracle collectively hold an estimated 40-45% of global revenue, underscoring a moderately concentrated field that still rewards specialists. Competitive fronts include module breadth, vertical depth, and total cost of ownership. Bonterra’s October 2025 purchase of OneCause instantly bolstered its event fundraising franchise and added 14,000 customers who generated USD 8 billion in donations. Bloomerang has stitched in Qgiv, Mailchimp, and Amilia integrations to widen its appeal without inflating R&D costs.
New-generation platforms such as Virtuous and Funraise differentiate through sleek interfaces and native mobile analytics that resonate with younger development staff. Give Lively’s zero-fee stance pressures incumbents on pricing, although the absence of premium analytics may limit stickiness among data-mature charities. Sage’s AI Copilot pushes the innovation frontier by letting finance teams query ledgers conversationally and receive automated variance explanations.
White space persists in impact measurement and beneficiary case management, areas where horizontal CRMs lack domain nuance. Vendors seeking durable advantage invest in API ecosystems that let third parties bolt on specialized tools without forcing data silos. As predictive algorithms permeate every module, explainability and governance features will be essential competitive levers, particularly in Europe and California where forthcoming regulations impose algorithmic transparency.
Non-Profit Software Industry Leaders
Bloomerang, LLC
Salesforce, Inc.
Microsoft Corporation
Neon One, LLC
Double the Donation, LLC
- *Disclaimer: Major Players sorted in no particular order

Recent Industry Developments
- October 2025: Bonterra acquired OneCause, adding 14,000 nonprofit clients and reinforcing its leadership in peer-to-peer fundraising.
- May 2025: Foundant Technologies deepened grant-making functionality through a strategic partnership with SmartSimple, adding automated compliance workflows and advanced impact dashboards.
- May 2025: Bloomerang and Qgiv partnered to embed peer-to-peer fundraising and auction tools directly inside Bloomerang CRM.
- May 2025: Sage introduced AI Copilot for Sage Intacct, providing natural-language financial queries and automated variance analysis.


Global Non-Profit Software Market Report Scope
The Non-Profit Software Market Report is Segmented by Deployment (On-Premises, Cloud), Enterprise Size (Small and Medium Nonprofits, Large Nonprofits), Functional Module (Fundraising and Donation Management, Constituent/CRM, Marketing and Engagement, Volunteer Management, Grant Management, Finance and Accounting, Other Modules), Revenue Model (Subscription SaaS, Perpetual License, Freemium and Donationware), End-User Vertical (Education Nonprofits, Healthcare and Hospital Foundations, Faith-Based and Religious, Human Services and International Aid, Arts and Culture, Environmental and Animal Welfare, Other Verticals), and Geography (North America, Europe, Asia-Pacific, Middle East, Africa, South America). The Market Forecasts are Provided in Terms of Value (USD).
| On-Premises |
| Cloud |
| Small and Medium Nonprofits |
| Large Nonprofits |
| Fundraising and Donation Management |
| Constituent / CRM |
| Marketing and Engagement |
| Volunteer Management |
| Grant Management |
| Finance and Accounting |
| Other Functional Module |
| Subscription SaaS |
| Perpetual License |
| Freemium and Donationware |
| Education Nonprofits |
| Healthcare and Hospital Foundations |
| Faith-Based and Religious |
| Human Services and International Aid |
| Arts and Culture |
| Environmental and Animal Welfare |
| Other End-User Vertical |
| North America | United States |
| Canada | |
| Mexico | |
| Europe | Germany |
| United Kingdom | |
| France | |
| Russia | |
| Rest of Europe | |
| Asia-Pacific | China |
| Japan | |
| India | |
| South Korea | |
| Australia | |
| Rest of Asia-Pacific | |
| Middle East | Saudi Arabia |
| United Arab Emirates | |
| Rest of Middle East | |
| Africa | South Africa |
| Egypt | |
| Rest of Africa | |
| South America | Brazil |
| Argentina | |
| Rest of South America |
| By Deployment | On-Premises | |
| Cloud | ||
| By Enterprise Size | Small and Medium Nonprofits | |
| Large Nonprofits | ||
| By Functional Module | Fundraising and Donation Management | |
| Constituent / CRM | ||
| Marketing and Engagement | ||
| Volunteer Management | ||
| Grant Management | ||
| Finance and Accounting | ||
| Other Functional Module | ||
| By Revenue Model | Subscription SaaS | |
| Perpetual License | ||
| Freemium and Donationware | ||
| By End-User Vertical | Education Nonprofits | |
| Healthcare and Hospital Foundations | ||
| Faith-Based and Religious | ||
| Human Services and International Aid | ||
| Arts and Culture | ||
| Environmental and Animal Welfare | ||
| Other End-User Vertical | ||
| By Geography | North America | United States |
| Canada | ||
| Mexico | ||
| Europe | Germany | |
| United Kingdom | ||
| France | ||
| Russia | ||
| Rest of Europe | ||
| Asia-Pacific | China | |
| Japan | ||
| India | ||
| South Korea | ||
| Australia | ||
| Rest of Asia-Pacific | ||
| Middle East | Saudi Arabia | |
| United Arab Emirates | ||
| Rest of Middle East | ||
| Africa | South Africa | |
| Egypt | ||
| Rest of Africa | ||
| South America | Brazil | |
| Argentina | ||
| Rest of South America | ||


Key Questions Answered in the Report
What is the projected value of the non-profit software market in 2031?
It is forecast to reach USD 7.24 billion by 2031.
Which deployment approach is growing fastest among nonprofits?
Cloud-based subscription platforms are expanding at an 8.67% CAGR through 2031.
Which functional module shows the quickest growth?
AI-enhanced analytics is advancing at an 8.38% CAGR as organizations seek predictive donor insights.
Which region offers the highest future growth opportunity?
Asia-Pacific is expanding at a 9.05% CAGR, outpacing all other regions.
How concentrated is vendor competition?
The top five suppliers hold roughly 40-45% of revenue, indicating moderately concentrated competition.
Why are freemium pricing models popular?
They let cash-constrained nonprofits start for free and upgrade later, though vendors cap usage to encourage eventual paid adoption.
Page last updated on:


