Application Lifecycle Management (ALM) Market Size and Share
Market Overview
| Study Period | 2020 - 2031 |
|---|---|
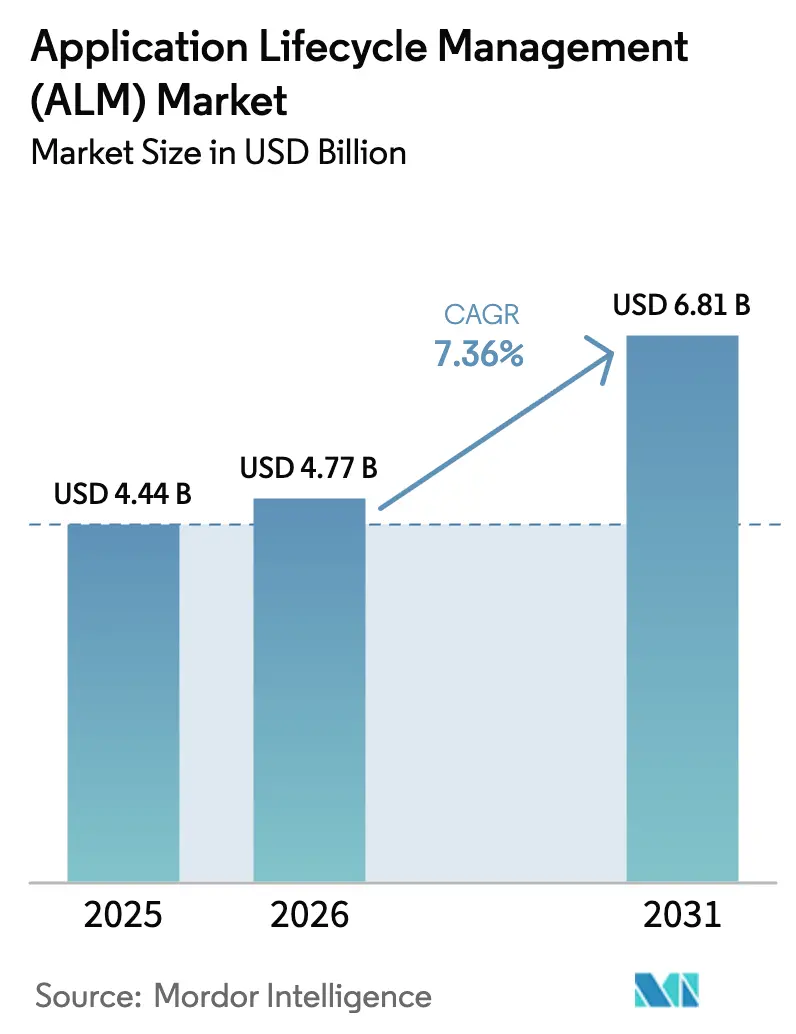
| Market Size (2026) | USD 4.77 Billion |
| Market Size (2031) | USD 6.81 Billion |
| Growth Rate (2026 - 2031) | 7.36% CAGR |
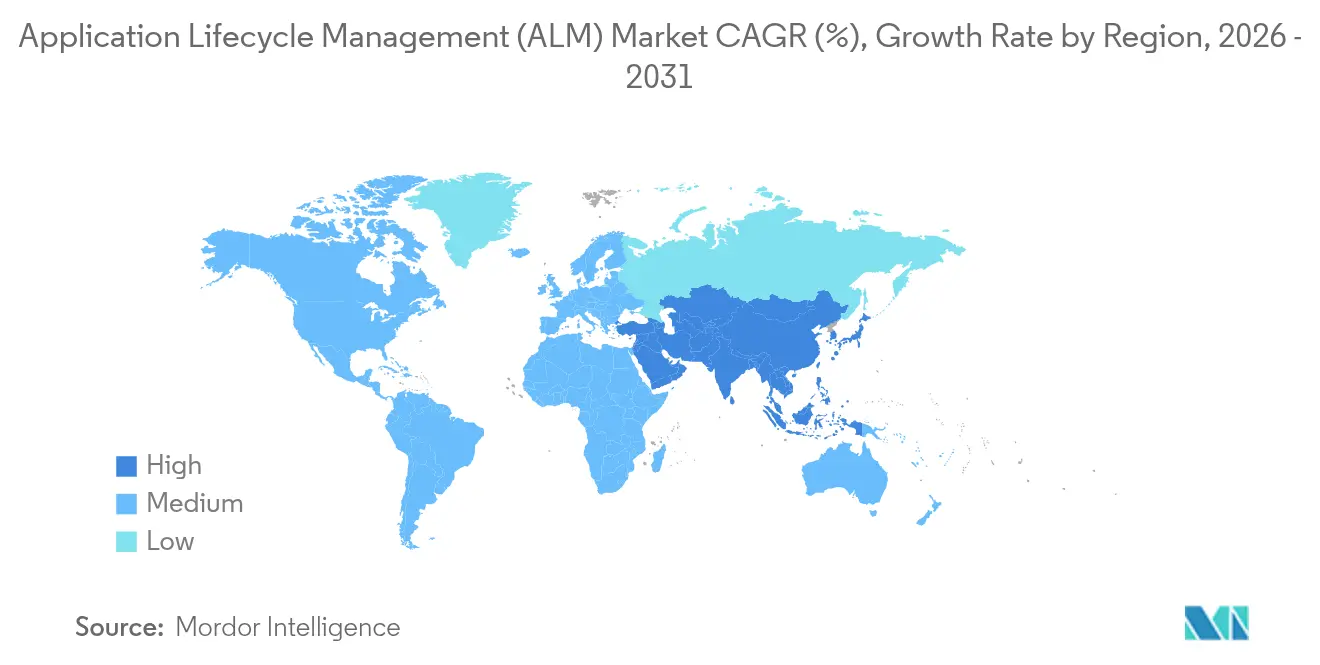
| Fastest Growing Market | Asia Pacific |
| Largest Market | North America |
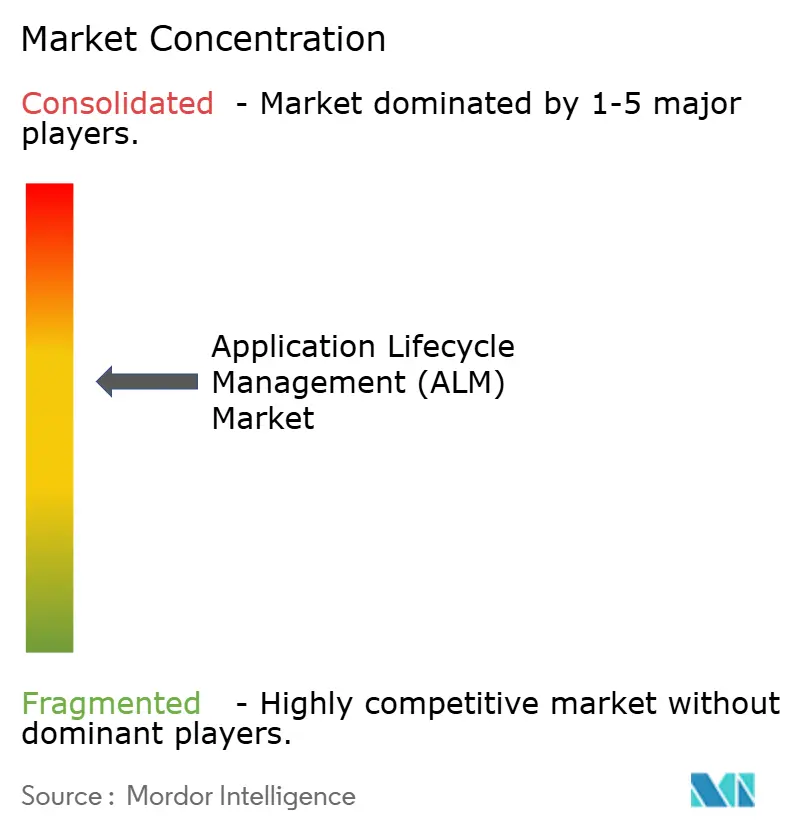
| Market Concentration | Medium |
Major Players *Disclaimer: Major Players sorted in no particular order Image © Mordor Intelligence. Reuse requires attribution under CC BY 4.0. | |
Application Lifecycle Management (ALM) Market Analysis by Mordor Intelligence
The application lifecycle management market size was valued at USD 4.44 billion in 2025 and estimated to grow from USD 4.77 billion in 2026 to reach USD 6.81 billion by 2031, at a CAGR of 7.36% during the forecast period (2026-2031). This growth reflects the sharp rise in software complexity, the quickening pace of DevOps adoption, and the mandate for integrated governance frameworks that stretch from ideation to retirement. Regulatory momentum—especially the United States’ Executive Orders 14028 and 14144—now requires software vendors to produce Software Bills of Materials, accelerating investment in platforms that automate component traceability. Simultaneously, the fusion of ALM and artificial intelligence is introducing predictive testing, intelligent backlog management, and automated remediation, allowing teams to handle fast-growing generative-AI code bases without losing oversight. Vendors that deliver vertical templates, tight AI integrations, and cloud-native scale are redefining competitive dynamics in the application lifecycle management market.
Key Report Takeaways
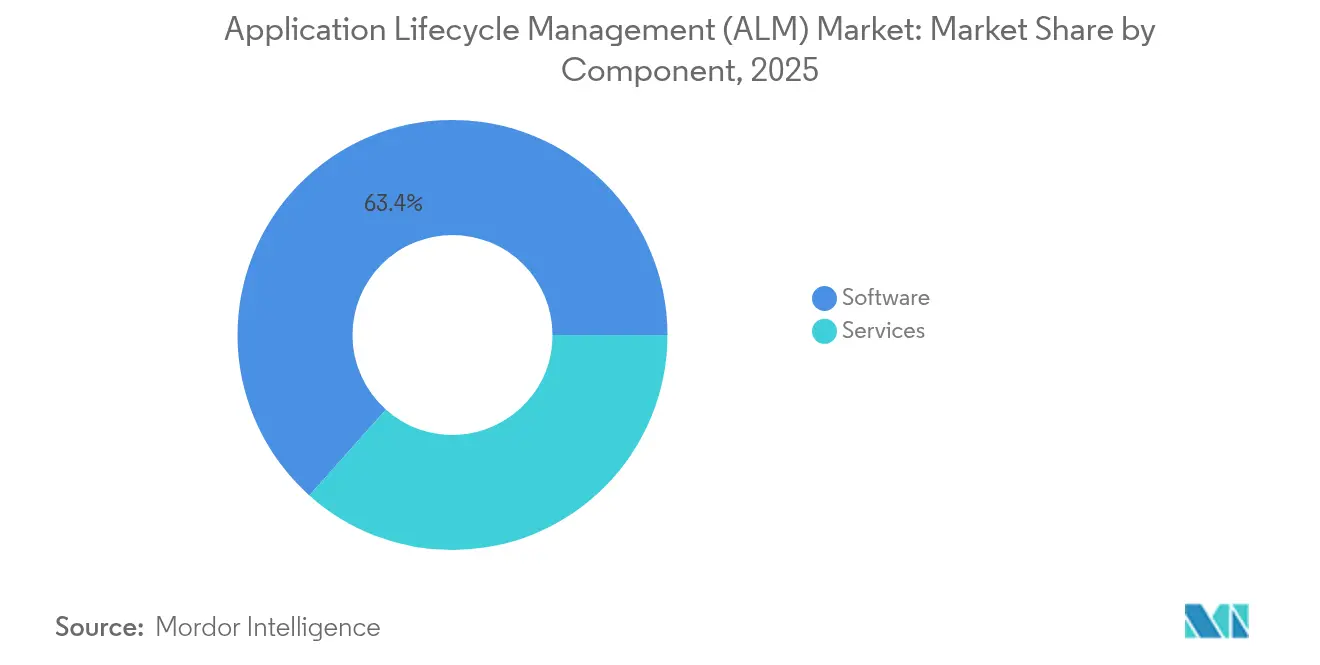
- By component, software held 63.40% of 2025 revenue; services are the fastest-growing element, expanding at a 10.12% CAGR through 2031.
- By platform, web-based tools accounted for 57.30% of 2025 usage, while mobile-based solutions are on track for an 11.18% CAGR to 2031.
- By deployment model, cloud solutions are expanding at a 11.95% CAGR, outpacing on-premise options across the application lifecycle management market size forecast horizon.
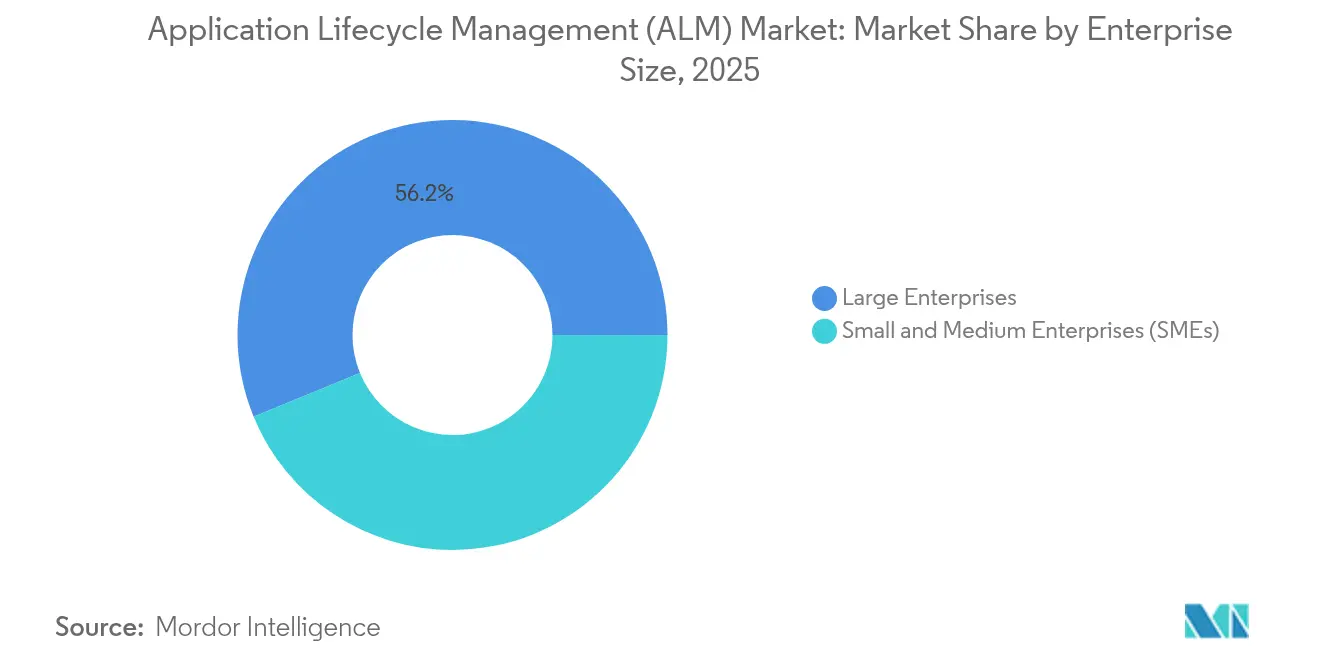
- By enterprise size, large enterprises captured 56.20% of 2025 revenue; SMEs are projected to grow at an 10.74% CAGR.
- By industry, IT and Telecom led with 25.60% of application lifecycle management market share in 2025; manufacturing is poised for a 11.36% CAGR to 2031.
- By geography, North America held 38.90% of the 2025 application lifecycle management market share, while Asia–Pacific is the fastest-growing region with a 8.72% CAGR.
Note: Market size and forecast figures in this report are generated using Mordor Intelligence’s proprietary estimation framework, updated with the latest available data and insights as of 2026.
Global Application Lifecycle Management (ALM) Market Trends and Insights
Driver Impact Analyis*
| Driver | (~) % Impact on CAGR Forecast | Geographic Relevance | Impact Timelines |
|---|---|---|---|
| Adoption of agile and DevOps practices | +1.5% | Global; strongest in North America & Europe | Medium term (2-4 years) |
| Surge in cloud-native ALM deployments | +1.7% | Global; early uptake in North America | Medium term (2-4 years) |
| Demand for end-to-end traceability to meet safety & quality mandates (ISO 26262, FDA, etc.) | +1.9% | North America, Europe, Japan | Long term (≥ 4 years) |
| ALM–AI convergence for GenAI code-generation governance | +1.0% | North America, Europe, Asia-Pacific | Medium term (2-4 years) |
| Mandatory Software Bill of Materials (SBOM) regulations | +0.8% | North America & Europe | Short term (≤ 2 years) |
| Rapid proliferation of low-code / no-code development platforms | +1.3% | Global; high uptake among SMEs in Asia-Pacific & Europe | Medium term (2-4 years) |
| Source: Mordor Intelligence | |||
Adoption of Agile and DevOps Practices
More than 70% of development teams now rely on agile frameworks, forcing platforms to combine sprint planning, automated builds, and audit-ready documentation in one cohesive flow. Hybrid governance that merges stage-gate checkpoints with real-time DevOps telemetry is gaining traction, prompting vendors to embed pre-configured workflows that satisfy both product managers and compliance leads. Microsoft’s Engineering Lifecycle Management suite, for example, delivers role-based templates and AI-driven test prioritization, illustrating how functionality depth is reshaping preference across the application lifecycle management market
Surge in Cloud-Native ALM Deployments
Cloud-hosted delivery models reduce infrastructure overhead, support distributed workforces, and integrate effortlessly with container orchestration systems such as Kubernetes. IBM’s Engineering Integration Hub demonstrates how managed pipelines, policy-as-code, and elastic build agents improve cycle time while maintaining tight security controls. Financial-services and healthcare organizations—once cautious about off-premise data—are now embracing dedicated cloud regions that satisfy sovereignty requirements, further expanding demand within the application lifecycle management market.
Demand for End-to-End Traceability for Compliance
Safety-critical sectors must evidence every requirement, test, and change. Automotive engineers implementing ISO 26262, for instance, depend on automated traceability to shorten audits and improve product safety. Parasoft highlights that automated compliance reporting trims documentation effort by up to 40%. LeddarTech’s deployment of Codebeamer ALM delivered centralized documentation and real-time trace matrices to meet ISO 26262 milestones [1]PTC, “LeddarTech Case Study: Laser Focus on ISO 26262-Ready ALM,” ptc.com, showing how compliance integration differentiates solutions in the application lifecycle management market.
ALM–AI Convergence for GenAI Code Generation Governance
Generative-AI accelerates coding but multiplies risk. Ericsson indicates that AI-enabled network functions require lifecycle oversight equal to traditional code modules. ALM suites now monitor AI-generated snippets, scan dependencies, and enforce license policies, while predictive analytics enhance sprint forecasting. Platforms combining static analysis, secret-detection, and algorithm-audit logs secure a leading edge as enterprises harden pipelines across the application lifecycle management market.
Restraint Impact Analysis*
| Restraint | (~) % Impact on CAGR Forecast | Geographic Relevance | Impact Timeline |
|---|---|---|---|
| High implementation and integration costs | -0.7% | Global, with higher impact in emerging markets | Medium term (2-4 years) |
| Legacy toolchain complexity | -0.6% | North America and Europe | Medium term (2-4 years) |
| Scarcity of ALM orchestration talent | -0.5% | Global | Short term (≤ 2 years) |
| Tool-sprawl causing governance fragmentation | -0.4% | Global, with higher impact in large enterprises | Medium term (2-4 years) |
| Source: Mordor Intelligence | |||
High Implementation and Integration Costs
Customization, process redesign, and team training often overshadow license fees, raising total cost of ownership. HCLTech counters this challenge through subscription-based accelerators and 24 × 7 managed services that offload maintenance while preserving governance. Even so, budget constraints remain a hurdle for SMEs searching for full-suite capability within the application lifecycle management market.
Legacy Toolchain Complexity
Many enterprises maintain decades-old testing and requirements tools that lack modern APIs, complicating unified traceability. Siemens’ Polarion ALM addresses this gap by supplying ready-made connectors and high-volume analytics designed for hybrid landscapes polarion.com. Yet parallel operations raise duplication risk and slow data unification across the application lifecycle management market.
*Our forecasts treat driver/restraint impacts as directional, not additive. The impact forecasts reflect baseline growth, mix effects, and variable interactions.
Segment Analysis
By Component: Software Dominates While Services Accelerate
Software captured 63.40% of 2025 revenue, reflecting its role as the digital nexus for requirements management, continuous integration, automated testing, and release gating across the application lifecycle management market. Organizations buy comprehensive suites to reduce hand-offs and guarantee a single source of truth. Services, however, are growing at a 10.12% CAGR, moving beyond basic implementation toward holistic transformation programs. HCLTech’s ALM advisory offerings deliver migration, process optimization, and AI-driven insight layers, demonstrating how services now underpin sustained value creation. As adoption deepens, managed-services subscriptions keep pipelines operational, thereby magnifying the services slice of the application lifecycle management market size.
Enterprise buyers see risk mitigation in bundled expertise: consultants upgrade pipelines without disrupting production, integrate SBOM export, and automate test orchestration. This added assurance fuels spending on continuous advisory as companies modernize toolchains while maintaining audit readiness in the application lifecycle management market.


By Platform: Mobile-Based Solutions Gaining Ground
Web interfaces dominated with a 57.30% share in 2025, thanks to browser ubiquity and frictionless updates. Remote work, however, is propelling mobile-first usage at an 11.18% CAGR. Modern apps now facilitate secure code review, defect assignment, and deployment approvals via smartphones, shrinking incident-response windows. IBM, Siemens, and Microsoft are rolling out progressive-web applications that provide offline operation, instant push updates, and biometric access, making mobility a standard expectation. The rise of mobile governance increases demand for encrypted offline caches and zero-trust authentication, securing an important foothold within the application lifecycle management market.
Growing preference for on-the-go dashboards also influences purchasing decisions in heavily regulated fields; compliance leaders can review trace matrices from factory floors, shortening sign-off cycles and bolstering accountability across the application lifecycle management market size.
By Deployment Model: Cloud-Based Solutions Lead Innovation
Cloud deployments are surging at a 11.95% CAGR, enabling elastic builds, AI-powered analytics, and global collaboration without infrastructure maintenance. IBM’s Integration Hub illustrates how policy-as-code pipelines run natively in cloud regions with full encryption and automated failover. On-premise installations remain essential in defense, public safety, and life sciences firms that enforce air-gapped architectures. Hybrid approaches blend in-house artifact repositories with cloud-hosted orchestration, enabling gradual modernization while safeguarding sensitive IP. These flexible patterns increase platform optionality, driving broader adoption in the application lifecycle management market.
Vendors investing in consumption-based pricing and cost-observability dashboards further strengthen cloud appeal, tying expenditures directly to project activity and highlighting economic efficiency within the application lifecycle management market.
By Enterprise Size: SMEs Embrace ALM Through Low-Code
Large enterprises generated 56.20% of 2025 revenue, leveraging deep automation and governance to manage intricate multirelease portfolios. SMEs are expanding at an 10.74% CAGR, empowered by low-code platforms that embed ALM features, reducing scripting and configuration overhead. Microsoft Power Platform centralizes version control, environment promotion, and user role mapping inside a familiar interface. These capabilities offer smaller firms enterprise-level rigor without heavy staffing, thus widening the adoption funnel across the application lifecycle management market.
Community marketplaces supply pre-built templates for policy enforcement, change-control workflows, and SBOM export, lowering barriers and accelerating value realization for mid-market buyers entering the application lifecycle management market.
By Industry Vertical: Manufacturing Accelerates Digital Transformation
IT and Telecom secured 25.60% of 2025 spending due to continuous service innovation, 5G rollouts, and network function virtualization. Ericsson underscores that AI-enhanced network functions demand rigorous lifecycle oversight, integrating model management into standard pipelines. Manufacturing, however, is the fastest-expanding vertical at a 11.36% CAGR. PTC Codebeamer unites ALM and product-lifecycle threads, giving automotive and industrial firms synchronized visibility across software and hardware artifacts. This synergy mitigates costly recalls and supports the transition toward software-defined products, underscoring new momentum inside the application lifecycle management market.
Converging operational-technology firmware and enterprise software calls for a single digital thread that ensures change traceability, reinforcing platform selection criteria among factory operators modernizing under Industry 4.0 mandates.
Geography Analysis
North America led with 38.90% of 2025 revenue. Federal cybersecurity orders, coupled with robust venture funding, hasten adoption of AI-embedded, SBOM-ready suites within the application lifecycle management market . Technology majors headquartered in the region push ecosystem interoperability, while cloud-first cultures shorten release cycles and amplify emphasis on continuous compliance.
Asia–Pacific is the fastest-growing arena, forecast to deliver a 8.72% CAGR. Rapid digital transformation throughout China, India, and Southeast Asia combines with swelling public-cloud capacity to boost demand. Japanese manufacturers prioritize ISO-aligned traceability, whereas Indian IT-services firms orchestrate global delivery through multi-tenant platforms. Vendors offering robust localization, scalable pricing, and flexible deployment capture incremental share across the application lifecycle management market.
Europe, anchored by stringent data-privacy rules and sector-specific safety frameworks, leans heavily on solutions with automated evidence capture and standards libraries. Automotive OEMs in Germany integrate model-based systems engineering with Polarion ALM to handle software-defined vehicles . The region also pioneers sustainability metrics, prompting platforms to record energy consumption throughout build pipelines, an emerging differentiator in the application lifecycle management market.

Competitive Landscape
The application lifecycle management market blends consolidation and specialized innovation. Microsoft Azure DevOps, IBM Engineering Lifecycle Management, and Atlassian Jira Align dominate enterprise portfolios with broad functionality and extensive partner ecosystems. Siemens Polarion and PTC Codebeamer own regulated niches using pre-packaged compliance workflows. Perforce Helix ALM differentiates through deep version control, while Digital.ai aggregates analytics, security, and release management under a single value-stream umbrella.
Strategic acquisitions reshape offerings: PTC’s purchase of IncQuery Group strengthens model-based systems engineering for manufacturers. Microsoft improves Power Platform CI/CD governance, lowering the barrier for citizen developers. Vendors invest heavily in AI-driven insights, SBOM automation, and vertical accelerators to lock in customers and raise switching costs. White-space opportunities remain in unifying low-code governance with enterprise security posture, orchestrating AI-generated code, and integrating sustainability KPIs. Providers combining PLM, ALM, and operational analytics are poised to capture incremental share as buyers seek seamless digital threads across product and software development in the application lifecycle management market.
Application Lifecycle Management (ALM) Industry Leaders
Microsoft Corporation
IBM Corporation
Atlassian Corporation Plc
Broadcom Inc.
Siemens AG
- *Disclaimer: Major Players sorted in no particular order

Recent Industry Developments
- May 2025: HCLTech showcased xLMate at Siemens Realize LIVE Americas, emphasizing cost-saving collaboration.
- April 2025: PTC acquired IncQuery Group to deepen ALM and systems-engineering expertise.
- January 2025: Foundant released AI-enabled updates to its Grant and Scholarship Lifecycle Manager.
- January 2025: Microsoft enhanced Power Platform ALM capabilities, improving governance, CI/CD, and Dataverse integration.


Research Methodology Framework and Report Scope
Market Definitions and Key Coverage
Our study defines the application lifecycle management market as the total annual revenue generated by software suites and tightly linked services that govern planning, coding, version control, testing, release, and in-service maintenance of enterprise applications, whether delivered on-premise or as cloud subscriptions. The focus remains on integrated, end-to-end platforms that enable agile and DevOps workflows, DevSecOps compliance, and traceability across teams. This is where Mordor Intelligence offers clear scope boundaries for buyers.
Scope exclusions include stand-alone bug trackers, generic project boards, and source-control tools sold without lifecycle modules, which are not counted, nor are pure-play consulting engagements detached from an ALM platform.
Segmentation Overview
- By Component
- Software
- Services
- By Platform
- Web-Based
- Mobile-Based
- By Deployment Model
- On-Premise
- Cloud-Based
- Hybrid
- By Enterprise Size
- Small and Medium Enterprises (SMEs)
- Large Enterprises
- By Industry Vertical
- IT and Telecom
- BFSI
- Healthcare
- Retail and E-commerce
- Manufacturing
- Government
- Media and Entertainment
- Other Verticals
- By Geography
- North America
- United States
- Canada
- Mexico
- South America
- Brazil
- Argentina
- Rest of South America
- Europe
- Germany
- United Kingdom
- France
- Italy
- Spain
- Russia
- Rest of Europe
- Asia-Pacific
- China
- Japan
- India
- South Korea
- Australia and New Zealand
- Rest of Asia-Pacific
- Middle East and Africa
- Middle East
- Saudi Arabia
- UAE
- Turkey
- Rest of Middle East
- Africa
- South Africa
- Nigeria
- Kenya
- Rest of Africa
- Middle East
- North America
Detailed Research Methodology and Data Validation
Primary Research
Interviews and structured surveys with platform architects, enterprise tool buyers, managed-service providers, and regional distributors across North America, Europe, and Asia-Pacific let us stress-test price corridors, cloud conversion rates, and vertical penetration patterns. Feedback was looped into the model until directional consensus emerged.
Desk Research
Our analysts began with widely trusted public datasets such as the US Bureau of Labor Statistics developer head-count series, OECD ICT investment tables, Cloud Native Computing Foundation DevOps adoption surveys, NIST Secure-SDLC guidelines, and Gartner open source vulnerability alerts, which together sketch the addressable demand pool and regulatory push. Company 10-Ks, major vendor price lists, and Form F-20 filings helped us cross-check average selling prices and attach service percentages.
Paid repositories, such as D&B Hoovers for vendor financial splits and Dow Jones Factiva for contract wins, supplied additional signal strength before numbers fed the model. The sources named are illustrative; many more journals, trade portals, customs records, and patent databases were consulted to validate finer assumptions.
Market-Sizing & Forecasting
A top-down build, anchored on global enterprise software outlays and refined through ALM penetration by workforce size, set the initial 2025 baseline. Results were then reconciled with selective bottom-up checks, including sampled vendor revenues, channel shipments, and average subscription fees, to adjust for under-reported mid-tier players.
Key variables include growth in professional developer population, share of agile/DevOps projects, public-cloud spending mix, average per-seat pricing, regulatory events requiring traceability (e.g. SBOM mandates), and macro software investment cycles.
Forecasts through 2030 rely on multivariate regression and scenario analysis, with elasticity factors derived from primary-research sentiment.
Missing datapoints within supplier roll-ups were bridged using regional ASP proxies vetted against distributor feedback.
Data Validation & Update Cycle
Every draft passes anomaly scans, variance thresholds, and peer review before sign-off. We refresh models annually; material events, such as major mergers, pricing resets, or regulatory shifts, trigger interim updates, and a last-mile sense check is completed just before delivery, ensuring clients receive the latest validated view.
Why Mordor's Application Lifecycle Management Baseline Commands Reliability
Estimates across publishers often diverge because each firm picks distinct functional scopes, pricing ladders, and refresh cadences, and may not fully vet bottom-up roll-ups against macro signals.
Key gap drivers include some studies that bundle generic issue-tracking tools, others that apply static currency conversions, a few that use unvalidated ASP escalators, and several that revisit models only every three years, whereas Mordor analysts align scope strictly to integrated ALM suites, apply quarterly FX averages, and revisit variables annually.
Benchmark comparison
| Market Size | Anonymized source | Primary gap driver |
|---|---|---|
| USD 4.44 B (2025) | Mordor Intelligence | |
| USD 4.35 B (2024) | Global Consultancy A | Includes stand-alone project boards; single-year currency rate |
| USD 4.26 B (2024) | Industry Publisher B | Applies conservative cloud uptake and five-year static pricing |
| USD 4.42 B (2024) | Tech Analytics C | Forecasts updated biennially; excludes maintenance services |
In summary, the disciplined scope selection, annual refresh cycle, and dual-lens validation mean Mordor's figures give decision-makers a balanced, transparent baseline that can be traced back to clear variables and repeatable steps.


Key Questions Answered in the Report
What is the current size of the application lifecycle management market?
The application lifecycle management market stands at USD 4.77 billion in 2026 and is expected to reach USD 6.81 billion by 2031.
Which geography leads adoption today?
North America leads with 38.90% of 2025 revenue due to early cloud uptake and stringent supply-chain security mandates.
Why is cloud deployment growing fastest?
Cloud models expand at a 11.95% CAGR because they provide elastic scale, AI-assisted analytics, and lower infrastructure overhead across the application lifecycle management market.
How do SBOM regulations influence platform choice?
Executive directives now require component transparency, so buyers prefer suites that automate SBOM generation and vulnerability tracking at every build.
What role does AI play in modern ALM solutions?
AI modules streamline code review, defect prediction, and sprint planning, boosting velocity while maintaining security and regulatory compliance within the application lifecycle management market.
Page last updated on:


