Independent Software Vendors (ISV) Market Size and Share
Market Overview
| Study Period | 2020 - 2031 |
|---|---|
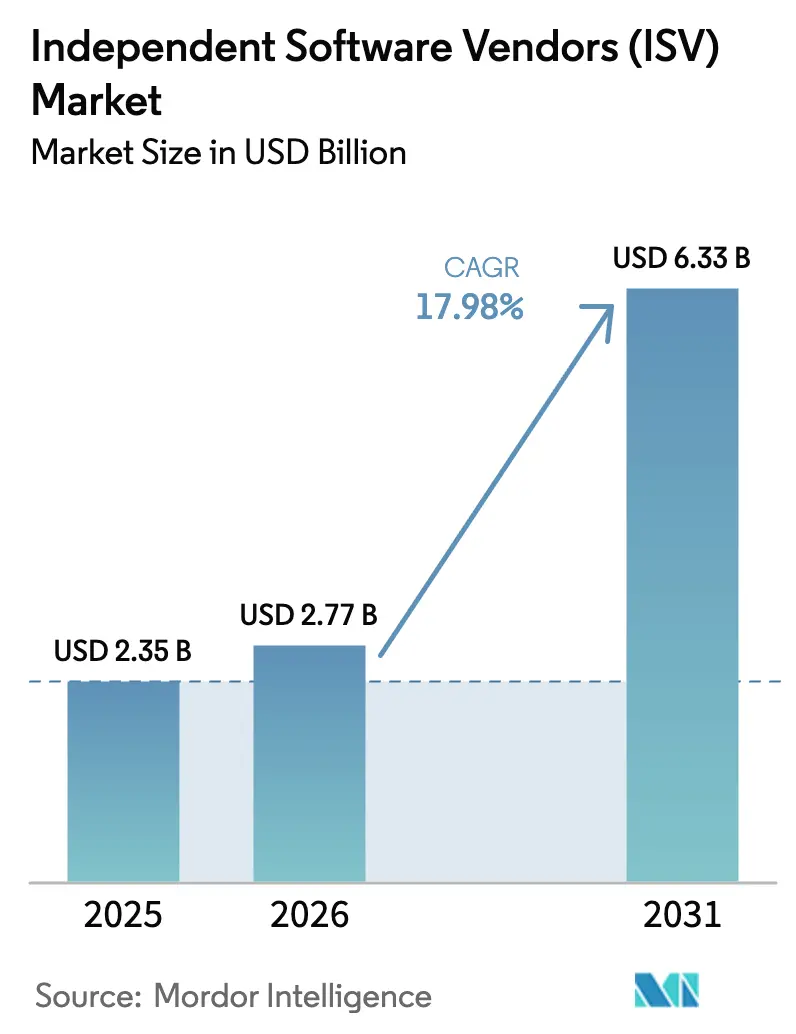
| Market Size (2026) | USD 2.77 Billion |
| Market Size (2031) | USD 6.33 Billion |
| Growth Rate (2026 - 2031) | 17.98% CAGR |
| Fastest Growing Market | Asia Pacific |
| Largest Market | North America |
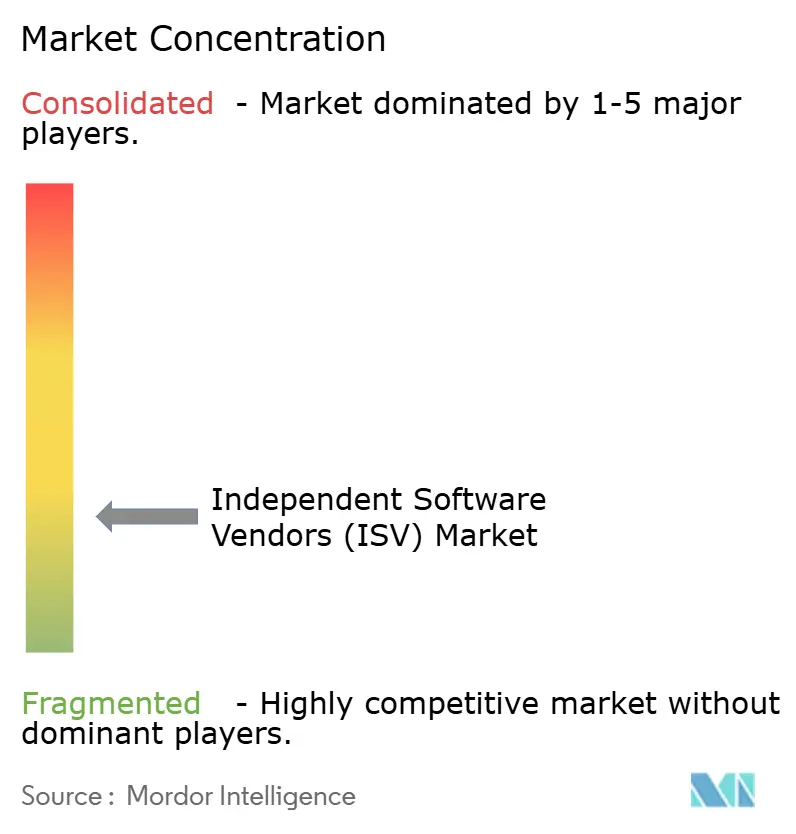
| Market Concentration | Low |
Major Players *Disclaimer: Major Players sorted in no particular order Image © Mordor Intelligence. Reuse requires attribution under CC BY 4.0. | |
Independent Software Vendors (ISV) Market Analysis by Mordor Intelligence
Independent Software Vendors market size in 2026 is estimated at USD 2.77 billion, growing from 2025 value of USD 2.35 billion with 2031 projections showing USD 6.33 billion, growing at 17.98% CAGR over 2026-2031. Enterprises are accelerating modernization of legacy systems to capitalize on artificial intelligence and cloud-native architectures that shorten development timelines and lower total ownership costs. Momentum is reinforced by hyperscaler marketplace programs that trim customer-acquisition outlays for ISVs, while generative-AI toolkits compress prototyping cycles and automate sizeable portions of code creation. Cloud deployment remains the default implementation model because subscription pricing realigns software budgets with operating expenses, and the reduction in on-premise infrastructure enables faster adoption in regulated industries. At the same time, vertical SaaS providers are capturing premium pricing in healthcare, financial services and field-service management, signalling a sustained shift away from horizontal feature sets toward deeply specialized domain functionality. Investor interest follows this trajectory, with strategic buyers and private equity expanding acquisition pipelines to consolidate fragmented point solutions before valuations climb further.
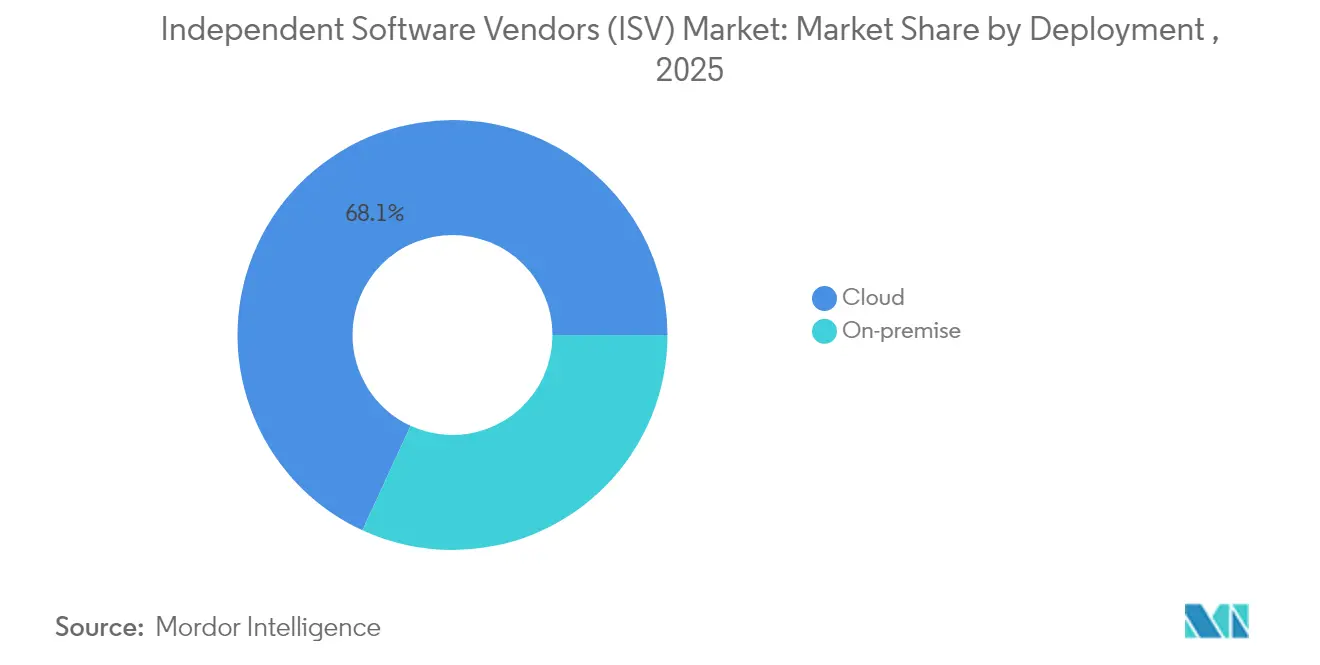
- By deployment, cloud mode held 68.12% of Independent Software Vendors market share in 2025, while on-premise adoption continued to contract at a single-digit rate.
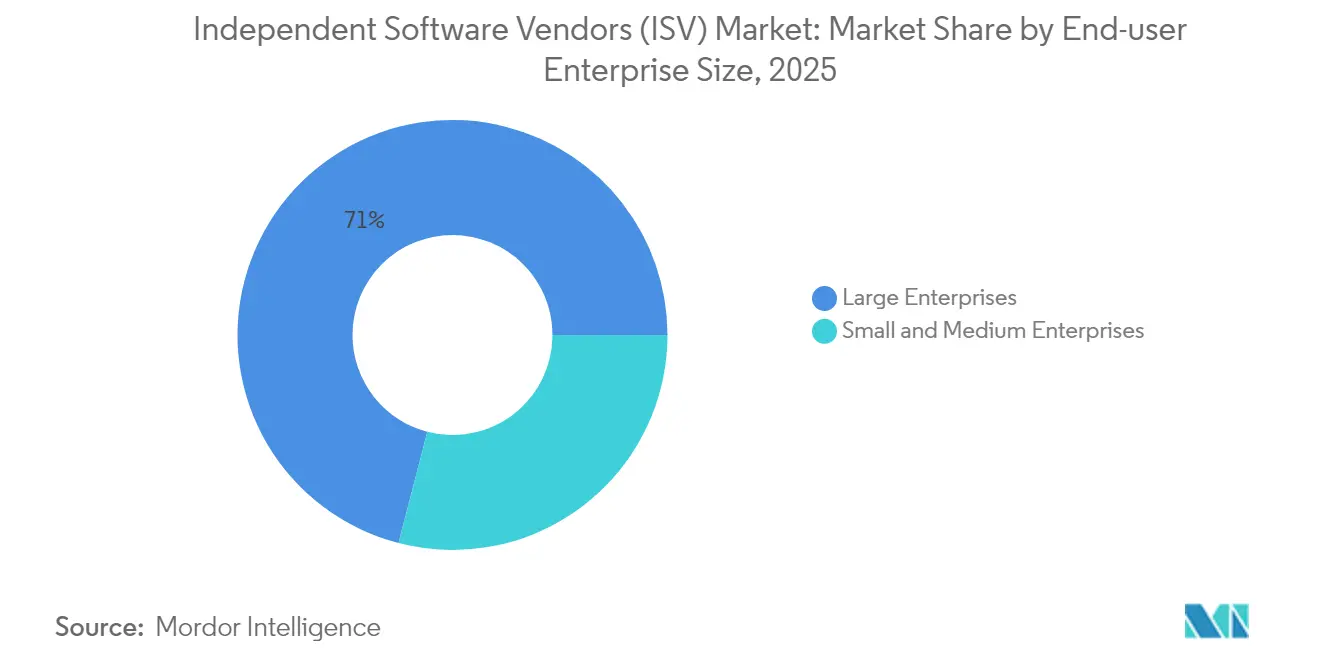
- By end-user enterprise size, large organizations accounted for 70.96% of the Independent Software Vendors market in 2025; the SME segment is projected to grow at a 15.51% CAGR to 2031.
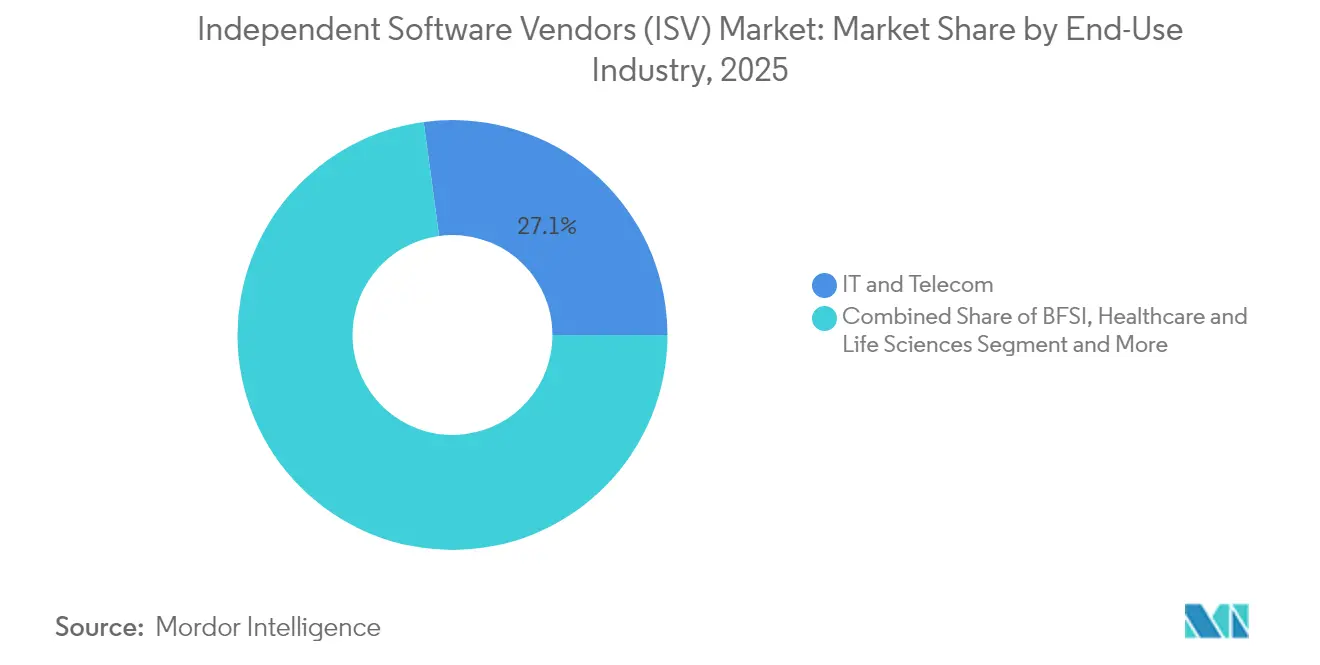
- By end-use industry, IT and telecommunications led with 27.14% revenue share in 2025; healthcare is advancing at a 18.74% CAGR through 2031.
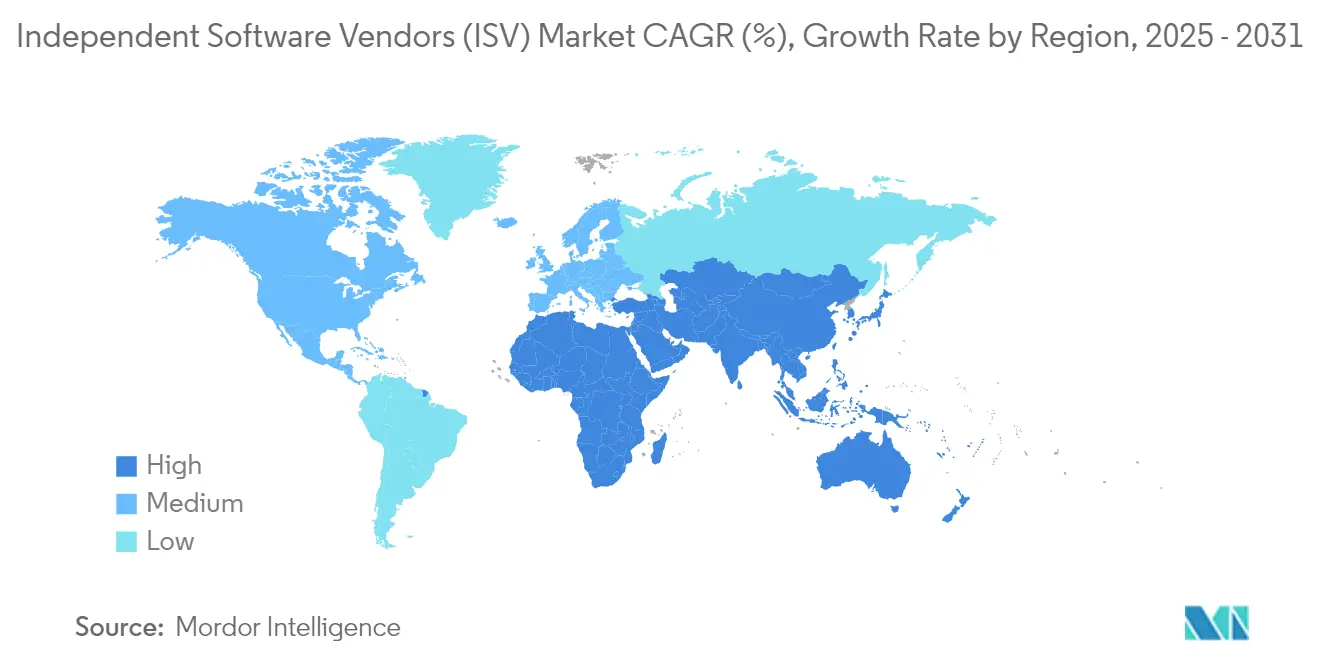
- By geography, North America commanded 42.21% share of the Independent Software Vendors market size in 2025, while Asia-Pacific is expanding at 15.62% CAGR through 2031.
Note: Market size and forecast figures in this report are generated using Mordor Intelligence’s proprietary estimation framework, updated with the latest available data and insights as of 2026.
Global Independent Software Vendors (ISV) Market Trends and Insights
Drivers Impact Analysis*
| Driver | (~) % Impact on CAGR Forecast | Geographic Relevance | Impact Timeline |
|---|---|---|---|
| Cloud/SaaS as Default Enterprise Architecture | +4.2% | Global, led by North America and Europe | Medium term (2-4 years) |
| Industry-specific "Vertical SaaS" demand surge | +3.8% | Asia-Pacific core, spill-over to North America | Long term (≥ 4 years) |
| Hyperscaler marketplace co-sell and credits programs | +3.1% | Global, concentrated in AWS/Azure/GCP regions | Short term (≤ 2 years) |
| Rapid Gen-AI toolkits lowering product-launch cost | +2.9% | North America and EU, expanding to Asia-Pacific | Medium term (2-4 years) |
| Low-code / no-code platforms expanding ISV reach | +2.4% | Global, with SME concentration in emerging markets | Long term (≥ 4 years) |
| Emerging-market digital-public-goods (DPG) APIs | +1.8% | Asia-Pacific, MEA, Latin America | Long term (≥ 4 years) |
| Cloud/SaaS as Default Enterprise Architecture | +4.2% | Global, led by North America and Europe | Medium term (2-4 years) |
| Source: Mordor Intelligence | |||
Cloud/SaaS as Default Enterprise Architecture
Software-as-a-Service formats have become the standard architecture for new enterprise applications, materially changing contract structures and revenue timing for ISVs. Microsoft’s cloud revenue grew to USD 137.4 billion in fiscal 2024, a 23% year-over-year increase, illustrating the scale advantages of cloud-first distribution.[1]Microsoft Corporation, “Annual Report 2024,” microsoft.com Subscription pricing improves customer predictability, and automated updates reduce administrative overhead. Public-sector procurement policies reinforce the shift, with the United Kingdom’s G-Cloud programme recording average savings of 50% against traditional sourcing mechanisms. Together these factors are raising adoption velocity and underpinning growth in the Independent Software Vendors market.
Industry-specific “Vertical SaaS” Demand Surge
Enterprises are choosing applications engineered for their regulatory frameworks and workflow nuances. eClinicalWorks surpassed USD 1.1 billion revenue in 2024 on the strength of healthcare-focused EHR suites, while ServiceTitan reached USD 840 million annual recurring revenue in field-service management. Deep domain knowledge embeds natural switching costs, letting providers sustain higher average selling prices and stronger renewal metrics. Asia-Pacific is emerging as a pivotal theatre because regulatory and language complexity increases the value of tailored solutions, making vertical SaaS a durable growth vector for the Independent Software Vendors market.
Hyperscaler Marketplace Co-sell and Credits Programs
AWS, Microsoft Azure and Google Cloud now function as multi-billion-dollar distribution rails for ISVs. Marketplace listings shorten proof-of-concept cycles because customers can offset spend against committed cloud budgets. Salesforce drew on this channel to support its USD 34.9 billion fiscal-2024 revenue, while Microsoft reported commercial bookings growth of 67% in Q2 FY2025, partially driven by Azure commitments that bundle partner solutions.[2]Salesforce Inc., “Form 10-K FY 2024,” salesforce.comThese programmes inject predictable pipeline and are expected to stay central to the Independent Software Vendors market until at least mid-decade.
Rapid Gen-AI Toolkits Lowering Product-Launch Cost
Pre-trained large-language models, code-assist engines and vector search APIs have collapsed development timelines. Intuit’s GenOS framework lets engineering teams spin up new ML-backed features in weeks, contributing to the company’s USD 16.3 billion fiscal-2024 revenue.[3]Intuit Inc., “Intuit Announces Generative AI Operating System Enhancements,” intuit.comDemocratised access to AI components enables start-ups to prototype complex capabilities without hiring scarce data-science talent, broadening competitive intensity and accelerating innovation across the Independent Software Vendors market.
Restraints Impact Analysis*
| Restraint | (~) % Impact on CAGR Forecast | Geographic Relevance | Impact Timeline |
|---|---|---|---|
| Legacy-system integration debt | -2.8% | Global, acute in North America and Europe | Medium term (2-4 years) |
| Escalating cloud egress and marketplace fees | -1.9% | Global, concentrated in multi-cloud deployments | Short term (≤ 2 years) |
| Heightened industry-specific compliance hurdles | -1.4% | EU (GDPR), North America (SOX, HIPAA) | Long term (≥ 4 years) |
| IP differentiation squeeze in crowded SaaS niches | -1.1% | Global, particularly in horizontal SaaS | Medium term (2-4 years) |
| Source: Mordor Intelligence | |||
Legacy-system Integration Debt
Enterprises shoulder average maintenance expenses of USD 40,000 per legacy instance and lose 17 hours weekly in IT productivity, according to ServiceNow’s 2024 workflow modernisation study. Manufacturing alone sits on USD 2.65 trillion of depreciating technology that still houses mission-critical processes, complicating decommissioning. Integration failures often stem from incompatible data formats, extending project timelines and swelling total implementation cost for ISVs, thereby tempering growth in the Independent Software Vendors market.
Escalating Cloud Egress and Marketplace Fees
Data-transfer levies can absorb up to 6% of a customer’s cloud-storage bill, raising anxieties for AI-centric workloads that shuttle large datasets across regions. Oracle currently waives intra-region egress, while AWS and Microsoft include only 100 GB monthly, creating architecture-driven cost disparities. Transaction fees inside hyperscaler marketplaces further compress margins. Higher variable costs pressure pricing strategy and underline the need for ISVs to refine data-locality tactics and negotiate marketplace-fee concessions.
*Our forecasts treat driver/restraint impacts as directional, not additive. The impact forecasts reflect baseline growth, mix effects, and variable interactions.
Segment Analysis
By Deployment: Cloud Dominance Accelerates Enterprise Transformation
Cloud implementations accounted for 68.12% of Independent Software Vendors market share in 2025 and are projected to expand at 14.25% CAGR to 2031. For customers, subscription pricing converts capital outlays to predictable operating spend, while automatic updates harden security posture. Hybrid models persist where data-sovereignty mandates restrict full cloud adoption, but the direction of travel remains unidirectional toward SaaS. SAP reflects this transition: its cloud revenue climbed to EUR 17.14 billion in 2024, a 26% increase, with cloud-ERP growth at 33%.
Cost savings only partially explain uptake; feature velocity is more decisive. Continuous integration pipelines let ISVs release enhancements weekly, giving clients access to emerging AI, analytics and security features without disruptive version upgrades. This cadence improves retention because switching to another platform means forfeiting a rapid innovation stream. As more regulated industries certify SaaS environments, resistance to cloud wanes, reinforcing expansion of the Independent Software Vendors market.


By End-user Enterprise Size: SMEs Drive Adoption Through Accessible Technology
Large enterprises represented 70.96% of revenue in 2025, reflecting their capacity to navigate complex integrations and rigorous compliance audits. Nevertheless, the small- and mid-size cohort delivers the sharpest trajectory, recording a 15.51% CAGR through 2031. Cloud deployment eliminates the need for on-premise hardware, and embedded best-practice templates reduce configuration cycles from months to weeks. Research from Salesforce found that 91% of SMBs using AI reported revenue gains, evidence that smaller firms can translate software investments directly into top-line growth.
Low-code platforms further flatten entry barriers. Vendors now bundle drag-and-drop interfaces that enable “citizen developers” within finance, HR and operations to assemble bespoke workflows without formal coding skills. This internal capability shrinks dependence on external consultants and accelerates time-to-value, an effect that compounds adoption rates in resource-constrained businesses. Together these factors position SME demand as a durable expansion pillar for the Independent Software Vendors market.
By End-Use Industry: Healthcare Leads Vertical Transformation
IT and telecommunications captured 27.14% of spending in 2025, driven by continuous requirements for network orchestration, OSS/BSS modernisation and digital-service delivery. Healthcare, however, is pacing the field with a 18.74% CAGR to 2031. Electronic health record upgrades intersect with telemedicine growth and value-based care reimbursement models, creating a multi-faceted demand profile. Compliance obligations such as HIPAA reinforce vendor lock-in because transfers involve significant re-certification work.
Parallel expansion is visible in BFSI, manufacturing and public sector. Manufacturers accelerate Industry 4.0 roll-outs, embedding IoT sensors for predictive maintenance and integrating real-time supply-chain planning engines. Public agencies increasingly adopt SaaS case-management and benefits-administration suites, buoyed by policy mandates that promote digital citizen services. Each vertical exhibits distinct pain points, yet all feed into the broader growth engine driving the Independent Software Vendors market.
Geography Analysis
North America retained 42.21% of global revenue in 2025, anchored by mature enterprise cloud budgets and proximity to major hyperscaler headquarters. Federal cloud outlays climbed by USD 6.2 billion in fiscal 2023 to reach USD 20 billion, a clear signal that public-sector demand remains on the upswing. Ongoing investments in AI-ready infrastructure and cybersecurity frameworks sustain a fertile environment for ISV uptake. Competitive dynamics also spur refresh cycles as companies reposition around generative AI differentiation, expanding the installed base for developer tooling and middleware.
Asia-Pacific is the fastest-growing theatre, registering a 15.62% CAGR to 2031. India’s SaaS sector is expanding 30% annually and could command 8% of worldwide share by 2028, equivalent to USD 37 billion revenue. Success of digital-public infrastructure, notably UPI’s 83 billion annual payment transactions, illustrates how government-backed API ecosystems accelerate private-sector software adoption. Markets such as Indonesia and Vietnam mirror this pattern by investing in national digital-ID and payments rails, lowering onboarding friction for vertical SaaS vendors.
Europe follows with steady replacement of on-premise ERP and CRM estates in favour of SaaS deployments. GDPR compliance costs have prompted companies to adopt solutions that embed privacy-by-design features, indirectly benefiting the Independent Software Vendors market. Latin America and the Middle East and Africa show nascent but accelerating uptake as broadband penetration expands and governments publish cloud-first procurement policies. Currency volatility and skills shortages remain hurdles, yet rising smartphone adoption and fintech innovation create ample whitespace for ISVs offering modular, mobile-first solutions.

Competitive Landscape
The Independent Software Vendors market remains moderately fragmented. Microsoft sits atop with USD 245 billion 2024 revenue, of which USD 137 billion derived from cloud subscriptions, underscoring the advantages of scaled infrastructure and integrated development tooling. Oracle’s acquisition of APEX Technologies in March 2025 strengthens its multi-cloud analytics stack, while Salesforce’s purchase of Informatica for USD 8 billion extends its Customer 360 data fabric. SAP’s USD 1.5 billion deal for WalkMe brings digital-adoption capabilities into its transformation suite, illustrating a trend where platform owners bolt on niche functionality to raise stickiness.
Vertical specialists continue to flourish by solving compliance-heavy workflows. Intuit leverages its proprietary generative-AI operating system to personalise financial guidance across a 100-million-user base. Veeva Systems maintains share in life-sciences CRM by tailoring data models to FDA and EMA requirements. In field-service management, ServiceTitan outpaces generic FSM tools by hard-coding contractor billing and dispatch logic. These examples confirm that deep domain knowledge and regulatory certifications act as high-entry barriers and confer pricing power.
Competition intensifies around AI value-add. Adobe embeds Firefly image-generation in Creative Cloud, Atlassian integrates natural-language ticket summarisation in Jira, and Snowflake partners with NVIDIA to host end-to-end Gen-AI pipelines inside its data cloud. Market positioning increasingly hinges on how effectively vendors operationalise AI without inflating cost of goods sold. Margins are under pressure from egress-fee escalation and marketplace cuts, prompting strategic reviews of architecture and channel mix. Consolidation is expected to persist as investors seek economies of scale and cross-sell synergies in the Independent Software Vendors market.
Independent Software Vendors (ISV) Industry Leaders
Intuit
SAP SE
Salesforce Inc.
Oracle
Microsoft
- *Disclaimer: Major Players sorted in no particular order

Recent Industry Developments
- January 2025: Salesforce completed its USD 8 billion acquisition of Informatica to enhance data capabilities and accelerate AI adoption across its Customer 360 platform.
- January 2025: SignUp Software, backed by Insight Partners, acquired SKsoft to create a four-vendor suite on Microsoft Dynamics 365 covering finance, treasury, commerce and production planning.
- April 2025: SAP announced the USD 1.5 billion purchase of WalkMe to embed AI-driven guidance inside its transformation portfolio.
- March 2025: Oracle closed the acquisition of APEX Technologies, adding multi-cloud data-integration and real-time analytics capabilities.


Research Methodology Framework and Report Scope
Market Definitions and Key Coverage
Our study defines the independent software vendor market as revenue that accrues to organizations whose principal business is the design, licensing, and maintenance of packaged or subscription-based software that runs on third-party infrastructure or devices. The model follows the value captured by vendors through upfront licenses, recurring SaaS fees, marketplace listings, and embedded-software royalties, and it groups these revenues by deployment model, enterprise size, end-use industry, and geography.
Scope exclusion: custom one-off development projects, hardware bundles, and pure reselling margins are outside the frame.
Segmentation Overview
- By Deployment
- Cloud
- On-premise
- By End-user Enterprise Size
- Large Enterprises
- Small and Medium Enterprises
- By End-Use Industry
- IT and Telecommunication
- BFSI
- Healthcare and Life Sciences
- Retail and E-Commerce
- Manufacturing
- Government and Public Sector
- Education
- By Geography
- North America
- United States
- Canada
- Mexico
- South America
- Brazil
- Rest of South America
- Europe
- Germany
- United Kingdom
- France
- Russia
- Rest of Europe
- Asia-Pacific
- China
- Japan
- India
- South Korea
- Australia and New Zealand
- Rest of Asia-Pacific
- Middle East and Africa
- Middle East
- United Arab Emirates
- Saudi Arabia
- Turkey
- Rest of Middle East
- Africa
- Middle East
- South Africa
- Nigeria
- Rest of Africa
- Middle East
- North America
Detailed Research Methodology and Data Validation
Primary Research
Mordor analysts interviewed ISV founders, hyperscaler partner-program managers, procurement leads at mid-market firms in North America, Europe, and Asia Pacific, and regional investor groups. These conversations validated assumed contract values, renewal frequencies, and expansion rates that secondary sources only hint at.
Desk Research
We began with public datasets such as the US Census ICT survey, Eurostat cloud adoption barometers, and UN Comtrade trade codes that flag packaged software exports, which together sketch demand pools and export velocity. Additional insights flowed from trade groups such as BSA-The Software Alliance, IEEE Xplore journals on vertical SaaS, and patent analytics from Questel that signal innovation intensity. Company 10-Ks, cloud marketplace fee disclosures, and D&B Hoovers financials supplied granular revenue splits needed to benchmark leading ISVs. This list illustrates our sources; many further repositories were mined to corroborate figures and definitions.
A second sweep tapped Dow Jones Factiva for deal activity, IMTMA for developer ecosystem size in India, and government open-data portals that report enterprise software price indices, allowing price-volume separation before forecasting.
Market-Sizing & Forecasting
A top-down construct starts with enterprise software spend by region and filters it through packaged-software penetration rates, average license conversion to subscription ratios, and ISV share of channel sales. Selective bottom-up checks (sampled vendor revenues and marketplace commission roll-ups) refine the totals. Variables including cloud infrastructure outlay, SaaS seat growth, VC funding flows into vertical SaaS, regulatory data-residency triggers, and average contract value shifts feed a multivariate regression that projects the market to 2030. Scenario analysis adjusts for currency swings and unexpected platform shifts, while gaps in vendor disclosures are bridged using cluster averages from similar peer sets.
Data Validation & Update Cycle
Outputs pass anomaly scans, senior-analyst peer review, and variance checks against independent indicators before sign-off. Our models refresh annually, with interim revisions when material events, such as large acquisitions and pricing resets, occur. Right before publication, an analyst reruns key formulas so clients always receive the latest view.
Why Mordor's Independent Software Vendors Baseline Stays Dependable
Published estimates often differ because each firm carves the universe through its own lens and time stamp. Licensing inclusions, currency bases, and refresh cadence can swing totals noticeably, and these factors are rarely disclosed clearly.
Key gap drivers include whether services and reseller mark-ups ride inside the number, how aggressively freemium conversions are assumed, and the cadence at which cloud price cuts are baked into future revenue. Our study locks definitions early, applies uniform FX rates, and revisits underlying variables every twelve months, which keeps the baseline steady yet timely.
Benchmark comparison
| Market Size | Anonymized source | Primary gap driver |
|---|---|---|
| USD 2.35 B (2025) | Mordor Intelligence | |
| USD 2.38 B (2025) | Global Consultancy A | Includes reseller services and advisory fees alongside pure software revenue |
| USD 1.18 B (2025) | Industry Forecasting Firm B | Excludes cloud-native subscription models and marketplace sales |
| USD 0.50 B (2024) | Research Group C | Sample limited to SMEs; uses static average selling price across regions |
The comparison shows how scope breadth and pricing assumptions alone can triple or halve published values. By anchoring our figures to transparent variable sets and a disciplined update rhythm, Mordor offers decision-makers a balanced and reproducible starting point.


Key Questions Answered in the Report
What is the current Independent Software Vendors market size?
The Independent Software Vendors market size stands at USD 2.77 billion in 2026 and is projected to surpass USD 6.33 billion by 2031.
Which deployment model is leading the market?
Cloud deployment leads with 68.12% share in 2025 and is expanding at a 14.25% CAGR through 2031.
Which region shows the fastest growth?
Asia-Pacific posts the highest growth at 15.62% CAGR, buoyed by India’s rapidly scaling SaaS ecosystem and supportive digital-public infrastructure.
What industry vertical is growing the quickest?
Healthcare is the fastest-expanding vertical, advancing at a 18.74% CAGR due to electronic health record upgrades and telemedicine adoption.
How are hyperscaler marketplaces influencing ISV sales?
Co-sell programs and customer credit incentives inside AWS, Azure and GCP marketplaces reduce acquisition costs and accelerate deal cycles, exerting a +3.1% impact on overall CAGR.
Page last updated on:


