
Technology, Media and Telecom
5th MayPricing Strategy for Semiconductor Components
3 Min Read
Industrial Discrete Semiconductor Market is Segmented by Product Type (Diode, Small Signal Transistors, Power Transistor, and More), Material (Silicon, Silicon Carbide, and More), Power Rating (Low, Medium, and More), Packaging (Through-Hole, Surface-Mount, and More), End-Use Industry (Factory Automation and Motion Control, and More), and Geography (North America, South America, Europe, Asia-Pacific, and Middle East and Africa).
Market Overview
| Study Period | 2020 - 2031 |
|---|---|
| Market Size (2026) | USD 8.64 Billion |
| Market Size (2031) | USD 11.8 Billion |
| Growth Rate (2026 - 2031) | 6.43 % CAGR |
| Fastest Growing Market | Asia Pacific |
| Largest Market | Asia Pacific |
| Market Concentration | Medium |
Major Players *Disclaimer: Major Players sorted in no particular order. Image © Mordor Intelligence. Reuse requires attribution under CC BY 4.0. |
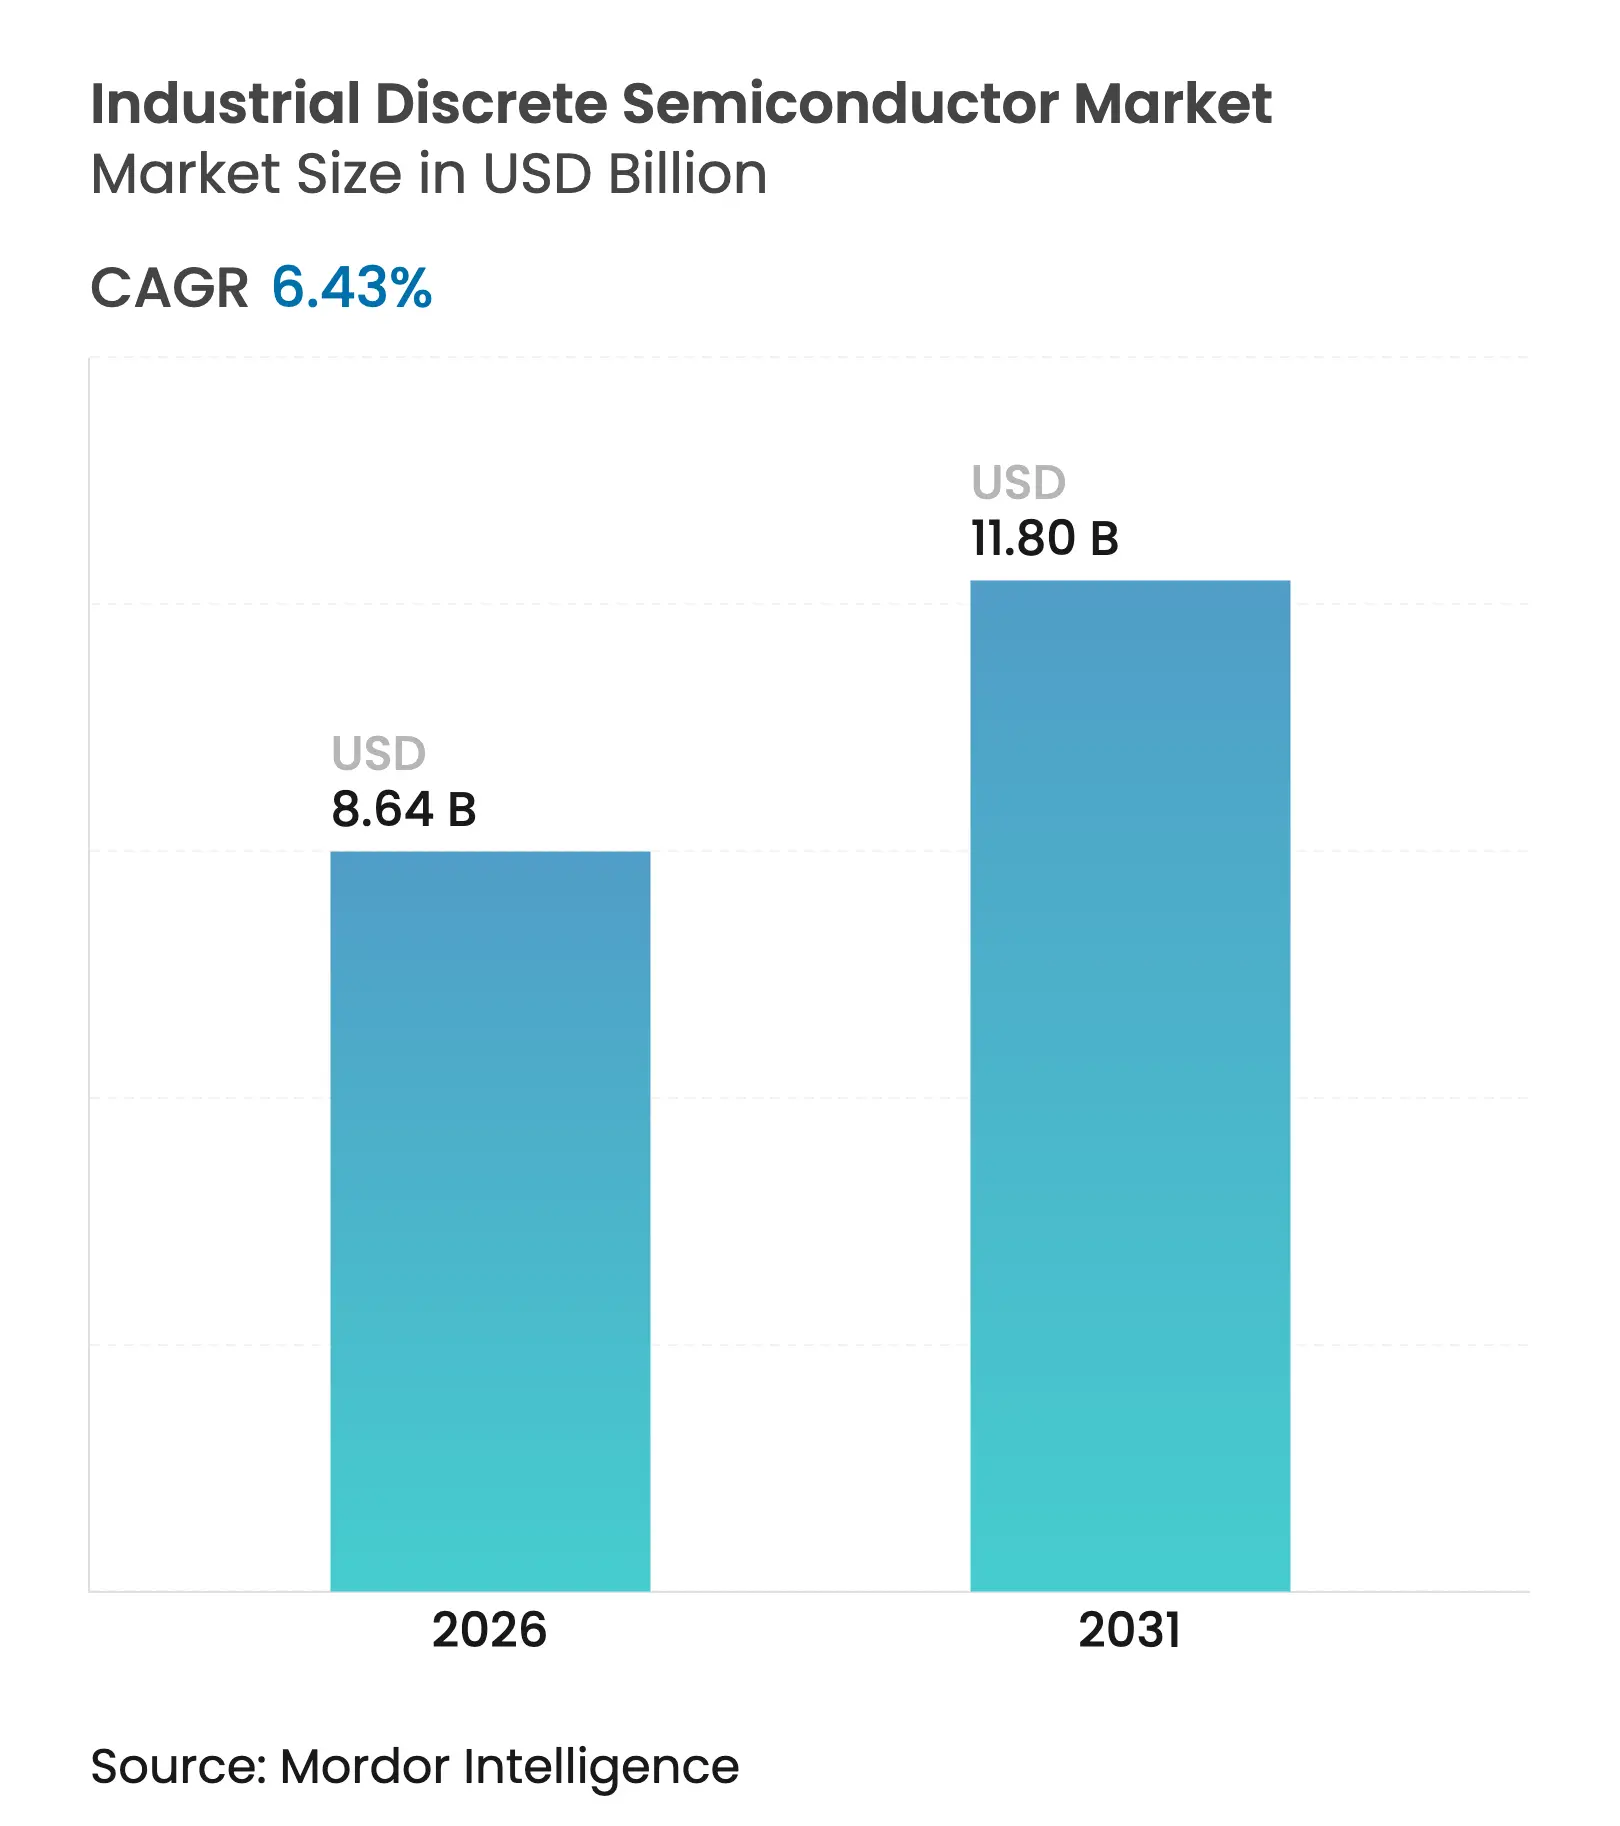
Industrial discrete semiconductor market size in 2026 is estimated at USD 8.64 billion, growing from 2025 value of USD 8.12 billion with 2031 projections showing USD 11.8 billion, growing at 6.43% CAGR over 2026-2031. Rising electrification of factory equipment, expanding deployment of automated production lines, and the rapid build-out of renewable-energy infrastructure have kept demand for high-performance power transistors, ultrafast diodes, and rugged small-signal devices on a steady uptrend. Asia-Pacific remained the revenue anchor, thanks to dense manufacturing hubs in China, Japan, and South Korea and a steady flow of state incentives that encourage local sourcing of power-device content. Silicon still dominated overall volumes, yet silicon-carbide (SiC) and gallium-nitride (GaN) devices captured most of the incremental value as equipment builders pursued tighter thermal margins and higher switching speeds. At the same time, packaging innovation shifted toward integrated power modules that simplify thermal design while lifting power density targets.
Key Report Takeaways
Note: Market size and forecast figures in this report are generated using Mordor Intelligence's proprietary estimation framework, updated with the latest available data and insights as of 2026.
Drivers Impact Analysis
| Driver | (~) % Impact on CAGR Forecast | Geographic Relevance | Impact Timeline | |||
|---|---|---|---|---|---|---|
Proliferation of Industrial Automation and Robotics
Driving High-Current MOSFETs and IGBTs
Proliferation of Industrial Automation and Robotics
Driving High-Current MOSFETs and IGBTs
| 1.8% | Global, with concentration in China, Germany, Japan, and South Korea | Medium term (2-4 years) |
(~) % Impact on CAGR Forecast
:
1.8%
|
Geographic Relevance
:
Global, with concentration in China, Germany, Japan, and
South Korea
|
Impact Timeline
:
Medium term (2-4 years)
|
Rapid Electrification of Heavy Industrial Equipment
Boosting SiC Power Transistors
Rapid Electrification of Heavy Industrial Equipment
Boosting SiC Power Transistors
| 1.5% | North America, Europe, China | Medium term (2-4 years) | |||
Government-funded Net-Zero Factories Requiring Ultrafast
Diodes
Government-funded Net-Zero Factories Requiring Ultrafast
Diodes
| 0.9% | Europe, North America, Japan | Long term (≥ 4 years) | |||
Industry 4.0 Edge-IIoT Sensors Pushing Demand for High-Frequency
Small-Signal Transistors
Industry 4.0 Edge-IIoT Sensors Pushing Demand for High-Frequency
Small-Signal Transistors
| 1.2% | Global, with early adoption in Germany, the US, and Japan | Medium term (2-4 years) | |||
Expansion of Low-Voltage DC Micro-grids in Asian
Industrial Parks Propelling Solid-state Rectifiers
Expansion of Low-Voltage DC Micro-grids in Asian
Industrial Parks Propelling Solid-state Rectifiers
| 0.7% | Asia-Pacific, primarily China, Taiwan, South Korea | Medium term (2-4 years) | |||
ASEAN Foundry Build-out Enabling Application-specific
Thyristors for Motor Drives
ASEAN Foundry Build-out Enabling Application-specific
Thyristors for Motor Drives
| 0.6% | Southeast Asia, with spillover to India | Long term (≥ 4 years) | |||
| Source: Mordor Intelligence | ||||||
Industrial automation and robotics are boosting MOSFETs and IGBTs
Robot installations continued to climb at roughly 10% a year through 2025, and each articulated arm carries up to 30 discrete power devices for its variable-frequency drives. Omron’s California motion-research facility demonstrated a 32-axis controller that relies on multiple high-current MOSFET stages for sub-millisecond torque response.[1]Automation World Staff, “Omron’s New R&D Center to Focus on Motion Control Technologies,” Automation World, automationworld.com Infineon expanded its CoolSiC portfolio in parallel, tailoring voltage ratings and packaging to industrial servos, a strategy that helped the firm reach 14% automotive-grade power-device share in 2024. The rising density of collaborative robots amplified safety-critical power redundancy requirements, pushing suppliers to raise short-circuit withstand times in trench-gate devices.
The electrification of heavy equipment is accelerating SiC adoption
Mining trucks, construction excavators, and port cranes shifted from hydraulic pumps to high-voltage electric drives, lifting semiconductor content per vehicle by nearly 200% in power stages alone. A European excavator platform introduced in late 2024 integrated more than 120 SiC MOSFETs to handle 1,500 V DC buses, trimming energy use by 35% and maintenance costs by 45% compared with its diesel-hydraulic predecessor. Equipment OEMs noted that the ability of SiC devices to tolerate 200 °C junctions reduced cooling-plate mass, enabling lighter carriages and longer battery runtimes.
Net-zero factory programs requiring ultrafast diodes
The European Green Deal and aligned US programs earmarked more than USD 50 billion for low-emission manufacturing upgrades. Roughly 15% of that pot flowed to power-conversion retrofits, where silicon-carbide recovery diodes cut switching losses by up to 30% in variable-frequency drives. A German auto-components plant fitted SiC diodes across its line-side rectifiers and UPS banks, lowering annual energy use 28% and eliminating 15,000 t of CO₂.
Edge-IIoT roll-out spurring high-frequency small-signal demand
Industry 4.0 platforms shipped an estimated 5.4 billion wireless sensors in 2025, each embedding low-noise small-signal transistors tuned for 2.4-5 GHz industrial protocols. A Japanese wafer-fab installed more than 12,000 such nodes, using ultra-low-power RF FETs from NXP to maintain data integrity in harsh electromagnetics, which cut unplanned downtime by 37% and lifted equipment effectiveness by 12%.
Restraints Impact Analysis
| Restraint | (~) % Impact on CAGR Forecast | Geographic Relevance | Impact Timeline | |||
|---|---|---|---|---|---|---|
Limited Supply of 8-inch SiC Wafers
Limited Supply of 8-inch SiC Wafers
| -0.8% | Global, with a severe impact in Europe and North America | Short term (≤ 2 years) |
(~) % Impact on CAGR Forecast
:
-0.8%
|
Geographic Relevance
:
Global, with a severe impact in Europe and North America
|
Impact Timeline
:
Short term (≤ 2 years)
|
Shift toward Integrated Power Modules over Stand-alone Discrete
in EU OEMs
Shift toward Integrated Power Modules over Stand-alone Discrete
in EU OEMs
| -0.6% | Europe, with spillover to North America | Medium term (2-4 years) | |||
Thermal-management Limits on High-current IGBTs in
Tropical Climates
Thermal-management Limits on High-current IGBTs in
Tropical Climates
| -0.4% | Southeast Asia, India, the Middle East, and Africa | Medium term (2-4 years) | |||
US-China Export Controls on Advanced Power Devices
US-China Export Controls on Advanced Power Devices
| -0.5% | Global, with a severe impact on the US-China trade corridors | Short term (≤ 2 years) | |||
| Source: Mordor Intelligence | ||||||
Limited supply of 8-inch SiC wafers
Transitioning to 8-inch SiC substrates remained capital-intensive; global qualified output stayed below demand in early 2025, forcing some European drive suppliers to delay SiC roll-outs and revert temporarily to silicon IGBTs. Wolfspeed, Infineon, and ROHM all announced capacity infusions, yet full qualification of new boule lines typically takes 18-24 months, keeping near-term pricing tight.
US-China export controls on advanced power devices
The US Bureau of Industry and Security enforced wider licensing for front-end tools required to fabricate wide-bandgap devices, prompting US OEMs to redesign boards around alternate sourcing and causing 14-month product delays in several high-voltage converter programs. Chinese manufacturers accelerated design-around efforts, a dynamic that fractured global supply chains and raised inventory buffers for multinational equipment builders.
By Product Type: Power transistors cement control of motion-drive electronics
Power transistors contributed 38.20% of the industrial discrete semiconductor market in 2025, an outcome tied to their role in every variable-frequency drive, servo, and charger. The segment grew faster than the overall industrial discrete semiconductor market, tracking a 9.55% CAGR to 2031. Within the category, MOSFETs captured major revenue share, benefiting from rapid trench-gate advances that cut Miller capacitance and trimmed switching losses by 22% in new European servo designs. Small-signal transistors, though only a nominal share of shipments, remained pivotal in sensor conditioning pathways and gate-drive boosters for high-current stages. Notably, precision BJTs still featured in analog interfaces where thermal tracking outweighed raw speed.
The diode and rectifier cluster, accounting for roughly one quarter of market revenue, underpinned line-side protection and DC-link stages that buffer regenerated energy in high-inertia loads. Ultrafast recovery options trimmed reverse-recovery charge by 30 nC, a step that allowed OEMs to raise PWM frequencies and shrink passive EMI filters. As a result, enclosure volumes fell 15% in next-gen motor-control cabinets introduced in early 2025.

Note: Segment shares of all individual segments available upon report purchase
By Material: Silicon-carbide narrows the cost delta with legacy silicon
Silicon still represented 85.05% of 2025 shipments, but wide-bandgap entrants pulled the value needle. The industrial discrete semiconductor market size for SiC devices rose on a steep 16.95% CAGR, as renovators of solar inverters, rail traction, and heavy machinery sought higher temperature ceilings. A North American solar-inverter vendor migrated its 250 kW rack to an all-SiC topology, elevating conversion efficiency to 98.9% and shrinking the heat sink by 40%, which unlocked USD 12,000 of incremental energy capture per MW annually. Gallium-nitride, while just 3% of shipments, found a niche in 2.5 MHz wireless-power drivers and RF plasma generators used in semiconductor etch tools, where its low gate charge provided critical efficiency headroom.
Meanwhile, declining wafer costs trimmed the SiC price premium to roughly 2.5-3× over silicon for 600-1,200 V devices, down from 4-5× in 2020. ROHM projected a further 10-12% annual price contraction as its 8-inch pilot lines ramp through FY 2027, a move expected to pull SiC adoption deeper into the mid-power class.
By Power Rating: >1,200 V nodes deliver premium margins
Low-voltage parts (≤600 V) led volume with 45.10% share, powering innumerable 1-10 kW drives and PLC power supplies. Yet the ≥1,200 V slice grew fastest at 10.12% CAGR as electrified excavators, wind inverters, and medium-voltage drives proliferated. OEMs paid three to four times more per amp for these high-voltage devices, reflecting thicker die, stringent wafer testing, and more elaborate package cooling. A German medium-voltage drive now ships with 1,700 V SiC MOSFETs that link directly to 1,000 V AC mains, eliminating isolation transformers and trimming cabinet volume by 40%.
In the 600-1,200 V battleground, silicon IGBTs retained cost advantage for low-frequency switching, but any design demanding >20 kHz PWM began to favour SiC, particularly where ambient temperatures crossed 50 °C. That shift was most visible in textile-mill drives in India and Southeast Asia, where elevated humidity and dust made derating costly.

Recognized by Experts. Trusted by Leaders.
A trusted intelligence partner to global decision-makers across 90+ countries.


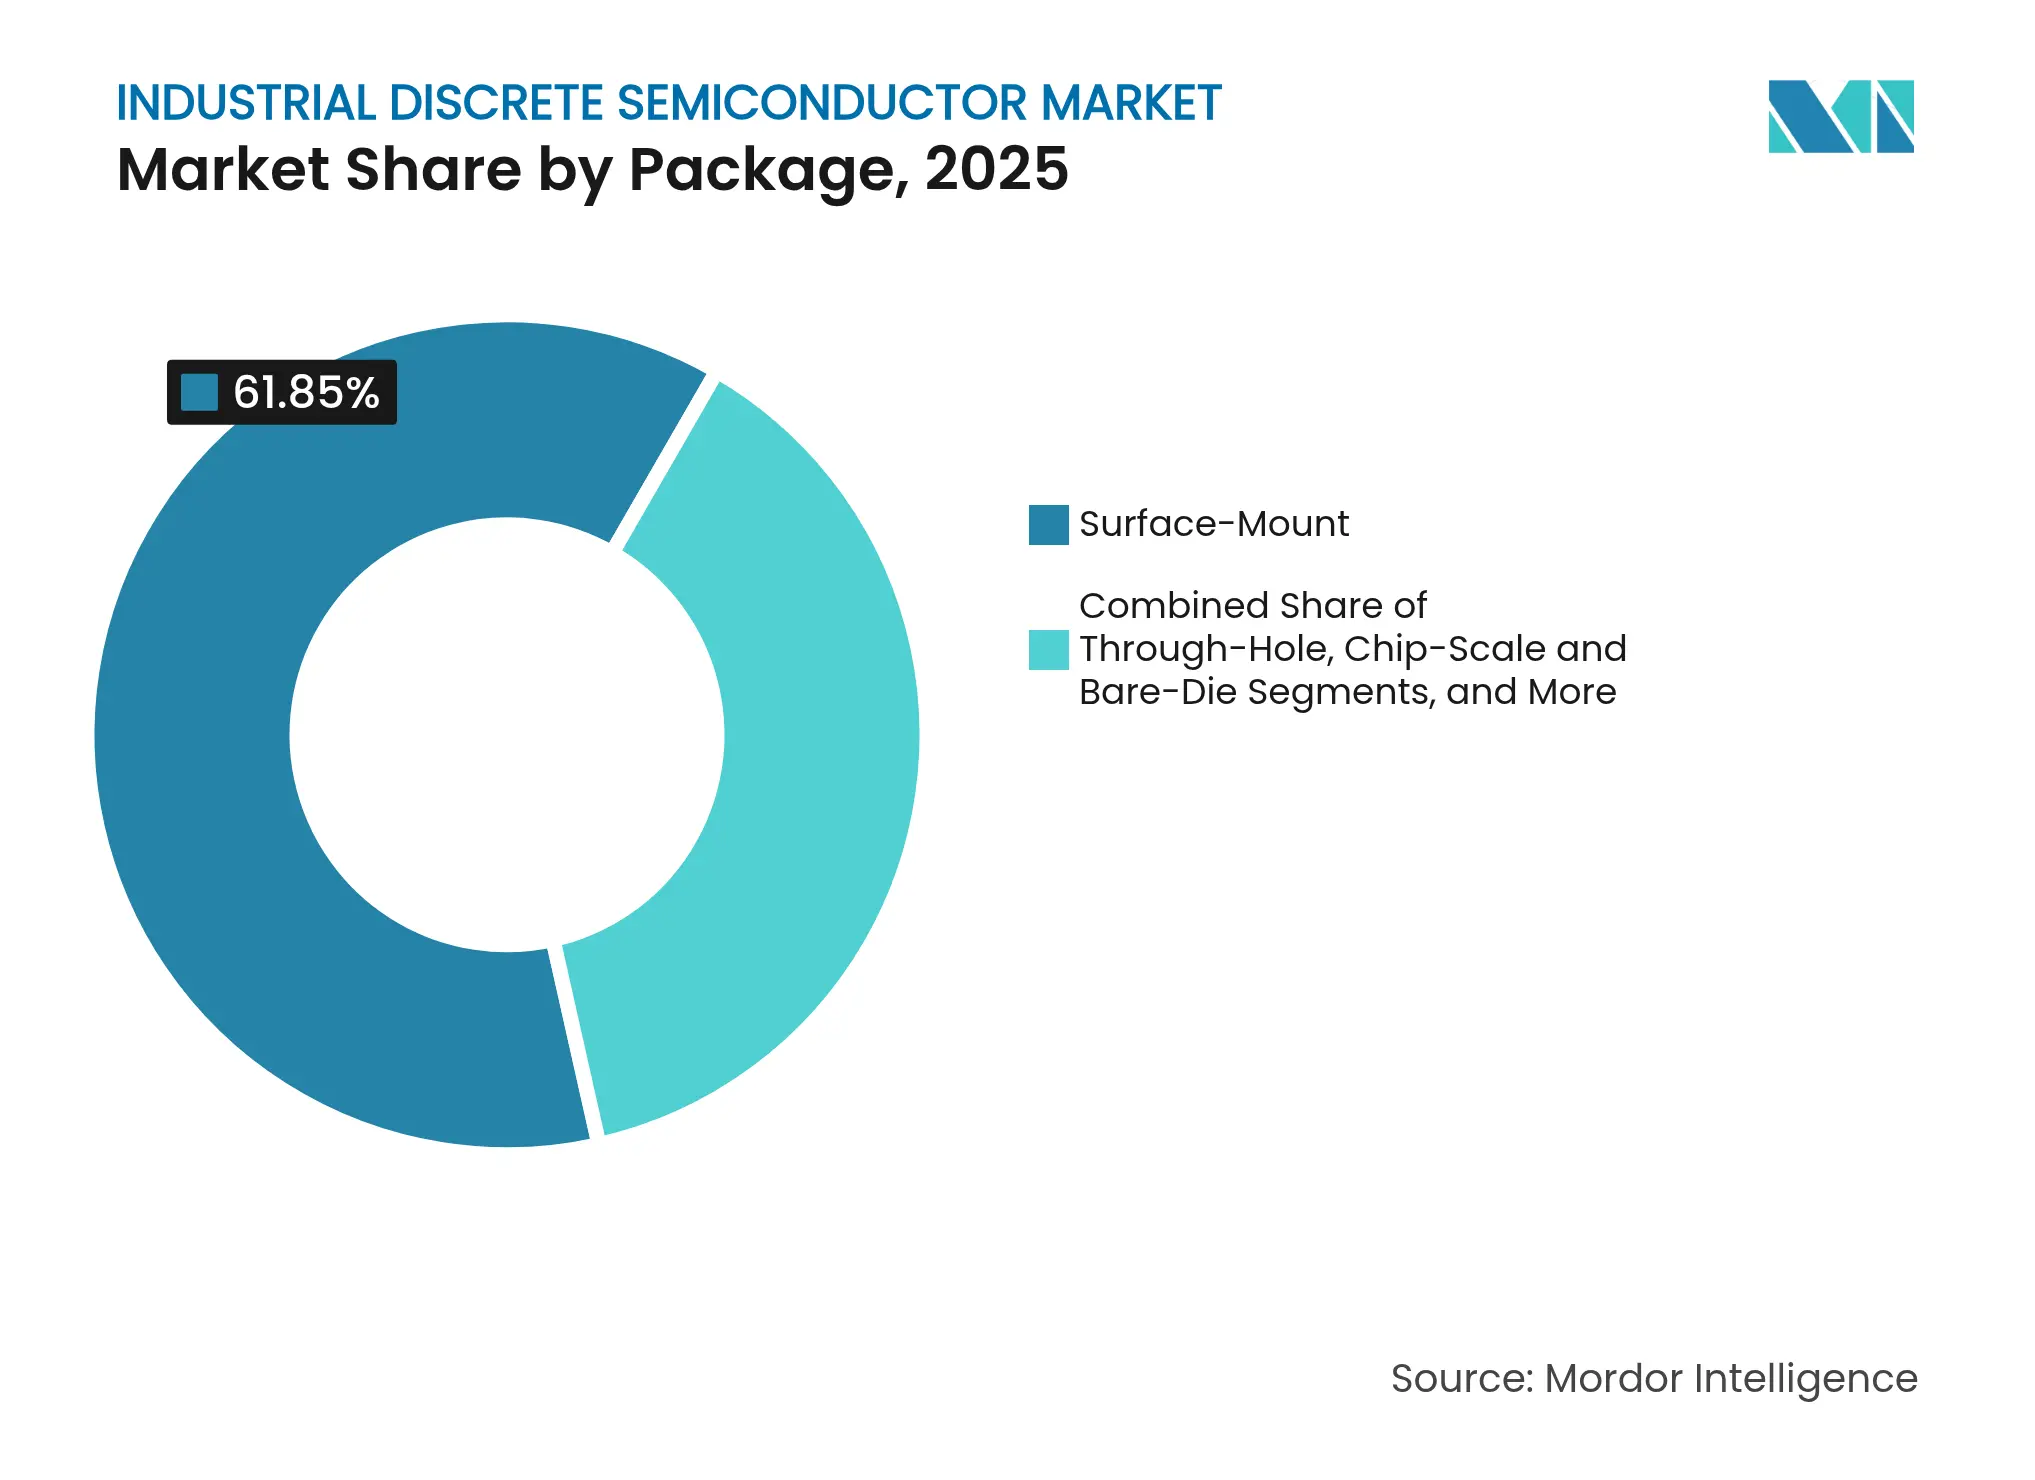
By Package: Hybrid power modules unlock density gains
Surface-mount formats still occupied 61.85% of 2025 shipments, yet power-module and hybrid-package revenue climbed 10.92% CAGR as designers chased higher currents within tight enclosures. Infineon’s HybridPACK Drive G2 Fusion exemplified the blend, pairing silicon IGBTs with SiC diodes in a single moulded power-train, enabling up to 220 kW at 750 V for industrial traction applications. Japanese power-supply firms swapped discrete TO-247 devices for custom board-on-package hybrids, cutting footprint by 65% and eliminating liquid cooling loops.
Through-hole packages held niche ground in 100-A-plus rectifier bridges where vertical heat-flow paths outweighed pick-and-place savings. Chip-scale packaging, while minor in revenue, became essential for edge-sensor nodes embedded in servo housings.
Note: Segment shares of all individual segments available upon report purchase
By End-use Industry: Factory automation still tops, renewables sprint ahead
Factory automation and motion control absorbed 27.75% of 2025 shipments and remained the anchor for the industrial discrete semiconductor market. Each 20-kW servo axis contained USD 500 of discrete content, a figure that rose when SiC drives entered German auto-assembly lines, trimming positional error 40% and slicing annual energy bills by USD 380,000 on a USD 1.2 million capex. Renewable-energy inverters and storage systems, while smaller today, clocked a 12.01% CAGR, a trajectory helped by onsemi’s hybrid Si/SiC F5BP modules that raised string-inverter power density 15% and pushed energy-capture proceeds by USD 2,500 per MW annually.
Industrial robotics multiplied unit demand as each robot integrated 30-50 discrete parts across joint drives, auxiliary axes, and safety circuits. Heavy machinery OEMs also elevated content per unit, with electric actuation replacing hydraulics and requiring robust 1,200-V gate-drivers. Finally, UPS installations for data-centre expansions maintained demand for high-voltage rectifiers and low-loss IGBTs.
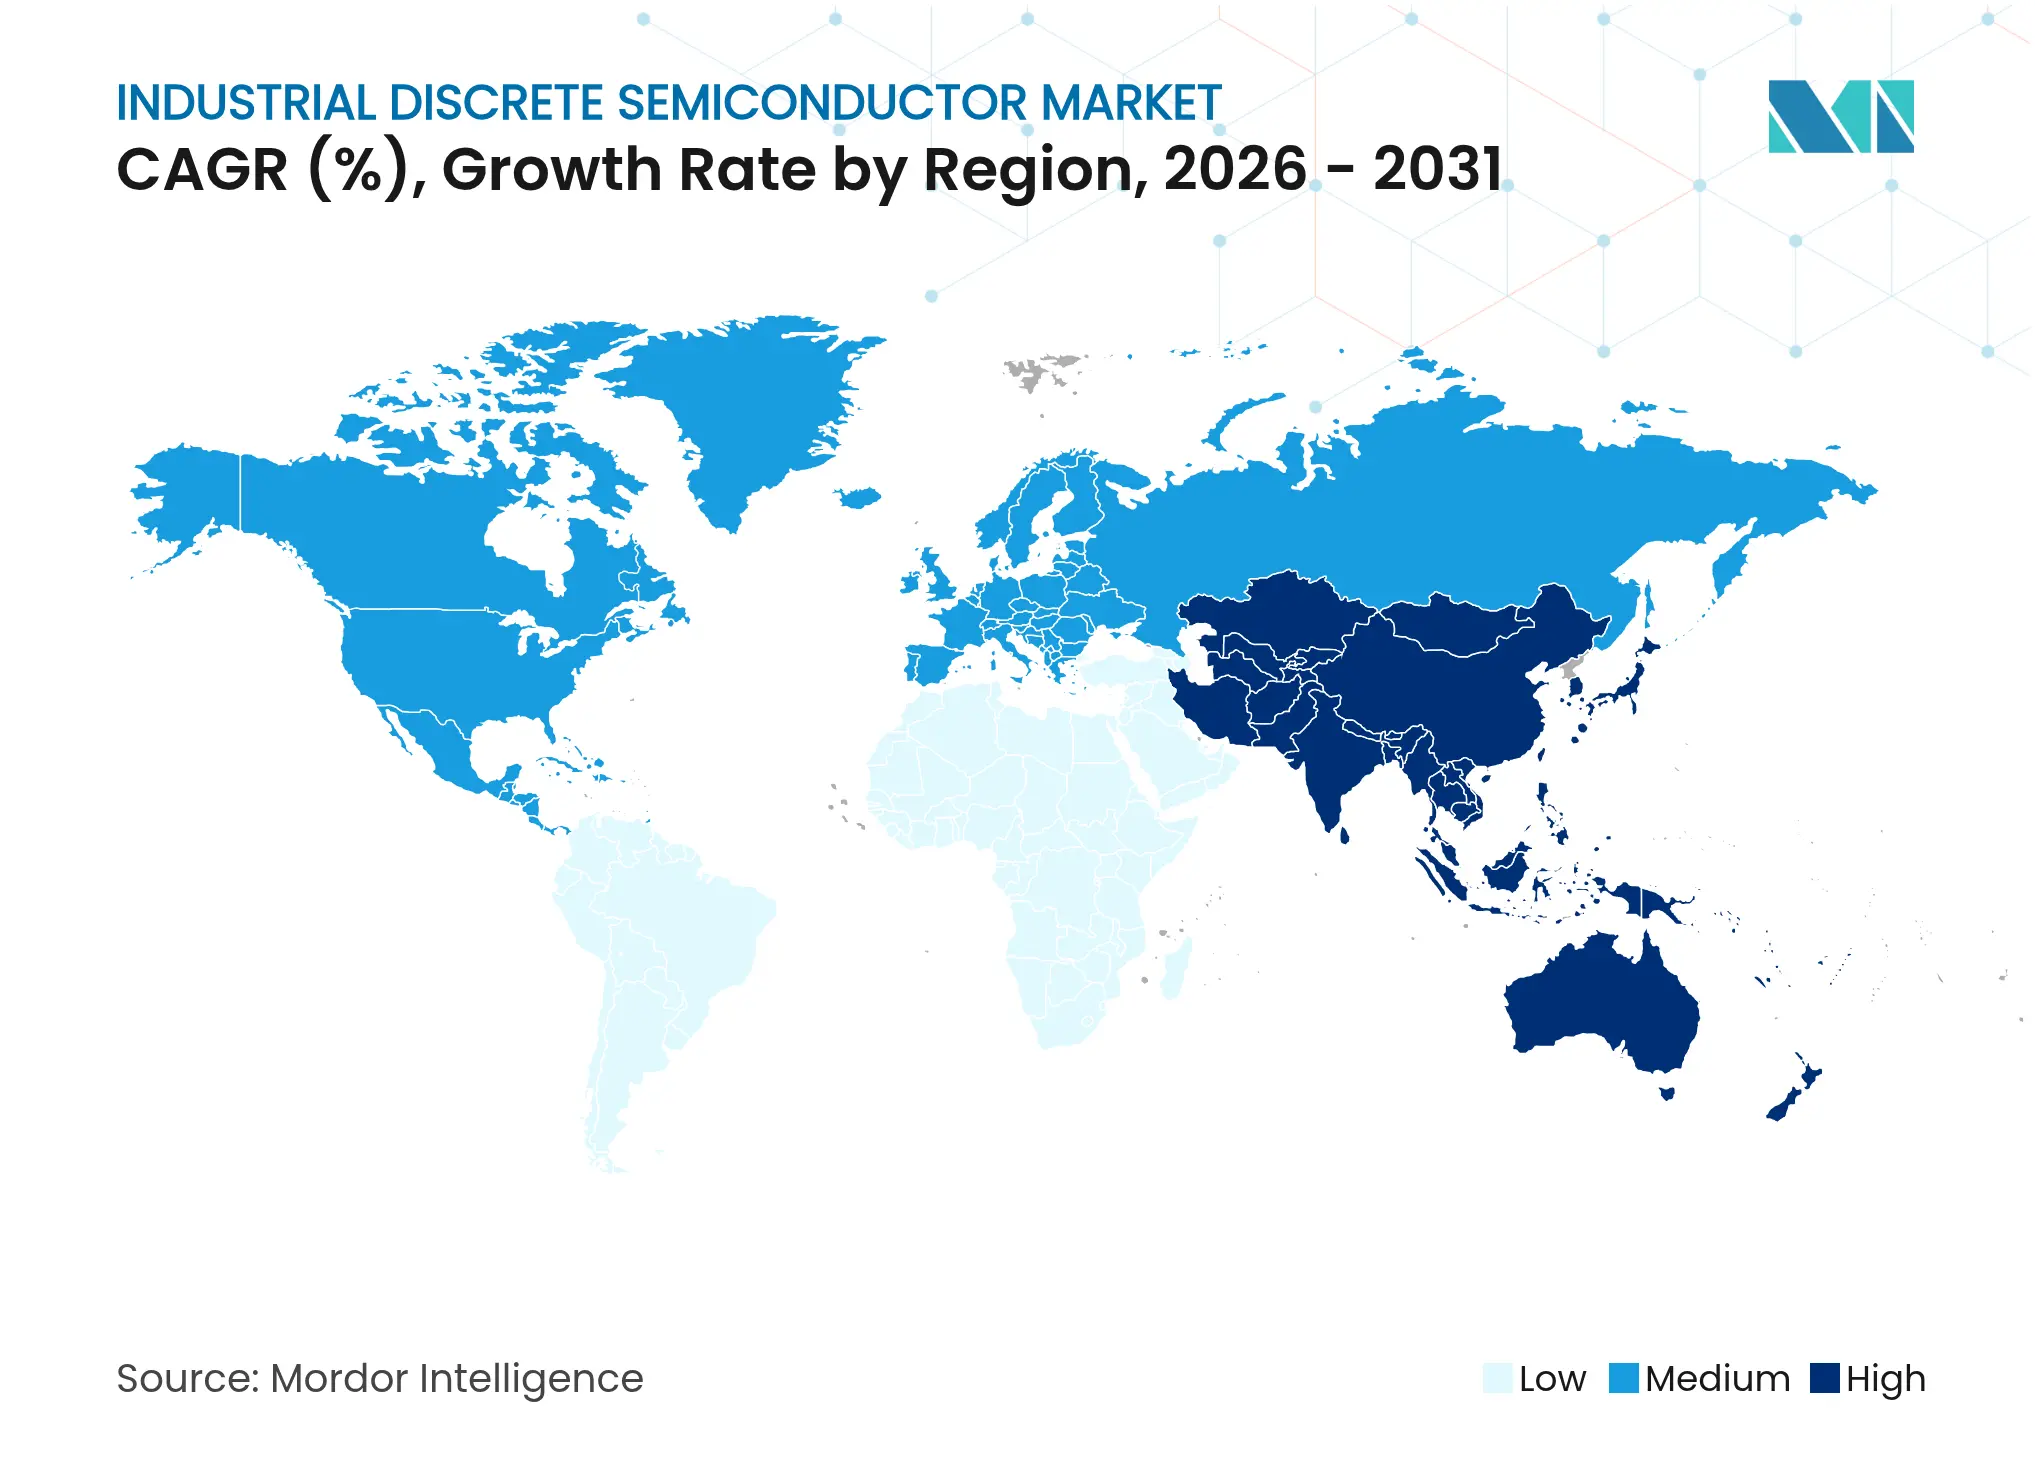
Asia-Pacific held 45.20% of the industrial discrete semiconductor market revenue in 2025 and expanded faster than the global average at an 8.44% CAGR. China spearheaded shipments by vertically integrating power-device fabs inside motor and drive manufacturers, a move that pulled lead times from 16 weeks to 4 weeks and slashed procurement costs by 28%. Japan leveraged automotive-grade process flows to supply high-reliability SiC diodes for robotics and machine tools, while India’s production-linked incentive schemes attracted new mid-voltage MOSFET back-ends. Regional wafer output was forecast to reach 5.2 million units per month by 2026, or roughly 40% of global capacity.
North America’s share centered on SiC ecosystem leadership. Wolfspeed’s Mohawk Valley fab ramp, combined with CHIPS Act grants, positioned the US to secure supply for defense and renewable infrastructure projects. Canadian demand spiked in mining electrification, where 1,700 V SiC MOSFETs enabled trolley-battery hybrid trucks.
Europe advanced its semiconductor sovereignty agenda through the EUR 43 billion (USD 49.31 billion) European Chips Act, with Germany hosting Infineon’s new Dresden fab to produce industrial power discrete starting 2026. Stringent efficiency codes drove early SiC adoption in variable-speed drives and solar microgrids across Germany, France, and the Nordics. Meanwhile, subsidy frameworks encouraged co-design initiatives between chipmakers and equipment OEMs, shortening validation cycles.
South America’s uptake remained concentrated in Brazil’s mining and ethanol-processing plants, where ruggedized IGBTs powered megawatt-class drives.
The Middle East and Africa registered rising orders for rectifiers and TVS diodes in solar farms and oil-field electrification projects, notably in Saudi Arabia and the United Arab Emirates, where net-zero pledges accelerated procurement cycles.
Market Concentration
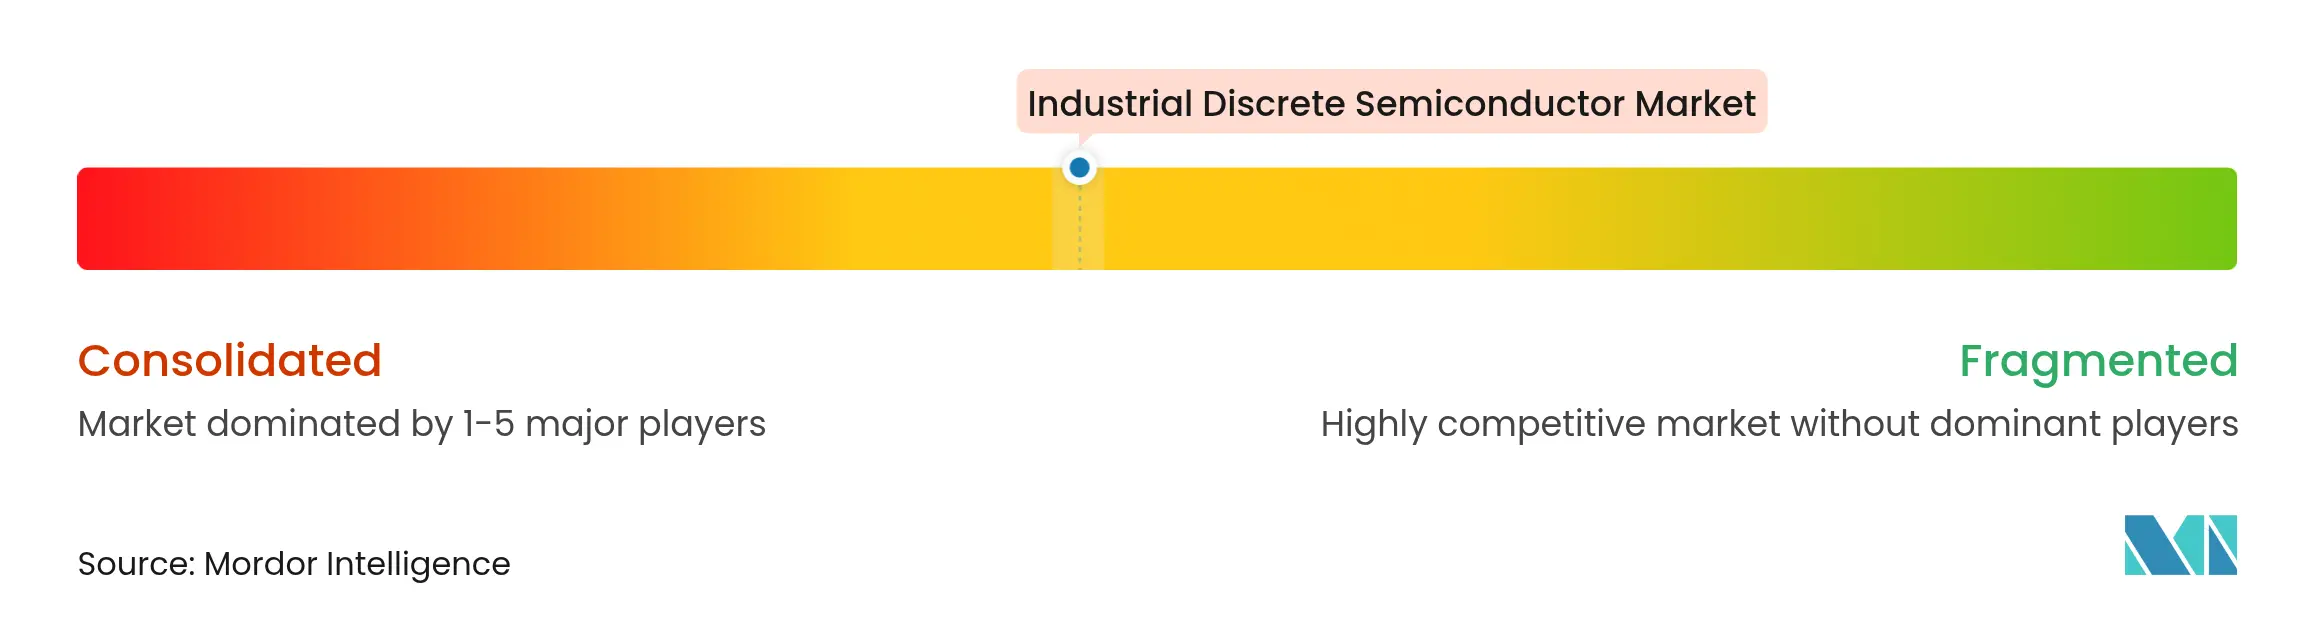
The top five suppliers controlled more than 50% of 2025 revenue, placing the market in a moderately concentrated quadrant. Infineon is leading the global market, supported by a broad silicon, SiC, and GaN stack and by its EUR 920 million (USD 1,054.9 million) Dresden facility intended to raise discrete output by 15%. Onsemi followed at about 12% after a USD 2 billion SiC-capacity build that backed its solar-inverter module portfolio. STMicroelectronics held close to 10% and cross-leveraged automotive safety grades to win industrial inverter sockets.
Specialist players reshaped the field. Wolfspeed pushed SiC boule-growth technology and signed multi-year supply agreements with drive makers, while Transphorm and Navitas exploited GaN for RF power and kilohertz-range wireless chargers. Chinese entrants such as BYD Semiconductor and StarPower expanded aggressively in the mid-power IGBT tier, benefiting from domestic equipment cross-sales.
Strategic alliances multiplied. Infineon cooperated with global automation majors to co-design drive-level modules; Magnachip introduced 650 V IGBTs targeting 350 kW string-inverter blocks.[4]Magnachip PR, “Magnachip Launches Two New Gen6 650 V IGBTs,” magnachip.com Distribution partnerships, such as Astute Group’s deal with Good-Ark, broadened European reach for mid-tier vendors. Vertical integration also resurfaced: a leading Chinese motor builder produced 5 million IGBTs in-house during 2025, insulating itself from export-control volatility.

*Disclaimer: Major Players sorted in no particular order
1. INTRODUCTION
2. RESEARCH METHODOLOGY
3. EXECUTIVE SUMMARY
4. MARKET LANDSCAPE
5. MARKET SIZE AND GROWTH FORECASTS (VALUE)
6. COMPETITIVE LANDSCAPE
7. MARKET OPPORTUNITIES AND FUTURE OUTLOOK
Market Definitions and Key Coverage
Segmentation Overview
Detailed Research Methodology and Data Validation
Primary Research
Desk Research
Market-Sizing & Forecasting
Data Validation & Update Cycle
Why Our Industrial Discrete Semiconductor Baseline Commands Credibility
Benchmark comparison
| Market Size | Anonymized source | Primary gap driver | ||
|---|---|---|---|---|
USD 8.12 B (2025) | Mordor Intelligence | - | Anonymized source:Mordor Intelligence | Primary gap driver:- |
USD 7.34 B (2025) | Global Consultancy A | narrower product list, excludes emerging SiC devices | ||
USD 7.02 B (2024) | Trade Journal B | uses historical averages without price-erosion factors | ||
USD 25.0 B (2024) | Industry Association C | aggregates industrial and transportation demand, inflating base |
Pricing Strategy for Semiconductor Components
3 Min Read
Accelerating Additive Manufacturing Adoption in India
3 Min Read
When decisions matter, industry leaders turn to our analysts. Let’s talk.