GaN On Silicon Technology Market Size and Share
Market Overview
| Study Period | 2019 - 2030 |
|---|---|
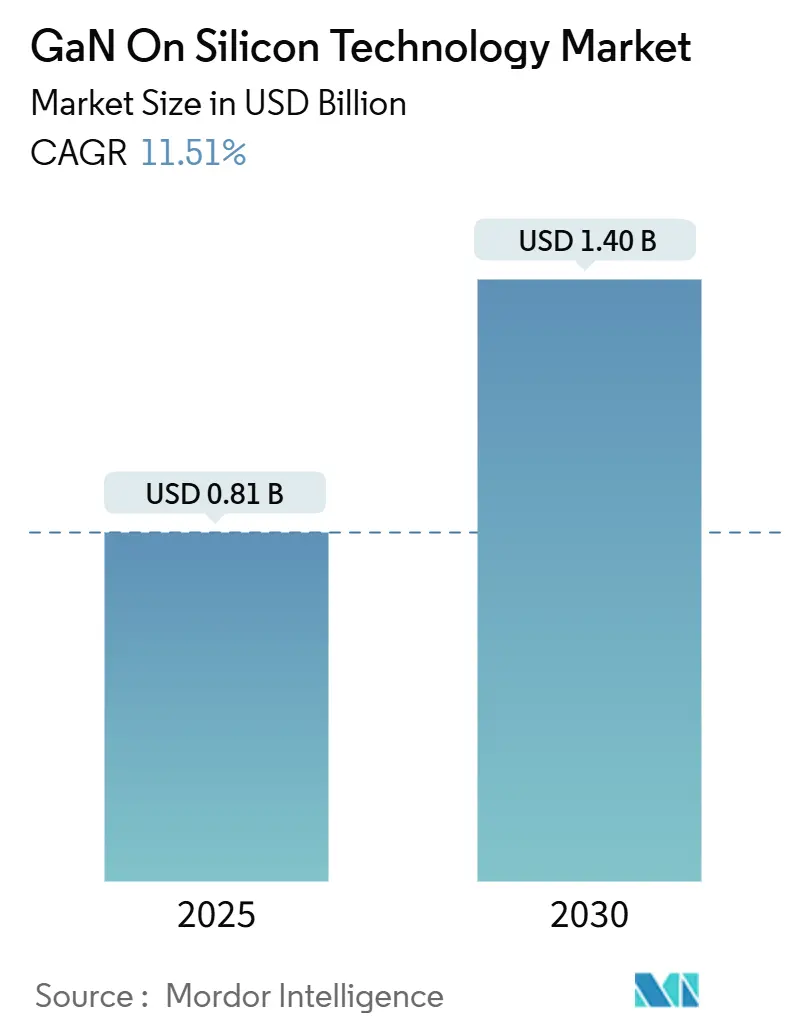
| Market Size (2025) | USD 0.81 Billion |
| Market Size (2030) | USD 1.40 Billion |
| Growth Rate (2025 - 2030) | 11.51% CAGR |
| Fastest Growing Market | Asia Pacific |
| Largest Market | North America |
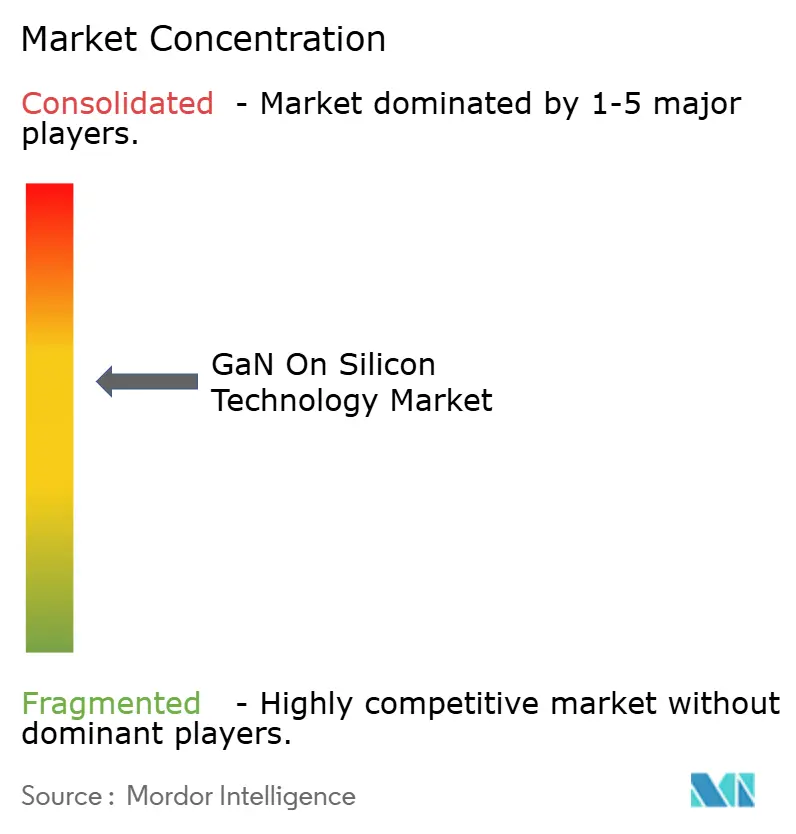
| Market Concentration | Medium |
Major Players *Disclaimer: Major Players sorted in no particular order Image © Mordor Intelligence. Reuse requires attribution under CC BY 4.0. | |
GaN On Silicon Technology Market Analysis by Mordor Intelligence
The GaN on Silicon Technology market size reaches USD 0.81 billion in 2025 and is forecast to grow at an 11.51% CAGR, expanding to USD 1.40 billion by 2030. Increasing reliance on wide-bandgap materials for power electronics, the migration of 5G infrastructure, rising electric-vehicle (EV) charging volumes, and efficiency demands in AI data centers collectively push the GaN on Silicon Technology market well beyond the growth rates of mainstream silicon. Manufacturers gain cost leverage by migrating to larger 8-inch and 12-inch wafers, a shift that lowers cost-per-device while improving yield. The technology’s efficiency advantages translate directly into smaller, lighter, and cooler systems, creating clear design-win momentum in telecom radios, fast chargers, and server power supplies. Supply security concerns around gallium are prompting strategic investments in domestic wafer capacity, while continuous reliability improvements mitigate historical concerns tied to GaN-to-Si thermal mismatch. Amid these factors, the GaN on Silicon Technology market continues to attract both integrated device manufacturers and fabless specialists that see a sizable window to displace incumbent silicon and silicon-carbide solutions.
Key Report Takeaways
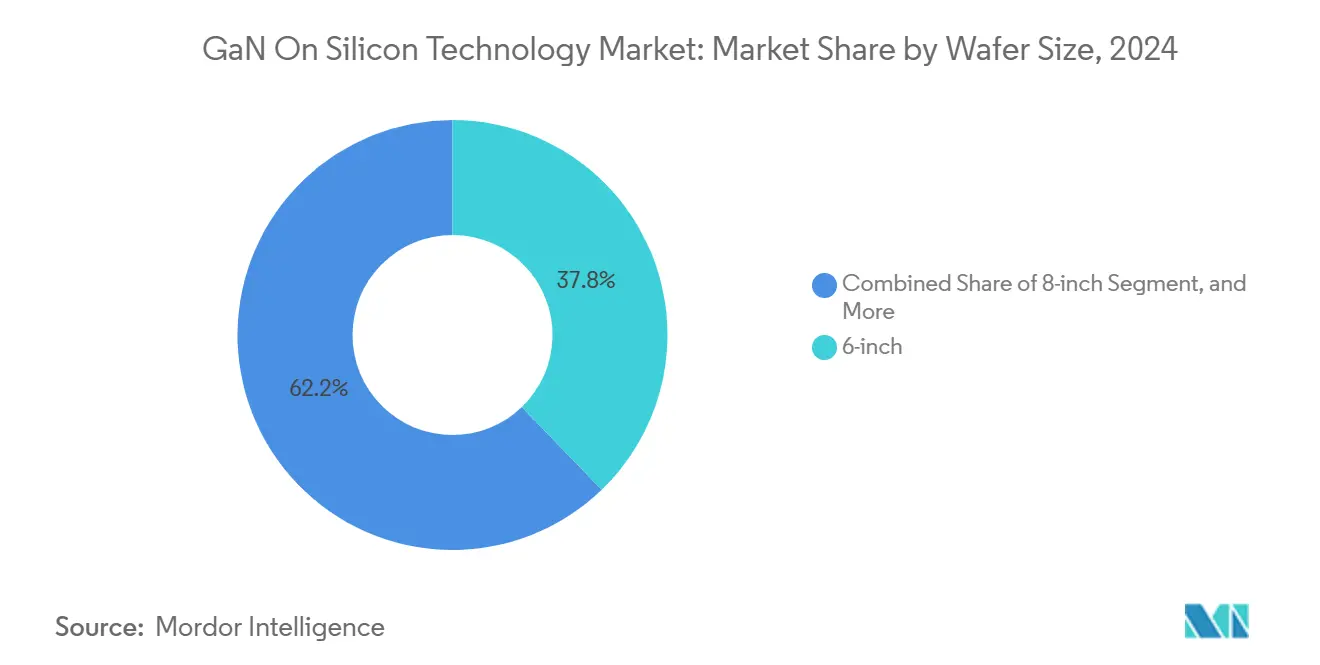
- By wafer size, 6-inch substrates held 37.8% of GaN on Silicon Technology market share in 2024, whereas the 8-inch segment is projected to post a 12.4% CAGR through 2030.
- By device type, discrete high-electron-mobility transistors (HEMTs) led with 35.2% revenue in 2024, while power integrated circuits are on track to expand at a 13.0% CAGR to 2030.
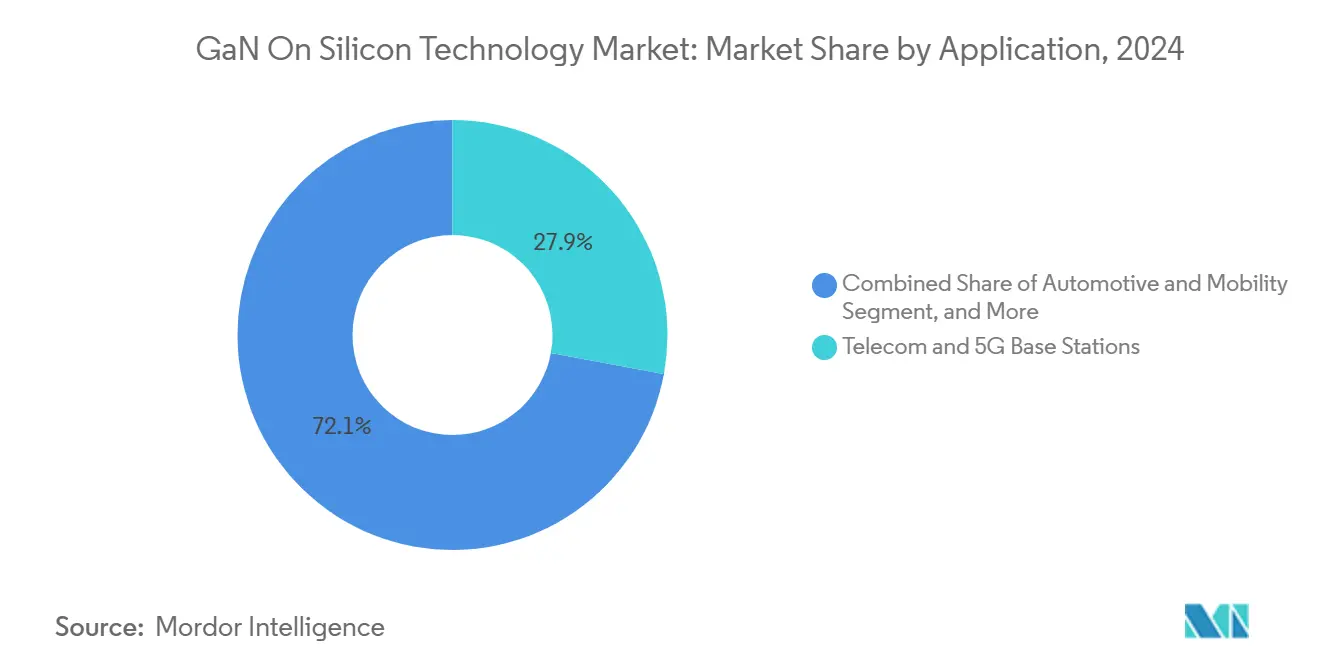
- By application, telecom and 5G base stations accounted for 27.9% of the 2024 GaN on Silicon Technology market size; renewable-energy micro-inverters exhibit the fastest 11.9% CAGR outlook.
- By end-user, original-equipment manufacturers (OEMs) represented 67.8% of 2024 demand, whereas Tier-1 automotive suppliers show the strongest 13.4% CAGR growth to 2030.
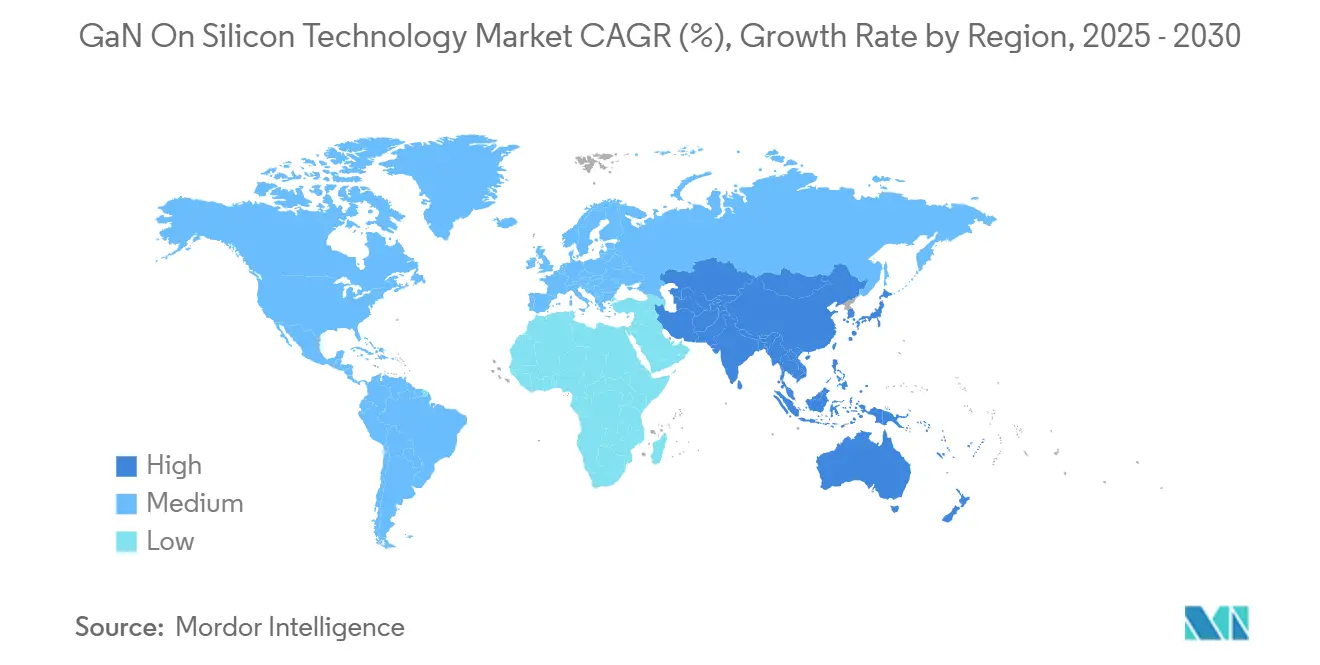
- By geography, North America captured 36.5% of 2024 sales, while Asia-Pacific is forecast to lead growth at a 12.7% CAGR through 2030.
Global GaN On Silicon Technology Market Trends and Insights
Drivers Impact Analysis*
| Driver | (~) % Impact on CAGR Forecast | Geographic Relevance | Impact Timeline |
|---|---|---|---|
| Transition to 8-inch GaN-on-Si wafers | +2.8% | Global, early adoption in North America and APAC | Medium term (2-4 years) |
| Surging demand from 5G base stations and fast chargers | +3.2% | Global, concentrated in APAC and North America | Short term (≤ 2 years) |
| EV power-train shift toward GaN for on-board chargers | +2.1% | North America and EU, expanding to APAC | Medium term (2-4 years) |
| Data-center PSU migration to greater than 3 kW GaN designs | +1.9% | Global, led by North America | Short term (≤ 2 years) |
| IEC appliance-efficiency rules boosting GaN SMPS | +1.2% | EU and North America, extending globally | Long term (≥ 4 years) |
| National gallium-supply incentives | +0.9% | North America and EU | Long term (≥ 4 years) |
| Source: Mordor Intelligence | |||
Transition to 8-inch GaN-on-Si wafers drives cost-per-device down
The cost curve of the GaN on Silicon Technology market pivots on wafer diameter. Texas Instruments validated an 8-inch production ramp that yields 2.3 times more die per wafer while employing legacy silicon tooling, cutting capital outlays and unit cost simultaneously. Infineon has demonstrated 12-inch pilot wafers and aims for volume availability by 2026, a step expected to close the price gap with silicon MOSFETs.[1]Infineon Technologies, “Infineon pioneers 300 mm GaN technology,” infineon.comLarger substrates inherently lower epitaxial cost proportion, historically as high as 60% of device expense, and early yield data shows defect densities falling as wafer size grows. Foundries confirming 8-inch compatibility unlock immediate scale benefits for consumer chargers, telecom radios, and server supplies. In turn, lower cost broadens addressable volume without compromising GaN’s efficiency edge over silicon-carbide competitors.
Surging demand from 5G base stations and fast chargers
Global 5G rollouts call for higher-frequency, high-power radios that outperform older gallium-arsenide devices. GaN delivers 3-6 times the power density, enabling smaller amplifier footprints and reduced energy use per bit. Parallel momentum comes from consumer fast chargers, where GaN’s higher switching speeds halve charger volume for 65 W to 100 W USB-C designs. Adoption accelerates because operators deploy tens of thousands of 5G radios every quarter, and brand-name smartphone makers bundle compact GaN chargers that visibly showcase performance. Together these twin volume engines keep fab utilization high, encouraging additional capacity investment that underpins sustained double-digit expansion in the GaN on Silicon Technology market.
EV power-train shift toward GaN for on-board chargers
Weight saving and energy efficiency sit at the center of next-generation EV architecture. GaN devices enable 48 V power subsystems that trim harness mass by up to 40% and cut conversion losses relative to silicon IGBTs. Mazda and ROHM have formalized a joint program to deliver GaN-based charging electronics by fiscal 2027, signaling OEM commitment that extends beyond low-volume prototypes. Tier-1 suppliers embed GaN switches into compact DC-DC modules that fit tight engine-bay envelopes, resolving long-standing packaging challenges. Regulatory pressure for higher charging efficiency, particularly in Europe, incentives rapid design-in. As a result, automotive demand registers the fastest compound growth among end-users, adding significant incremental volume to the GaN on Silicon Technology market.
Data-center PSU migration to greater than 3 kW GaN architectures
AI workloads raise rack power beyond 120 kW, forcing data-center operators to pursue conversion stages exceeding 3 kW with 97%+ efficiency. Infineon’s reference design couples GaN switches with digital controllers to reach 97.5% efficiency in 8 kW supplies, reducing cooling loads and electricity cost. Murata’s adoption of ROHM EcoGaN for 5.5 kW units entering mass production in 2025 confirms mainstream readiness. Navitas and NVIDIA collaborate on 800 V high-voltage direct current (HVDC) distribution, highlighting GaN’s headroom for even harsher conversion ratios. Operators, pressured by environmental targets, quantify immediate PUE gains, which justify GaN’s premium. Cumulatively, data-center adoption supports the higher-margin portion of the GaN on Silicon Technology market and reinforces confidence in long-term capacity expansion.
Restraints Impact Analysis*
| Restraint | (~) % Impact on CAGR Forecast | Geographic Relevance | Impact Timeline |
|---|---|---|---|
| Reliability concerns from GaN-Si thermal mismatch | -1.8% | Global, notable in automotive and industrial | Medium term (2-4 years) |
| SiC cost curve still favors SiC in high-power traction | -1.4% | Global, centered in automotive traction | Long term (≥ 4 years) |
| Scarce Sc₂O₃ / AlN buffer supply for epitaxy | -0.9% | Global, affecting advanced manufacturing | Short term (≤ 2 years) |
| China export controls on gallium feedstock | -1.1% | Global, acute in US and EU | Short term (≤ 2 years) |
| Source: Mordor Intelligence | |||
Reliability concerns from GaN-Si thermal mismatch
A 54% coefficient-of-expansion gap between GaN layers and silicon substrates creates mechanical stress during rapid temperature swings. Long-term cycling studies report via failures after 220,000 power cycles with 100 K swings, raising hurdles in automotive qualification where 15-year service life is mandatory. Buffer-layer engineering has brought partial relief, yet added epitaxy steps elevate cost and complexity. Automotive and factory-automation customers, facing continuous load variations, request extended burn-in proof, lengthening design cycles. Until robust packaging and heat-spreader solutions reach mass availability, reliability concerns cap penetration rates in mission-critical fields, tempering near-term growth of the GaN on Silicon Technology market.
China’s export controls on gallium feedstock
China produces 98% of primary gallium, allowing export restrictions imposed in 2023 to ripple across the global supply chain. The US Geological Survey calculates a potential USD 3.4 billion GDP loss if gallium shortages disrupt domestic fabs.[2]US Geological Survey, “Gallium export ban impact,” usgs.govPrice spikes exceeding 150% hamper cost-sensitive consumer charger designs and complicate just-in-time inventories. The US CHIPS Act now allocates funds to gallium recovery projects, but recycling supply remains years from meaningful volume. Uncertainty pushes device makers to dual-source buffers and recalibrate safety stocks, adding operational cost. While policy support eventually mitigates risk, short-term gallium volatility subtracts momentum from the GaN on Silicon Technology market.
*Our forecasts treat driver/restraint impacts as directional, not additive. The impact forecasts reflect baseline growth, mix effects, and variable interactions.
Segment Analysis
By Wafer Size: cost-effective scale tilts to 8-inch production
The 6-inch format maintained 37.8% of GaN on Silicon Technology market share in 2024 as it matches installed toolsets across legacy compound fabs. Eight-inch substrates, however, post a 12.4% CAGR because they fit mainstream silicon foundry lines and yield more than double the die per wafer, slashing cost-per-ampere. Infineon’s 12-inch pilot demonstrated a viable path to parity with silicon MOSFET cost structures, setting the stage for consumer electronics inflection once mass yield stabilizes.
Scaling momentum shapes supplier strategy. Dedicated GaN start-ups partner with 8-inch foundries to sidestep capital barriers, while integrated device manufacturers pour resources into 12-inch pilot lines to lock supply leadership. Epitaxial vendors invest in higher-temperature reactors that maintain uniform thickness at larger diameters, a prerequisite for automotive qualification. The wafer-size race directly lowers the GaN on Silicon Technology market size barrier for fast-moving consumer goods and broad industrial power supplies, expanding total addressable demand.


By Device Type: integration accelerates power-IC uptake
Discrete HEMTs dominated 35.2% of 2024 revenue because of mature gate-drive ecosystems and straightforward qualification. Power integrated circuits, combining GaN switches with control, protection, and sometimes silicon logic, grow at 13.0% CAGR by eliminating external driver boards that consume space and add EMI risk. Integrated designs also push switching frequencies into the multi-MHz regime, which shrinks passive components.
System developers welcome shorter design cycles and smaller bills of materials, prompting ODMs to favor turnkey GaN ICs for new consumer chargers and audio amplifiers. Advanced multichip packaging streams heat away from stacked dies, addressing reliability reservations. Over time, integration narrows total cost of ownership, positioning power ICs as the default choice for mass-volume applications in the GaN on Silicon Technology market.
By Application: renewable energy emerges as growth engine
Telecom and 5G infrastructure absorbed 27.9% of 2024 sales, reflecting operator demand for efficient RF amplification. Solar micro-inverters and broader renewable-energy systems register the highest 11.9% CAGR because GaN’s high-frequency operation allows smaller magnetics and raises conversion efficiency by 1-2 points. Regulatory frameworks that cap inverter loss at grid connection drive installers to seek these gains.
The GaN on Silicon Technology market size for distributed-generation hardware grows further as residential installers adopt plug-and-play micro-inverters. Durability matters: GaN’s lower junction temperature under identical load stress enhances lifetime, aligning with 20-year rooftop warranties. Renewable-energy demand thus transforms GaN from niche telecom parts into mainstream power devices that attract scale manufacturing investment.
By End-user Industry: automotive Tier-1s reshape demand horizon
OEMs retained 67.8% of procurement in 2024 thanks to direct sourcing for smartphones, base stations, and industrial controls. Tier-1 automotive suppliers, however, deliver a 13.4% CAGR as they embed GaN into on-board chargers, DC-DC converters, and radar modules central to next-generation EVs. Automotive qualification once limited adoption, yet early design wins underline maturing reliability.
Procurement dynamics evolve: Tier-1s secure multi-year supply agreements to shield programs from gallium volatility, effectively smoothing revenue visibility for wafer fabricators. As more automakers migrate to 800 V drivetrains, GaN penetration accelerates in auxiliary conversion stages, adding depth to the GaN on Silicon Technology market.
Geography Analysis
North America accounted for 36.5% of 2024 revenue on the back of CHIPS-Act funding worth USD 1.5 billion to expand GaN lines at GlobalFoundries’ facilities. Defense procurement prioritizes secure domestic chains for radar and electronic-warfare electronics, ensuring high-margin anchor demand. Canada’s renewable-energy expansion and Mexico’s EV supply-chain investments widen regional consumption, adding breadth beyond the United States.
Europe leverages stringent appliance and industrial-motor efficiency mandates to expand GaN uptake. Germany’s automation clusters move to GaN to curb factory energy bills, while the United Kingdom prioritizes GaN small-cell radios for dense 5G coverage. The EU Chips Act allocates capital to regional foundries, reducing dependence on Asian substrate shipments. Automotive giants align design roadmaps with local GaN suppliers to secure strategic autonomy as the bloc tightens vehicle-efficiency rules.
Asia-Pacific shows the fastest 12.7% CAGR mainly through Chinese capacity scale-up and Japanese materials leadership. China’s five-year plan highlights wide-bandgap semiconductors as a strategic pillar, underwriting both construction of new 8-inch fabs and vertical-GaN R&D programs. Japan supplies metal-organic chemical-vapor-deposition reactors and substrate polishers critical for high-yield GaN epitaxy. South Korea starts to duplicate this model, pairing memory-fab know-how with power-device expertise, while India’s USD 10 billion incentive scheme targets GaN pilot lines for telecom and defense. Collectively, rising output volumes in Asia lower global price points and accelerate adoption in the GaN on Silicon Technology market.

Competitive Landscape
The GaN on Silicon Technology market balances between integrated device manufacturers that leverage large capital bases and focused specialists driving design innovation. Infineon, Texas Instruments, and Nexperia head the manufacturing scale race by retrofitting 8-inch and testing 12-inch lines. Navitas, EPC, and Transphorm concentrate on power IC integration, securing design wins in fast chargers and data-center blocks. Renesas’ USD 339 million purchase of Transphorm exemplifies consolidation and signals mainstream acceptance.[3]Renesas Electronics, “Renesas completes acquisition of Transphorm,” renesas.com
Intellectual-property filings increasingly center on vertical GaN architectures as suppliers seek voltage extensions beyond 1,200 V, a space silicon-carbide currently dominates. Patent races intensify in gate-design, buffer-engineering, and packaging, creating entry barriers for latecomers. Concurrently, gallium-supply risk motivates Western players to secure long-term feedstock contracts, further segmenting the competitive field.
Partnership models evolve: fabs align with substrate makers for supply security, Tier-1 automotive firms co-develop reliability protocols, and cloud operators collaborate on high-density PSUs. Moderate concentration persists because cumulative revenue of the five largest companies stands near 55%, allowing specialized entrants to carve niches while incumbents defend share through wafer-scale economies.
GaN On Silicon Technology Industry Leaders
Infineon Technologies AG
NXP Semiconductors N.V
Toshiba Corporation
Renesas Electronics Corporation
Texas Instruments Incorporated
- *Disclaimer: Major Players sorted in no particular order

Recent Industry Developments
- March 2025: Texas Instruments introduced GaN power stages that exceed 98% efficiency for data-center supplies and unveiled the first 48 V hot-swap eFuse above 6 kW.
- March 2025: Nexperia released 12 enhancement-mode GaN FETs from 40 V to 700 V to serve LED drivers and PFC stages.
- February 2025: Navitas Semiconductor reported USD 83.3 million FY 2024 revenue with GaN sales growing more than 50% year-over-year.
- January 2025: Vermont GaN Tech Hub secured USD 23.7 million EDA funding to expand GaN workforce training and pilot manufacturing.


Global GaN On Silicon Technology Market Report Scope
| 2-inch |
| 4-inch |
| 6-inch |
| 8-inch |
| 12-inch |
| Discrete Power Transistors (HEMTs) |
| Integrated Circuits (Power ICs) |
| Power Modules |
| RF Front-End Modules |
| Other Device Types |
| Consumer Electronics and Fast Chargers |
| Telecom and 5G Base Stations |
| Renewable Energy and Solar Micro-inverters |
| Automotive and Mobility |
| Industrial Motor Drives and UPS |
| Defense and Aerospace RF |
| Other Applications |
| OEMs |
| ODMs / EMS |
| Tier-1 Automotive Suppliers |
| Power-Conversion Specialists |
| North America | United States | |
| Canada | ||
| Mexico | ||
| Europe | Germany | |
| United Kingdom | ||
| France | ||
| Italy | ||
| Spain | ||
| Rest of Europe | ||
| Asia-Pacific | China | |
| Japan | ||
| India | ||
| South Korea | ||
| Australia | ||
| Rest of Asia-Pacific | ||
| South America | Brazil | |
| Argentina | ||
| Rest of South America | ||
| Middle East and Africa | Middle East | Saudi Arabia |
| United Arab Emirates | ||
| Rest of Middle East | ||
| Africa | South Africa | |
| Egypt | ||
| Rest of Africa | ||
| By Wafer Size | 2-inch | ||
| 4-inch | |||
| 6-inch | |||
| 8-inch | |||
| 12-inch | |||
| By Device Type | Discrete Power Transistors (HEMTs) | ||
| Integrated Circuits (Power ICs) | |||
| Power Modules | |||
| RF Front-End Modules | |||
| Other Device Types | |||
| By Application | Consumer Electronics and Fast Chargers | ||
| Telecom and 5G Base Stations | |||
| Renewable Energy and Solar Micro-inverters | |||
| Automotive and Mobility | |||
| Industrial Motor Drives and UPS | |||
| Defense and Aerospace RF | |||
| Other Applications | |||
| By End-user Industry | OEMs | ||
| ODMs / EMS | |||
| Tier-1 Automotive Suppliers | |||
| Power-Conversion Specialists | |||
| By Geography | North America | United States | |
| Canada | |||
| Mexico | |||
| Europe | Germany | ||
| United Kingdom | |||
| France | |||
| Italy | |||
| Spain | |||
| Rest of Europe | |||
| Asia-Pacific | China | ||
| Japan | |||
| India | |||
| South Korea | |||
| Australia | |||
| Rest of Asia-Pacific | |||
| South America | Brazil | ||
| Argentina | |||
| Rest of South America | |||
| Middle East and Africa | Middle East | Saudi Arabia | |
| United Arab Emirates | |||
| Rest of Middle East | |||
| Africa | South Africa | ||
| Egypt | |||
| Rest of Africa | |||


Key Questions Answered in the Report
What revenue milestone does the GaN on Silicon Technology market reach by 2030?
The GaN on Silicon Technology market is projected to hit USD 1.40 billion by 2030 at an 11.51% CAGR.
Which wafer size grows fastest within GaN on Silicon Technology?
8-inch wafers expand at a 12.4% CAGR because they double die output and leverage existing silicon fabs.
Why is GaN favored for 5G radio power amplifiers?
GaN delivers 3-6 times higher power density than legacy GaAs devices, enabling smaller, more efficient 5G radios.
How do EV manufacturers benefit from GaN on-board chargers?
GaN supports 48 V subsystems that cut wiring weight by up to 40% and improve conversion efficiency, extending vehicle range.
What is the main reliability challenge for GaN-on-silicon devices?
Thermal-expansion mismatch between GaN layers and the silicon substrate induces mechanical stress that can degrade devices over long duty cycles.
How do China’s gallium export controls affect the GaN supply chain?
With China supplying 98% of gallium, export restrictions can inflate raw-material prices and create procurement risk, prompting Western capacity diversification.
Page last updated on:


