Indoor Positioning And Navigation Market Size and Share
Market Overview
| Study Period | 2019 - 2030 |
|---|---|
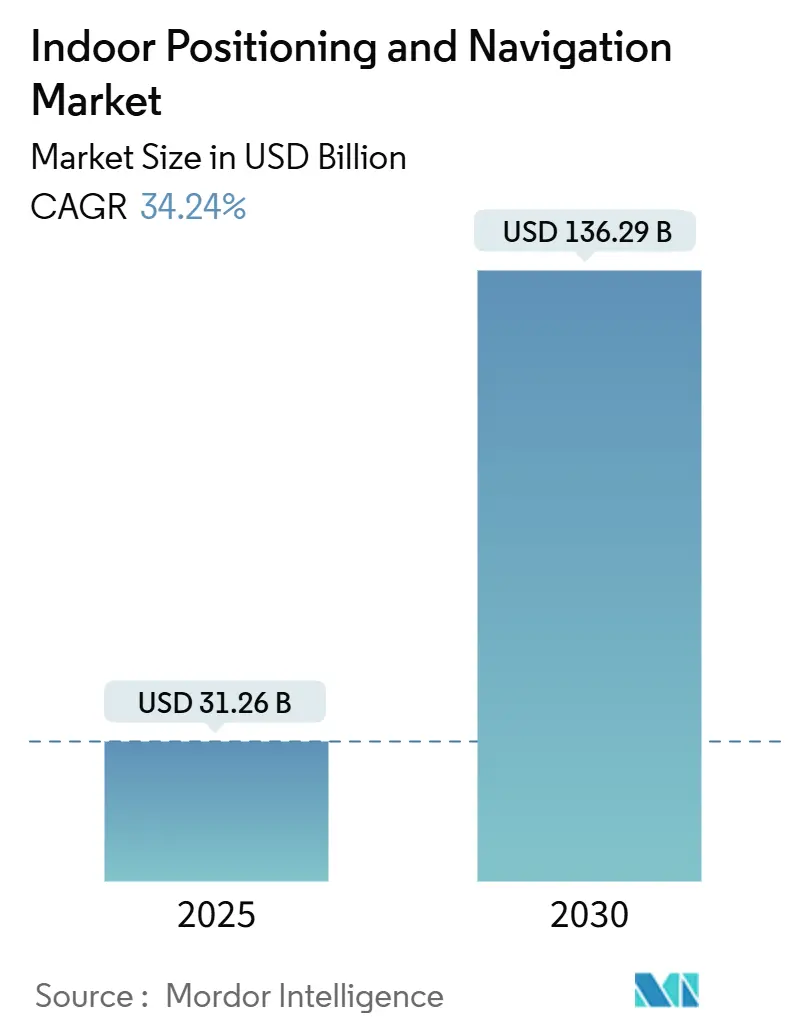
| Market Size (2025) | USD 31.26 Billion |
| Market Size (2030) | USD 136.29 Billion |
| Growth Rate (2025 - 2030) | 34.24% CAGR |
| Fastest Growing Market | Asia Pacific |
| Largest Market | North America |
| Market Concentration | Medium |
Major Players *Disclaimer: Major Players sorted in no particular order Image © Mordor Intelligence. Reuse requires attribution under CC BY 4.0. | |
Indoor Positioning And Navigation Market Analysis by Mordor Intelligence
The indoor positioning and navigation market size stood at USD 31.26 billion in 2025 and is projected to reach USD 136.29 billion by 2030, reflecting a 34.24% CAGR over the forecast period. This rapid expansion is underpinned by several reinforcing forces: the ubiquity of BLE- and UWB-enabled smartphones, the commercial rollout of IEEE 802.11az (Wi-Fi 7) access points that deliver centimeter-level accuracy, and emergency-services regulations that demand reliable Z-axis positioning indoors. Enterprises are capitalizing on these advances to unlock operational efficiencies, boost customer engagement, and comply with location-accuracy mandates. Technology suppliers, meanwhile, are racing to certify new devices through the FiRa Consortium and to integrate positioning features into broader IoT and digital-twin platforms, signalling a structural shift toward data-driven facility operations and asset intelligence.
Key Report Takeaways
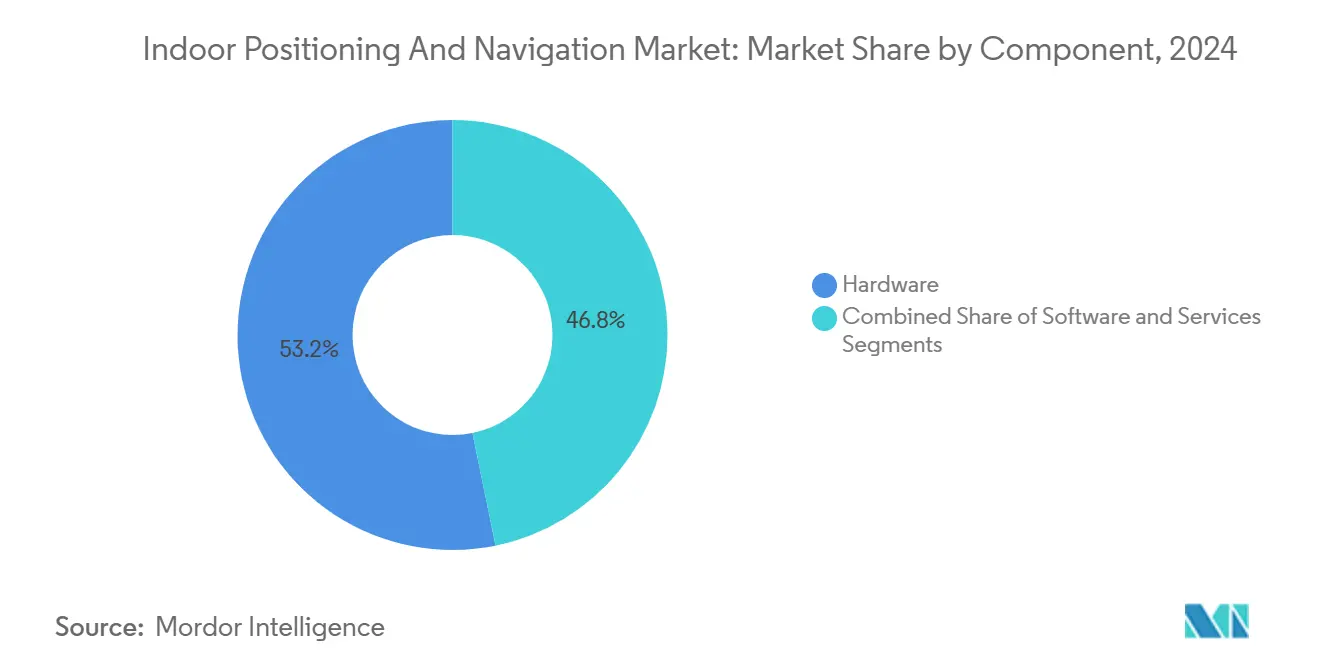
- By component, hardware led with 53.21% revenue share of the indoor positioning and navigation market in 2024; services, however, are forecast to expand at a 35.12% CAGR through 2030.
- By technology, Bluetooth Low Energy captured 33.76% of the 2024 indoor positioning and navigation market share, while Ultra-Wideband is advancing at a 34.33% CAGR through 2030.
- By application, asset and personnel tracking commanded 39.86% of the 2024 indoor positioning and navigation market size, whereas proximity marketing and in-store analytics are projected to grow at a 34.47% CAGR to 2030.
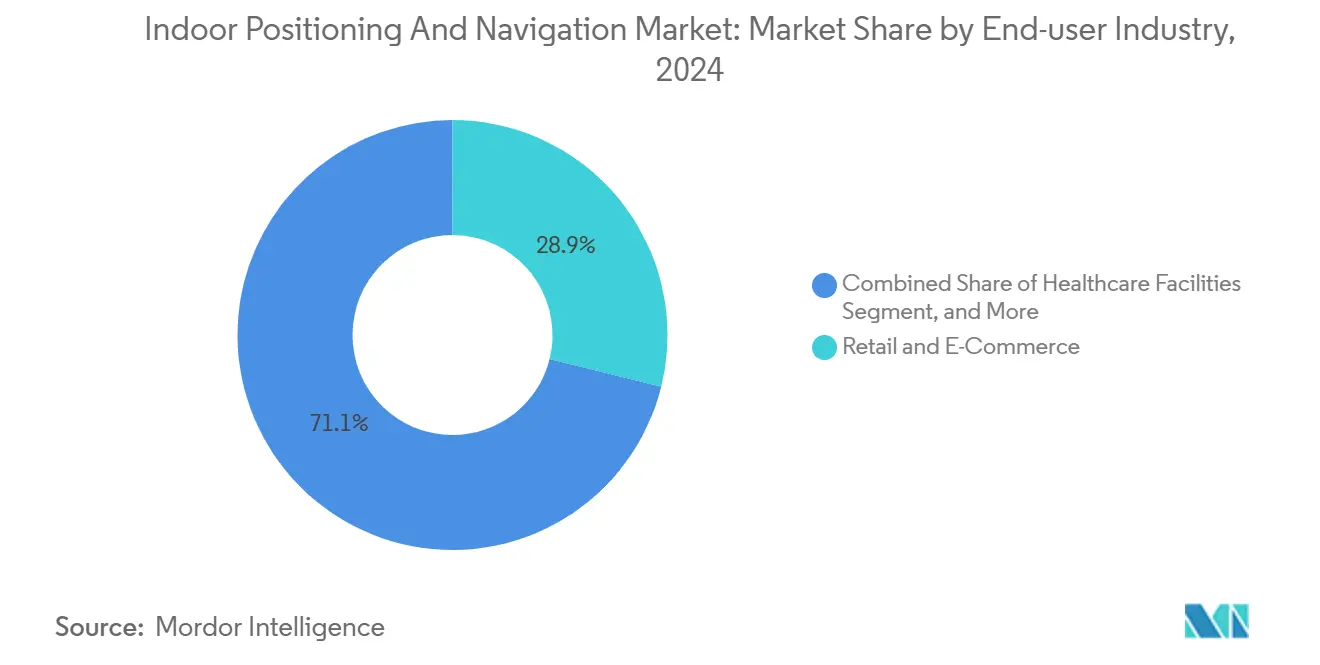
- By end-user industry, retail and e-commerce held 28.86% of the 2024 indoor positioning and navigation market; smart buildings and corporate campuses exhibit the highest projected CAGR at 34.49%.
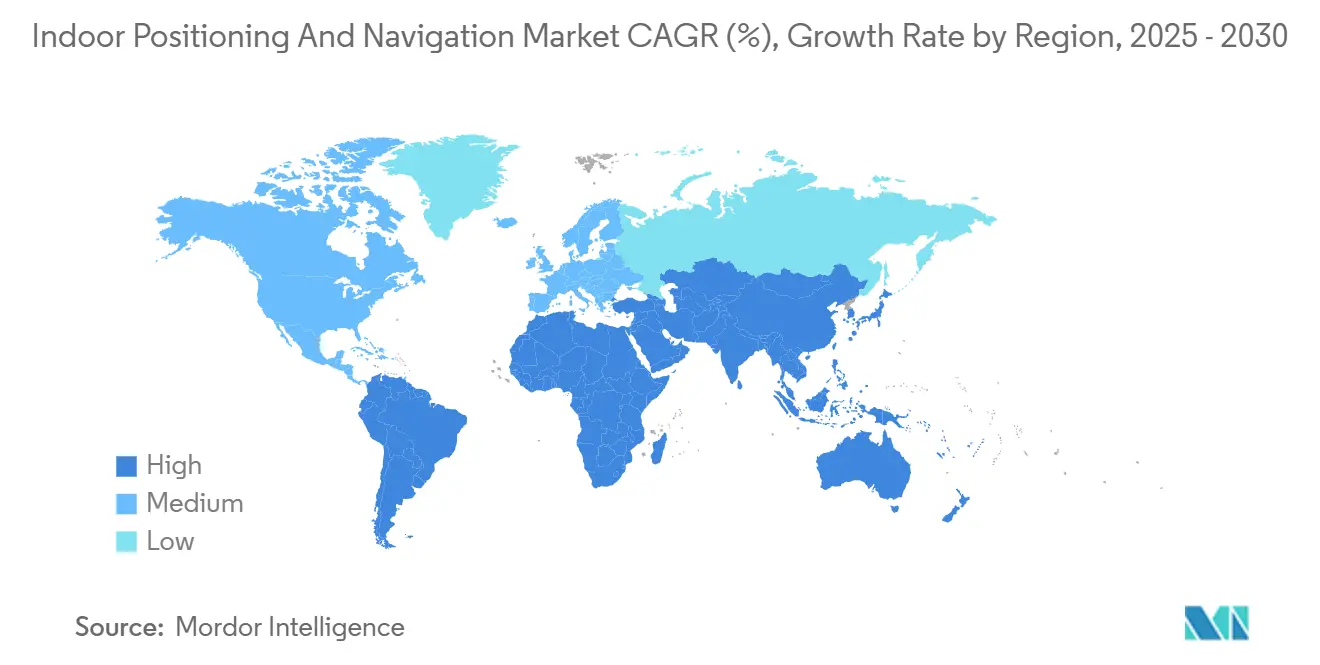
- By geography, North America accounted for 37.58% of the 2024 value; Asia-Pacific is the fastest-growing geography with a 34.89% CAGR forecast to 2030.
Global Indoor Positioning And Navigation Market Trends and Insights
Drivers Impact Analysis*
| Driver | (~) % Impact on CAGR Forecast | Geographic Relevance | Impact Timeline |
|---|---|---|---|
| Proliferation of BLE-/UWB-enabled smartphones | +8.2% | Global, early gains in North America and Asia-Pacific | Short term (≤ 2 years) |
| Rising demand for in-store analytics and LBS in retail chains | +6.8% | North America and EU expanding to Asia-Pacific | Medium term (2-4 years) |
| Surge in IoT-driven asset tracking across logistics and manufacturing | +7.1% | Global, concentrated in industrial hubs | Medium term (2-4 years) |
| Roll-out of IEEE 802.11az (Wi-Fi 7) enabling cm-level accuracy | +5.9% | Global, led by developed markets | Long term (≥ 4 years) |
| Integration of indoor data with digital-twin platforms for smart buildings | +4.3% | North America and EU, emerging in Asia-Pacific | Long term (≥ 4 years) |
| Emergency-services Z-axis mandates (e.g., FCC) accelerating deployments | +6.1% | North America, expanding to other regions | Short term (≤ 2 years) |
| Source: Mordor Intelligence | |||
Proliferation of BLE-/UWB-enabled smartphones drives consumer adoption.
Flagship handsets now ship with integrated BLE 5.4 and UWB radios, making high-precision ranging a default capability rather than a premium add-on. Samsung’s Galaxy S24+ achieved FiRa Core 3.0 certification in March 2025, showcasing Dynamic STS, CCC Device functionality, and multiple Two-Way Ranging modes that deliver centimeter-level indoor accuracy. [1]FiRa Consortium, “Galaxy S24+ Certification,” FIRACONSORTIUM.ORG Such certification removes interoperability uncertainty and reduces enterprise risk. As consumers carry phones that double as positioning sensors, retailers, airports, and hospitals can deploy lighter infrastructure footprints while still accessing rich location data. The resulting network effects lower per-site costs and improve ROI calculations, especially in customer-facing venues where smartphone penetration exceeds 90%. Apple’s parallel expansion of UWB chips across iPhone and Apple Watch models reinforces a multi-platform baseline and accelerates application development. Enterprises, therefore, perceive smartphone ubiquity as a strategic inflection point that justifies investment in complementary anchors, analytics tools, and managed services.
Rising demand for in-store analytics and location-based services
Retail chains aim to translate foot-traffic insight into higher conversion rates. BLE beacons combined with real-time analytics can trigger near-field promotions when shoppers linger next to target categories, lifting redemption rates between 15-25% relative to standard push campaigns. Grocery operators, for example, monitor dwell time in produce aisles to refine end-cap placements and adjust staffing schedules. Computer-vision systems fused with positioning data correlate movement heat maps to SKU-level sales trends, producing actionable guidance on planogram effectiveness. GDPR rules oblige European retailers to implement consent flows and anonymization layers, spurring interest in privacy-preserving localization that aggregates behavior without tracking individuals. As these deployments mature, analytics modules increasingly integrate with loyalty apps, elevating personalization while maintaining compliance.
Surge in IoT-driven asset tracking across logistics and manufacturing
Industrial facilities view real-time asset visibility as essential to Industry 4.0 agendas. UWB-based networks inside warehouses have cut average picking times by 20-30% owing to sub-meter location data for pallets, forklifts, and operators. Automotive lines use UWB tags on work-in-progress vehicles to synchronize just-in-time part delivery, reducing buffer inventory by 40% and freeing up floor space for value-adding activities. Combining positioning feeds with warehouse-management and manufacturing-execution systems enables dynamic routing that adjusts to congestion and equipment status, yielding faster cycle times and labor productivity gains. Adoption is extending to hazardous environments-mines, chemical plants-where tags provide automated geofencing and incident alerts that enhance worker safety and regulatory compliance. [2]Department of Homeland Security, “Contracts to Enhance First Responder Indoor Location,” DHS.GOV
Roll-out of IEEE 802.11az (Wi-Fi 7), enabling centimeter-level accuracy
Wi-Fi 7 Fine Timing Measurement introduces time-of-flight calculations with sub-nanosecond precision, narrowing positioning error to 10-30 cm compared with the one-to-three-meter range of prior Wi-Fi generations. Enterprises can thus piggyback indoor positioning on their WLAN upgrades rather than install new radio layers, easing budget pressures. In hospitals, Wi-Fi-based precision locating of infusion pumps and wheelchairs unlocks workflow optimization without disrupting existing patient-data networks. Office campuses use the same access points for both connectivity and occupancy analytics, enabling space-utilization dashboards that inform leasing decisions. Because IEEE 802.11az remains backward-compatible, organizations can phase in the technology over time, preserving sunk costs and minimizing operational risk.
Restraints Impact Analysis*
| Restraint | (~) % Impact on CAGR Forecast | Geographic Relevance | Impact Timeline |
|---|---|---|---|
| Lack of universal interoperability standards | -4.7% | Global, impacting multi-vendor deployments | Medium term (2-4 years) |
| High upfront infrastructure and calibration costs | -5.2% | Global, stronger in price-sensitive markets | Short term (≤ 2 years) |
| Growing privacy and data-sovereignty concerns | -3.8% | EU and privacy-conscious regions | Long term (≥ 4 years) |
| Multipath accuracy losses in dense urban high-rises | -2.9% | Urban centers worldwide | Medium term (2-4 years) |
| Source: Mordor Intelligence | |||
High upfront infrastructure and calibration costs
A full-coverage UWB deployment across 100,000 ft² can exceed USD 50,000, factoring in anchors, cables, and initial site calibration. Ongoing maintenance often adds 15-20% yearly to sustain accuracy as floor plans change and RF conditions evolve. Skilled RF technicians remain scarce outside mature North American and European markets, prolonging project timelines and elevating labor costs. Healthcare rollouts seeking FDA-grade precision may double anchor density, compounding capital requirements and sometimes prompting partial-scope deployments that compromise intended ROI. These economic barriers slow adoption among small and medium enterprises that lack the scale to amortize the investment.
Growing privacy and data-sovereignty concerns
GDPR enforcement has spotlighted risks linked to centimeter-level indoor tracking. European regulators have levied fines above EUR 10 million (USD 11.3 million) where consent mechanisms and anonymization safeguards were absent. Labor unions oppose blanket employee monitoring, arguing that real-time location exposes workers to disproportionate surveillance. Multi-tenant buildings compound the challenge: a single anchor network may incidentally track unrelated occupants, raising cross-organizational liability and necessitating granular access controls. Consequently, procurement teams prioritize on-premises analytics and legal reviews, extending sales cycles and inflating solution costs. [3]The Bridge, “Guide Robotics Raises JPY 100M,” THEBRIDGE.JP
*Our forecasts treat driver/restraint impacts as directional, not additive. The impact forecasts reflect baseline growth, mix effects, and variable interactions.
Segment Analysis
By Component: Hardware Dominance Faces Services Disruption
Hardware accounted for 53.21% of 2024 revenue as enterprises procured anchors, beacons, tags, and specialized chips essential to achieve sub-meter accuracy. The indoor positioning and navigation market size for hardware is poised to expand steadily, yet its share will erode as managed-service contracts gain prominence. Falling component prices driven by higher chip yields from NXP and Qorvo have widened the addressable base, but calibration complexity still creates barriers best solved through specialized partners.
Services, projected to post a 35.12% CAGR to 2030, reflect the growing realization that technical excellence hinges more on deployment expertise than on bill-of-materials cost. System integrators, facilities-management firms, and telcos now bundle design, installation, and life-cycle optimization into multiyear agreements, converting one-time capex into annuity-style opex. Software sits in the middle ground, enabling cloud-native dashboards and analytics, but competition from open-source frameworks caps pricing power.


By Technology: UWB Challenges BLE Market Leadership
BLE claimed 33.76% of 2024 revenue thanks to near-universal smartphone support and low infrastructure requirements. In retail settings, BLE beacons suffice for aisle-level proximity engagement, and their cost profile appeals to budget-sensitive owners. Ultra-Wideband, however, is growing faster, supported by Apple’s and Samsung’s ecosystem moves. The indoor positioning and navigation market share for UWB will rise as more FiRa-certified devices reach consumers and as industrial buyers demand centimeter-level precision for automation.
IEEE 802.11az positions Wi-Fi as a third pillar, leveraging existing AP grids to trim incremental spend. RFID, magnetic, and inertial methods persist in specialized niches—underground mines, steel mills—where RF transparency is problematic or cost thresholds override accuracy needs. Cross-technology fusion is emerging: hybrid engines weigh BLE, UWB, and Wi-Fi observations in real time, choosing the best signal to maintain continuity as users move across coverage zones.
By Application: Asset Tracking Leads While Analytics Accelerates
Asset and personnel tracking generated 39.86% of the 2024 value, anchored by quick, quantifiable productivity wins in warehouses, factories, and hospitals. The indoor positioning and navigation market size for this segment will keep expanding, but its relative dominance will moderate as data-rich consumer applications scale. Proximity marketing and in-store analytics, advancing at a 34.47% CAGR, rely on smartphones and BLE beacons to personalize offers, study footfall patterns, and optimize planograms.
Wayfinding retains importance for airports, malls, and healthcare campuses where visitor satisfaction metrics correlate with smooth navigation. Emergency-services applications gain tailwinds from FCC mandates that require sub-3-m vertical accuracy for 80% of calls. Meanwhile, AR/VR venues test indoor positioning to synchronize digital overlays, but device costs and privacy worries restrain near-term volumes.
By End-user Industry: Smart Buildings Emerge as Growth Leader
Retail and e-commerce held 28.86% of 2024 spending, buoyed by both customer-facing and inventory-management use cases. Yet smart buildings and corporate campuses are forecast for the fastest 34.49% CAGR because digital-twin platforms feed on real-time location to optimize HVAC loads, conference-room scheduling, and safety compliance. The indoor positioning and navigation industry here finds synergy with building-automation vendors and energy-performance contracts.
Healthcare adoption is accelerating as hospitals aim to cut equipment search times and improve infection-control procedures. Manufacturing plant managers embed location data into MES dashboards for WIP visibility and predictive maintenance schedules. Transportation hubs-airports, seaports-employ the technology for passenger routing, baggage handling, and ground-support fleet management. Each vertical values different KPIs, pushing solution providers to craft domain-specific modules.
Geography Analysis
North America led with 37.58% of 2024 revenue, anchored by the United States, where FCC E911 rules stimulated early deployments across public-safety ecosystems. Hospitals, retailers, and universities in the U.S. expanded pilot projects into campus-wide rollouts, validated by reference case studies and mature integrator networks. Canada followed suit, concentrating on healthcare asset tracking and smart-office retrofits. Mexico, while smaller in absolute terms, is catching up as maquiladora zones digitalize logistics workflows to meet multinational supply-chain standards.
Asia-Pacific is the growth engine, forecast at 34.89% CAGR. China’s industrial parks and smart-city projects integrate UWB anchors into 5G and IoT frameworks, enabling digital twins that monitor machinery, energy consumption, and workforce safety in real time. Japan and South Korea invest heavily in standards development and early adoption; high technology literacy accelerates corporate buy-in. India shows long-run upside as warehousing demand rises with e-commerce expansion, though cost sensitivity necessitates hybrid BLE-Wi-Fi architectures. Venture funding-such as Guide Robotics’ JPY 100 million (USD 67 million) raise for visual SLAM solutions-signals momentum across start-up ecosystems.
Europe grows steadily despite stricter privacy mandates. Germany and the United Kingdom pilot industrial and retail analytics programs, while France emphasizes passenger-experience upgrades at transportation hubs. GDPR elevates compliance costs by 15-25%, yet stimulates local innovation in edge processing and anonymized analytics. Vendors able to demonstrate privacy-by-design architectures gain a competitive edge both within and beyond the region.

Competitive Landscape
The market remains fragmented; no single supplier commands more than a low-double-digit share. Ecosystem players fall into three overlapping tiers. First, platform giants-Apple, Cisco, Huawei-embed location capabilities into smartphones, WLAN access points, and network-management suites, monetizing through adjacent services. Second, specialist vendors-Quuppa, Humatics, Pozyx-focus on high-precision verticals such as manufacturing or healthcare, differentiating via proprietary algorithms and ruggedized hardware. Third, integrators and managed-service providers bundle components into turnkey offerings, easing deployment for resource-constrained enterprises.
Competition increasingly pivots to software and analytics as hardware commoditizes. Meta’s UWB patent portfolio underscores a strategic bet on spatial computing and AR/VR use cases. FiRa certification narrows room for proprietary radio stack advantages, pushing vendors to compete on time-to-deploy, calibration automation, and total cost of ownership. Strategic alliances are forming: Wi-Fi chipset makers partner with UWB specialists to deliver combo modules; facilities-management firms acquire small integrators to secure domain expertise. Consolidation is likely, as scale economies in cloud analytics and support services outweigh stand-alone niche positioning.
Indoor Positioning And Navigation Industry Leaders
Apple Inc.
Huawei Technologies Co., Ltd.
Zebra Technologies Corporation
Cisco Systems, Inc.
Quuppa Oy
- *Disclaimer: Major Players sorted in no particular order

Recent Industry Developments
- March 2025: Samsung Galaxy S24+ achieved FiRa Core 3.0 certification, validating Dynamic STS and advanced ranging modes for centimeter-level accuracy
- January 2025: FiRa Consortium introduced Certification Release 3.0, adding feature-specific validation tracks for UWB devices
- November 2024: Wirepas closed a USD 22 million Series D to expand mesh IoT connectivity that complements indoor positioning for industrial sites
- October 2024: DHS awarded POINTER contracts to refine first-responder UWB tracking, endorsing the technology for critical emergency operations


Global Indoor Positioning And Navigation Market Report Scope
| Hardware |
| Software |
| Services |
| Bluetooth Low-Energy (BLE) |
| Ultra-Wideband (UWB) |
| Wi-Fi (RSSI, RTT, 802.11az) |
| Radio-Frequency Identification (RFID) |
| Magnetic and Inertial |
| Other Technology |
| Asset and Personnel Tracking |
| Wayfinding and Indoor Navigation |
| Proximity Marketing and In-store Analytics |
| Emergency Response and First-Responder Tracking |
| Gaming, AR/VR and Visitor Engagement |
| Retail and E-Commerce |
| Healthcare Facilities |
| Manufacturing and Warehousing |
| Transportation and Logistics Hubs |
| Smart Buildings and Corporate Campuses |
| Other End-user Industry |
| North America | United States | |
| Canada | ||
| Mexico | ||
| Europe | Germany | |
| United Kingdom | ||
| France | ||
| Russia | ||
| Rest of Europe | ||
| Asia-Pacific | China | |
| Japan | ||
| India | ||
| South Korea | ||
| Australia | ||
| Rest of Asia-Pacific | ||
| Middle East and Africa | Middle East | Saudi Arabia |
| United Arab Emirates | ||
| Rest of Middle East | ||
| Africa | South Africa | |
| Egypt | ||
| Rest of Africa | ||
| South America | Brazil | |
| Argentina | ||
| Rest of South America | ||
| By Component | Hardware | ||
| Software | |||
| Services | |||
| By Technology | Bluetooth Low-Energy (BLE) | ||
| Ultra-Wideband (UWB) | |||
| Wi-Fi (RSSI, RTT, 802.11az) | |||
| Radio-Frequency Identification (RFID) | |||
| Magnetic and Inertial | |||
| Other Technology | |||
| By Application | Asset and Personnel Tracking | ||
| Wayfinding and Indoor Navigation | |||
| Proximity Marketing and In-store Analytics | |||
| Emergency Response and First-Responder Tracking | |||
| Gaming, AR/VR and Visitor Engagement | |||
| By End-user Industry | Retail and E-Commerce | ||
| Healthcare Facilities | |||
| Manufacturing and Warehousing | |||
| Transportation and Logistics Hubs | |||
| Smart Buildings and Corporate Campuses | |||
| Other End-user Industry | |||
| By Geography | North America | United States | |
| Canada | |||
| Mexico | |||
| Europe | Germany | ||
| United Kingdom | |||
| France | |||
| Russia | |||
| Rest of Europe | |||
| Asia-Pacific | China | ||
| Japan | |||
| India | |||
| South Korea | |||
| Australia | |||
| Rest of Asia-Pacific | |||
| Middle East and Africa | Middle East | Saudi Arabia | |
| United Arab Emirates | |||
| Rest of Middle East | |||
| Africa | South Africa | ||
| Egypt | |||
| Rest of Africa | |||
| South America | Brazil | ||
| Argentina | |||
| Rest of South America | |||


Key Questions Answered in the Report
How large will indoor positioning deployments be by 2030?
The indoor positioning and navigation market is forecast to reach USD 136.29 billion by 2030, expanding at a 34.24% CAGR from its 2025 base of USD 31.26 billion.
Which technology is gaining ground fastest?
Ultra-Wideband is growing at a 34.33% CAGR as major smartphone makers embed UWB chips, driving enterprise demand for centimeter-level accuracy.
What drives adoption in smart buildings?
Integration with digital-twin platforms enables energy optimization, space-use analytics, and safety monitoring, making smart buildings the fastest-growing end-user segment at a 34.49% CAGR.
How do emergency regulations influence the market?
FCC E911 rules mandate sub-3-m vertical accuracy for 80% of indoor calls, pushing U.S. enterprises to accelerate deployments and shaping global best practices.
What is the key cost barrier for SMBs?
Upfront infrastructure and calibration can exceed USD 50,000 for mid-size facilities, with annual maintenance adding 15-20%, making managed-service models appealing.
Which region shows highest growth potential?
Asia-Pacific is projected to expand at 34.89% CAGR, led by China’s smart-city investments and manufacturing automation programs.
Page last updated on:


