Mobile Mapping System Market Size and Share
Market Overview
| Study Period | 2020 - 2031 |
|---|---|
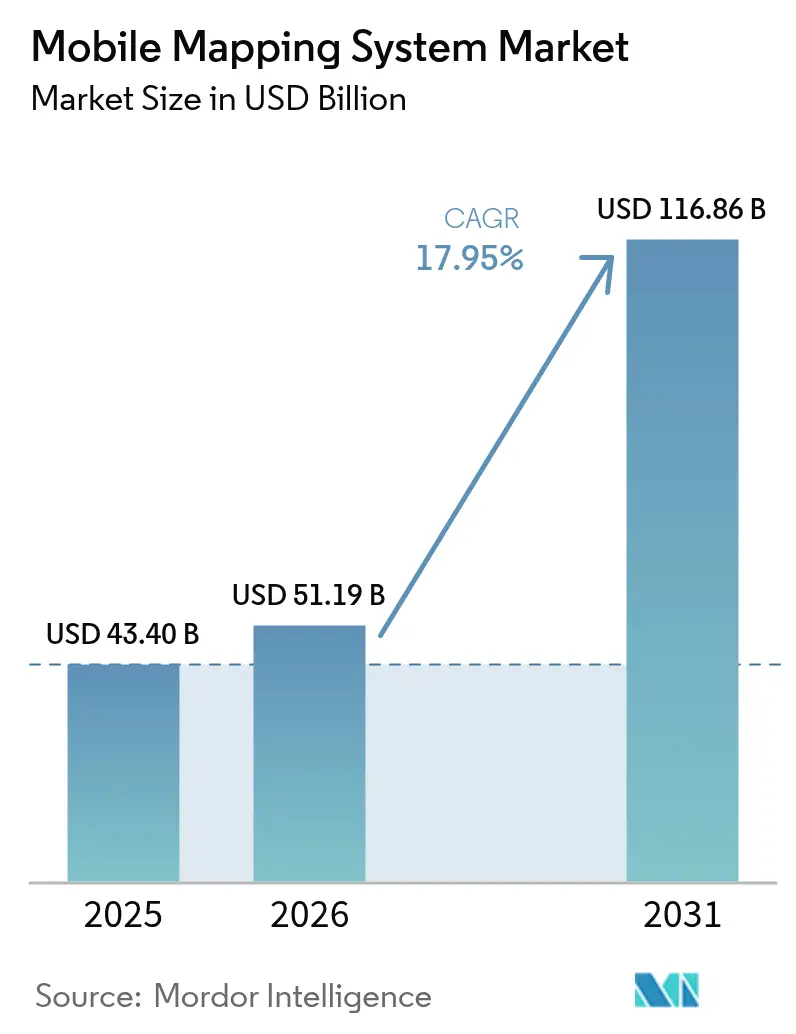
| Market Size (2026) | USD 51.19 Billion |
| Market Size (2031) | USD 116.86 Billion |
| Growth Rate (2026 - 2031) | 17.95% CAGR |
| Fastest Growing Market | Asia Pacific |
| Largest Market | North America |
| Market Concentration | Medium |
Major Players *Disclaimer: Major Players sorted in no particular order Image © Mordor Intelligence. Reuse requires attribution under CC BY 4.0. | |
Mobile Mapping System Market Analysis by Mordor Intelligence
The mobile mapping system market size was valued at USD 43.4 billion in 2025 and estimated to grow from USD 51.19 billion in 2026 to reach USD 116.86 billion by 2031, at a CAGR of 17.95% during the forecast period (2026-2031). Enterprise-grade feature extraction powered by artificial intelligence and steadily falling solid-state LiDAR prices continued to reshape acquisition economics, improving margins for service providers and end users. Government digital-twin mandates, the rise of vehicle-agnostic sensor payloads, and new subscription business models expanded adoption in infrastructure, mining, and emergency management. Meanwhile, vendors increased software integrations that shorten data-to-decision cycles, broadening the mobile mapping system market addressable base and intensifying competition around value-added analytics.
Key Report Takeaways
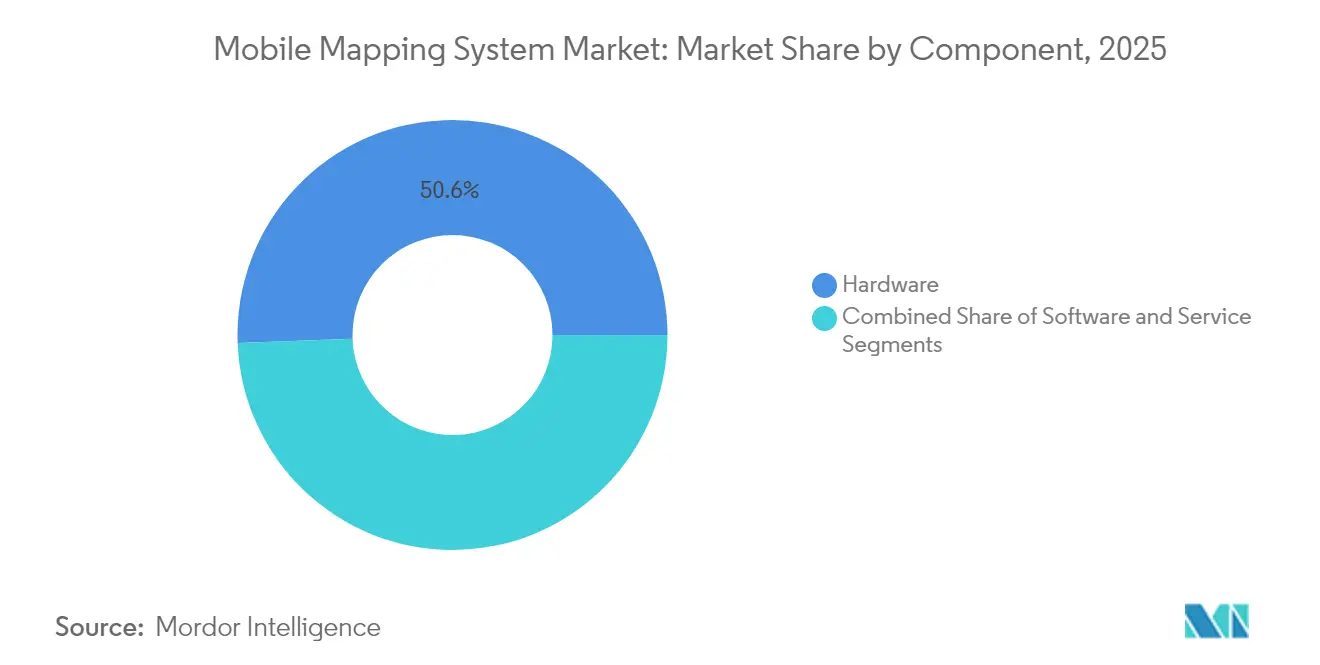
- By component, hardware led with 50.60% of the mobile mapping system market share in 2025; services are forecast to expand at a 20.10% CAGR to 2031.
- By mounting type, vehicle-mounted platforms held 61.30% revenue share in 2025, while drone systems are advancing at a 21.10% CAGR through 2031.
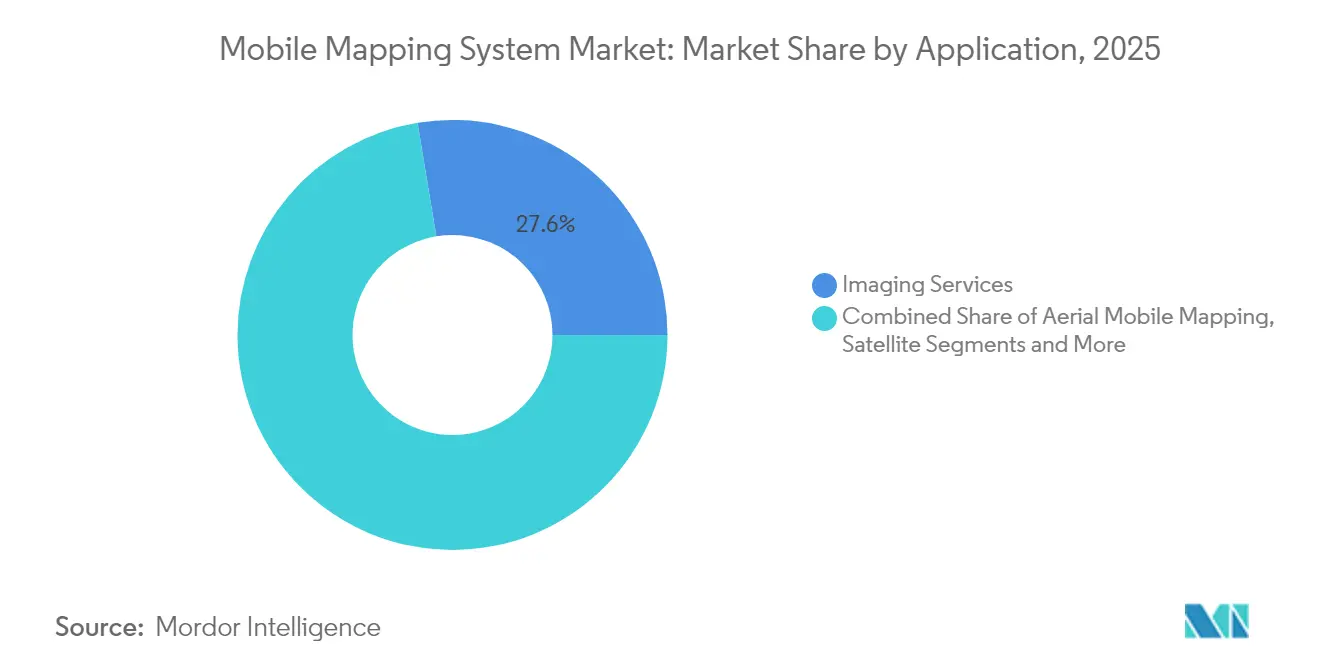
- By application, imaging services commanded a 27.60% share of the mobile mapping system market size in 2025, and emergency-response planning is growing at a 20.60% CAGR.
- By end-user vertical, government agencies accounted for a 34.60% share in 2025; mining is projected to expand at a 19.20% CAGR between 2026-2031.
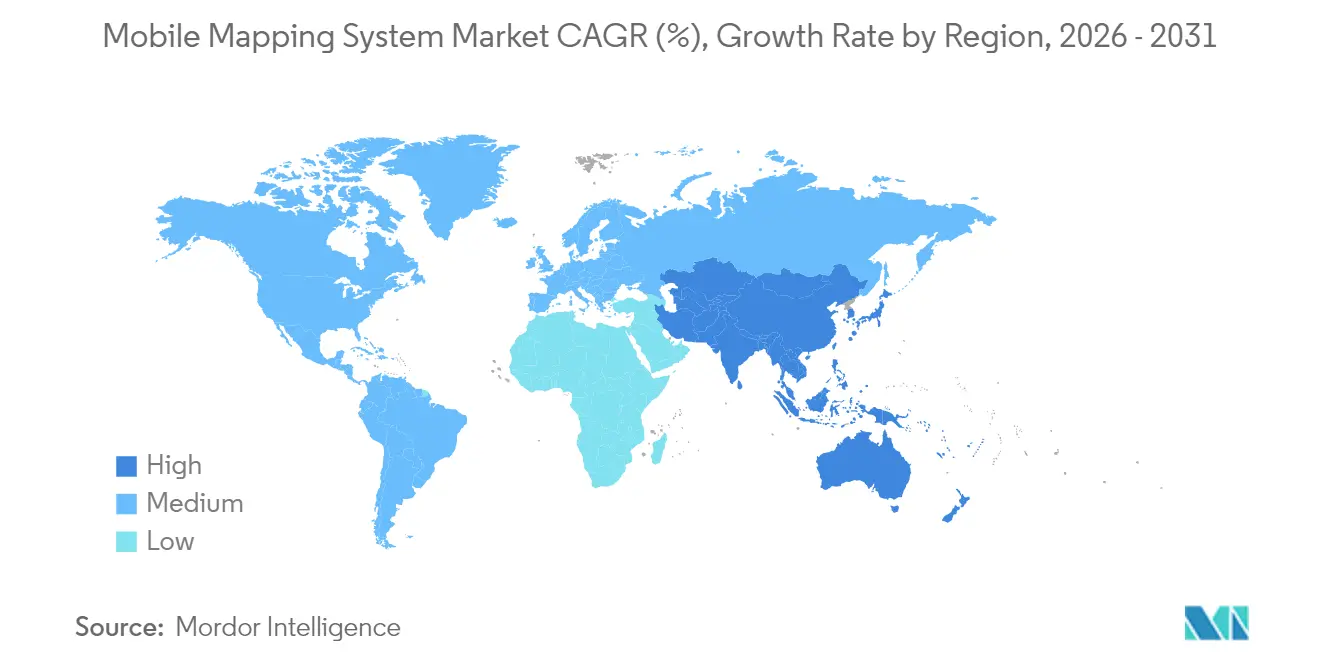
- By geography, North America led with 37.40% share in 2025; Asia-Pacific is forecast to grow at a 18.90% CAGR.
Note: Market size and forecast figures in this report are generated using Mordor Intelligence’s proprietary estimation framework, updated with the latest available data and insights as of 2026.
Global Mobile Mapping System Market Trends and Insights
Drivers Impact Analysis*
| Driver | (~) % Impact on CAGR Forecast | Geographic Relevance | Impact Timeline |
|---|---|---|---|
| Integration with all kinds of vehicles | +4.2% | Global; early adoption in North America, Europe | Medium term (2-4 years) |
| Government digital-twin mandates | +3.8% | North America, Europe, advanced APAC | Long term (≥ 4 years) |
| Declining solid-state LiDAR costs | +3.5% | Global | Short term (≤ 2 years) |
| AI-powered automatic feature extraction | +3.2% | North America, Europe, advanced APAC | Medium term (2-4 years) |
| Autonomous robots and drone adoption | +2.1% | Global | Medium term (2-4 years) |
| Defense ISR modernization budgets | +1.0% | North America, Europe, Middle East | Long term (≥ 4 years) |
| Source: Mordor Intelligence | |||


Integration with All Kinds of Vehicles
The ability to mount sensors on railcars, trucks, autonomous shuttles, and even boats widened the mobile mapping system market scope. Deutsche Bahn certified Trimble’s MX9 platform for 100 km/h rail surveys in 2022, validating non-stop asset capture for European rail corridors.[1]Trimble Inc., “Trimble MX9 Mobile Mapping System Certified by Deutsche Bahn,” geospatial.trimble.com Transportation agencies that previously scheduled weekend closures for manual LiDAR scans now deploy vehicle-independent payloads during regular service, accelerating inspection cycles and reducing safety risks. Similar integrations on autonomous road sweepers enabled night-time curb-level mapping for urban digital-twin programs in Germany and Canada, demonstrating how cross-platform compatibility has become a revenue driver for equipment makers.
Government Digital-Twin Mandates
National programs such as the United Kingdom’s National Digital Twin initiative established compulsory data standards that require centimeter-grade 3D inputs. Municipalities responded by commissioning high-density mobile LiDAR of roadways, bridges, and public buildings to populate city-scale twins, spawning multi-year service contracts and stimulating procurement of modern sensor rigs. Uppsala’s biodiversity corridor planning, which combined LiDAR with GIS analytics, showed how regulatory push translated into immediate demand for dynamic, update-ready spatial datasets. The mobile mapping system market, therefore, benefited from predictable public-sector funding streams tied to long-range infrastructure resilience goals.
Declining Solid-State LiDAR Costs
Solid-state architectures eliminated mechanical components, trimming production expenses and raising durability. Modules based on Opsys Tech’s scanning micro-flash design were reported below USD 200 per unit in 2024 while sustaining 200-meter detection. Fleet operators in mining replaced rotating LiDARs with ruggedized solid-state units, reducing annual maintenance budgets by up to 40% and unlocking multi-sensor deployments on haul trucks. The price trajectory encouraged mid-tier survey firms in Southeast Asia to upgrade legacy rigs, enlarging the active equipment base and lifting annual shipments across the mobile mapping system market.
AI-Powered Automatic Feature Extraction
Trimble’s TBC 2024.10 release integrated trainable neural-network models that located lane markings and pavement defects without manual point cloud editing. Early adopters in state transportation departments reported post-processing time cuts of 60%, allowing field crews to redeploy within 24 hours instead of weeks. Parallel advances from Mach9 and Leica reduced manual edge drafting in utility corridor mapping, broadening access for organizations with limited geomatics staff. Faster turnaround shortened project payback periods, thereby expanding total addressable spend for the mobile mapping system market.
Restraints Impact Analysis*
| Restraint | (~) % Impact on CAGR Forecast | Geographic Relevance | Impact Timeline |
|---|---|---|---|
| High cost of system acquisition and deployment | -2.5% | Global; higher impact in emerging markets | Short term (≤ 2 years) |
| Skilled-operator shortage | -1.8% | Global; acute impact in fast-growing regions | Medium term (2-4 years) |
| Data-privacy and surveillance regulations | -1.2% | Europe, North America, APAC | Long term (≥ 4 years) |
| Construction sector cap-ex cyclicality | -0.8% | Global | Medium term (2-4 years) |
| Source: Mordor Intelligence | |||
High Cost of System Acquisition and Deployment
Top-tier mobile mapping packages still commanded USD 250,000-750,000, a threshold that remained prohibitive for small civil-engineering firms. A Malaysian road-design study in 2022 highlighted cap-ex as the main reason LiDAR bidding was deferred despite clear technical gains.[2]Fazilah Antah et al., “Factors Influencing the Use of Geospatial Technology with LiDAR,” mdpi.com Financing hurdles were sharper in Latin America and Africa, where local banks rarely offered asset-backed leasing for specialized geospatial hardware. Vendors responded with “mapping-as-a-service” subscriptions, yet up-front investment persisted as the most significant drag on addressable demand within the mobile mapping system market.
Skilled-Operator Shortage
Global surveys by geomatics associations in 2025 reported that firms struggled to hire technicians proficient in multisensor calibration, trajectory processing, and AI-based classification. Training a competent operator frequently required 18-24 months, causing scheduling bottlenecks even when equipment was available. Leica’s Cyclone 3DR AI classification features alleviated some pressure by automating routine segmentation tasks, yet labor scarcity continued to cap project throughput, particularly in booming Asia-Pacific metros where the mobile mapping system market was expanding fastest.
*Our forecasts treat driver/restraint impacts as directional, not additive. The impact forecasts reflect baseline growth, mix effects, and variable interactions.
Segment Analysis
By Component: Hardware Dominance Challenged by Services Growth
The hardware segment accounted for 50.60% of the mobile mapping system market share in 2025, underscoring its past reliance on capital-intensive sensor suites. Premium vehicle rigs paired 3.6 MHz laser scanners with 72 MP panoramic cameras, while handheld units such as Leica’s BLK2GO blended LiDAR with visual SLAM in one-kilogram packages. However, shrinking sensor footprints and solid-state innovations compressed unit costs, allowing more frequent refresh cycles and fostering modular upgrades.
The services segment achieved the fastest 20.10% CAGR through 2031 as organizations outsourced complex data processing. AI-enabled cloud platforms converted raw point clouds into CAD-ready deliverables, lowering internal overheads. This model shifted profit pools from hardware margins toward recurring analytics revenue, accelerating a structural transition in the mobile mapping system market. The mobile mapping system market size attached to services is projected to widen as pay-per-use offerings broaden access in emerging economies.


By Mounting Type: Vehicle Platforms Maintain Lead as Drones Accelerate
Vehicle-mounted platforms controlled 61.30% of the mobile mapping system market in 2025, favored for highway and rail corridors where uninterrupted acquisition at posted speeds maximized productivity. Dual-head scanners on SUVs captured both pavement distress and roadside assets during a single pass, consolidating budgets across transportation agencies.
Drone-based payloads, expanding at 21.10% CAGR, opened vertical mines, cliff faces, and disaster zones to rapid LiDAR coverage. Lighter solid-state sensors extended flight endurance while onboard AI filtered vegetation in real time, reducing downstream workload. Railway-specific trolleys and backpack units addressed niche needs yet collectively contributed to a diversified equipment mix underpinning future mobile mapping system market size momentum.
By Application: Imaging Services Lead While Emergency Response Accelerates
Imaging services contributed 27.60% of 2025 revenue as orthophotos and 360-degree panoramas complemented LiDAR-derived meshes for asset inventories. Utilities adopted automated pole detection from imagery to defer field inspections, demonstrating the ongoing relevance of high-resolution photos within an increasingly 3D-oriented mobile mapping system market.
Emergency-response planning, growing at 20.60% CAGR, leveraged near-real-time indoor GIS and drone LiDAR to support flood, wildfire, and earthquake scenarios. Public-safety agencies integrated live sensor feeds into command centers, highlighting the transition from episodic mapping to continuous situational awareness. The rising frequency of climate-related events is therefore anchoring a defensible growth corridor for the mobile mapping system market.
By End-User Verticals: Government Leads While Mining Shows Highest Growth
Government entities held 34.60% revenue in 2025, using mobile platforms for road asset management, cadastral updates, and smart-city analytics. Digital-twin legislation obligated municipalities to refresh 3D baselines annually, locking in multi-year procurement.
Mining registered a 19.20% CAGR as operators adopted vehicle and drone LiDAR for blast optimization and tailings-dam monitoring. Sub-centimeter terrain models replaced manual prism surveys, lowering staff exposure in hazardous pits. Oil-and-gas, defense, and construction round out an increasingly diversified clientele, each amplifying overall mobile mapping system market size through specialized workflows.
Geography Analysis
North America accounted for 37.40% of the mobile mapping system market in 2025. Federal infrastructure funding and strong defense ISR budgets nurtured steady sensor demand. Pilot programs demonstrated a USD 2 return for every USD 1 invested in statewide mobile LiDAR, reinforcing budget allocations. Ecosystem maturity, abundant skilled labor, and aggressive R and D by domestic vendors sustained the region’s leadership.
Asia-Pacific recorded the fastest 18.90% CAGR, driven by smart-city spending in China and India, Japan’s resilience planning, and South Korea’s autonomous-vehicle mapping corridors. Nearly half of global traffic on popular equipment-comparison portals originated from Asia-Pacific users in 2025, signaling high engagement that translated into orders for both drone and vehicle systems. Lower-cost sensors broadened entry-level uptake among provincial agencies, expanding the mobile mapping system market footprint.
Europe, the Middle East, Africa, and South America presented mixed demand profiles. European mandates around sustainability spurred environmental monitoring projects such as truck-traffic lidar in German cities. The Middle East prioritized pipeline and megacity initiatives, while Brazilian and Chilean mines underpinned South American sales. Africa remained nascent but showed momentum in South African infrastructure surveys. Across all regions, integration of mobile mapping with cloud, IoT, and AI underpinned cross-vertical use cases, lifting the global mobile mapping system market momentum.

Competitive Landscape
The mobile mapping system market featured a moderately fragmented field of incumbents and AI-centric newcomers. Hexagon’s Leica division, Trimble, and RIEGL retained strong brand equity by offering integrated hardware-software stacks. Trimble launched the MX90 in February 2025, combining advanced GNSS-INS with highway-speed image capture to strengthen its corridor-mapping franchise. Leica responded in May 2025 with the Pegasus TRK300, targeting mid-range buyers seeking modular payloads.[4]Leica Geosystems, “New Leica Pegasus TRK300 Opens Up Advanced Mobile Mapping,” leica-geosystems.com
Software-led challengers focused on automated feature extraction and cloud collaboration. Mach9’s Digital Surveyor promised 30× faster map production, appealing to service bureaus needing rapid throughput. Subscription-based analytics from SISL and others shifted revenue away from one-time equipment sales toward recurring processing fees, intensifying competitive pressure on hardware margins.
Strategic acquisitions accelerated portfolio expansion. Faro’s earlier purchase of GeoSLAM added indoor mobile LiDAR to its offering, while WSP equipped its survey fleet with RIEGL VMX 2HA systems to augment digital-twin consulting services. Going forward, players that unite rugged sensors, AI workflows, and sector-specific expertise are positioned to capture disproportionate gains within the mobile mapping system market.
Mobile Mapping System Industry Leaders
Trimble Inc.
Leica Geosystems AG (Hexagon AB)
Topcon Corporation
GeoSLAM Ltd.
Teledyne Optech Inc.
- *Disclaimer: Major Players sorted in no particular order

Recent Industry Developments
- May 2025: Leica Geosystems introduced the Pegasus TRK300 adaptable mobile mapping system, adding a dual-head multi-beam scanner with a 300-meter range for smart-city and infrastructure projects.
- May 2025: Pix4D added Topcon CR-H1 GNSS support to PIX4Dcatch, enabling precise handheld 3D scans on LiDAR-equipped iOS devices.
- March 2025: Trimble released TBC 2024.10 with customizable AI point extraction and automated lane-line detection for faster pavement analysis.
- February 2025: Trimble launched the MX90 vehicle-independent mobile mapping system, capturing laser scans and imagery at highway speeds for crack detection and asset inspections.
- February 2024: Exyn Technologies unveiled Nexys, a modular autonomous survey platform enhancing data-capture speed and accuracy for confined environments.


Research Methodology Framework and Report Scope
Market Definitions and Key Coverage
Our study defines the global mobile mapping system market as all revenue generated from hardware, software, and related services that capture georeferenced data while mounted on a moving platform, be it a car, railcar, backpack, vessel, or UAV, using time-synchronized GNSS, LiDAR, radar, and imaging sensors to create consumable digital maps, point clouds, and GIS layers. According to Mordor Intelligence, the market was valued at USD 43.4 billion in 2025 and is projected to reach USD 100.6 billion by 2030.
Scope Exclusions: Fixed terrestrial scanning stations and purely indoor SLAM-only solutions are not included.
Segmentation Overview
- By Component
- Hardware
- Software
- Services
- By Mounting Type
- Vehicle Mounted
- Railway Mounted
- Drone Mounted
- Others
- By Application
- Imaging Services
- Aerial Mobile Mapping
- Emergency Response Planning
- Internet Applications
- Facility Management
- Satellite
- By End-user Verticals
- Government
- Oil and Gas
- Mining
- Military
- Other End-user Verticals
- By Region
- North America
- United States
- Canada
- Mexico
- Europe
- United Kingdom
- Germany
- France
- Italy
- Rest of Europe
- Asia-Pacific
- China
- Japan
- India
- South Korea
- Rest of Asia-Pacific
- Middle East
- Israel
- Saudi Arabia
- United Arab Emirates
- Turkey
- Rest of Middle East
- Africa
- South Africa
- Egypt
- Rest of Africa
- South America
- Brazil
- Argentina
- Rest of South America
- North America
Detailed Research Methodology and Data Validation
Primary Research
Mordor analysts interviewed geospatial consultants, LiDAR OEMs, drone integrators, mapping service bureaus, and large-city GIS managers across North America, Europe, the Gulf, and Asia Pacific. These conversations tested sensor ASP trends, capture-per-lane-mile costs, and procurement cycles, filling critical gaps left by secondary literature and feeding back into assumption refinement.
Desk Research
We first aggregated publicly available benchmarks from tier-1 institutions such as the US Geological Survey, Eurostat's remote-sensing statistics, the International Telecommunication Union's ICT indicators, and customs trade data for LiDAR and inertial navigation units. Industry white papers from bodies such as the International Society for Photogrammetry and Remote Sensing and the Open Geospatial Consortium provided adoption metrics for 3D city models and digital twins. Complementary insights flowed from company 10-Ks, investor presentations, reputable press releases, and patent families retrieved through Questel.
Subscription resources were tapped sparingly, Dow Jones Factiva for deal flow, and D&B Hoovers for supplier financials, helping us size vendor revenue streams that are otherwise opaque. The desk-research sources listed here are illustrative; numerous additional references were reviewed to validate figures and clarify gray areas.
Market-Sizing and Forecasting
We deployed a top-down construct that rebuilds the addressable spend from three demand pools, government cadastral budgets, commercial infrastructure surveys, and navigation content refresh cycles, which are then cross-checked with selective bottom-up roll-ups of hardware shipments times typical ASP and sampled service rate cards. Key variables include LiDAR unit cost deflation, lane-mile scanning intensity, UAV flight-hour tariffs, smartphone GNSS penetration, and municipal digital twin mandates. A multivariate regression links these drivers to historical revenue, while ARIMA smoothing captures seasonality in procurement spikes. Where supplier roll-ups undershoot the demand pool, ratios are adjusted using validated utilization factors from primary interviews.
Data Validation and Update Cycle
Before sign-off, outputs pass three layers of analyst review, anomaly scans against independent KPI sets, such as GNSS module exports and city GIS spend, and variance checks versus prior editions. We refresh the model annually and trigger interim updates for material events such as regulatory shifts or major M&A, ensuring clients receive the latest calibrated view.
Why Mordor's Mobile Mapping Baseline Enables Confident Decisions
Published estimates often diverge because firms pick different revenue streams, platform mixes, and refresh cadences. We acknowledge those gaps up front and show how disciplined scope setting plus multi-source corroboration anchor a dependable baseline.
Key gap drivers emerge when other publishers drop drone-mounted revenues, rely on installed-base counts instead of transactional spend, or extrapolate long-range CAGRs from short historical windows. Our analysts report current-year values only after cross-validating with hardware flow, service invoices, and exchange-rate parity.
Benchmark comparison
| Market Size | Anonymized source | Primary gap driver |
|---|---|---|
| USD 43.4 B (2025) | Mordor Intelligence | - |
| USD 31.8 B (2023) | Regional Consultancy A | Omits SaaS GIS layers and considers hardware shipments only |
| USD 34.7 B (2024) | Global Consultancy B | Excludes UAV platforms and applies uniform ASP across regions |
| USD 24.0 B (2023) | Trade Journal C | Uses installed equipment base, not annual revenue flow |
These comparisons show that, by combining clearly framed scope, blended top-down and bottom-up logic, and frequent data hygiene checks, Mordor Intelligence delivers a balanced, transparent starting point decision-makers can rely on.


Key Questions Answered in the Report
What is the current value of the mobile mapping system market?
The market was valued at USD 51.19 billion in 2026 and is forecast to reach USD 116.86 billion by 2031, growing at an 17.95% CAGR.
Which region leads the mobile mapping system market?
North America led with 37.40% revenue share in 2025, supported by infrastructure funding and defense ISR programs.
Why are drones gaining traction in mobile mapping?
Drones posted a 21.10% CAGR because lightweight solid-state LiDAR and improved endurance allow safe, rapid data capture in areas inaccessible to vehicles.
How are declining LiDAR costs affecting adoption?
Solid-state unit prices fell below USD 200, enabling multi-sensor deployments that lower project costs and expand the addressable user base.
Which application segment is expanding fastest?
Emergency-response planning is growing at a 20.60% CAGR as agencies integrate real-time mobile mapping into disaster preparedness workflows.
What challenges limit broader market uptake?
High up-front equipment costs and a shortage of trained operators continue to restrain adoption, particularly in emerging economies.
Page last updated on:


