
India Car Rental Market Size and Share
Market Overview
| Study Period | 2020 - 2031 |
|---|---|
| Forecast Data Period | 2026 - 2031 |
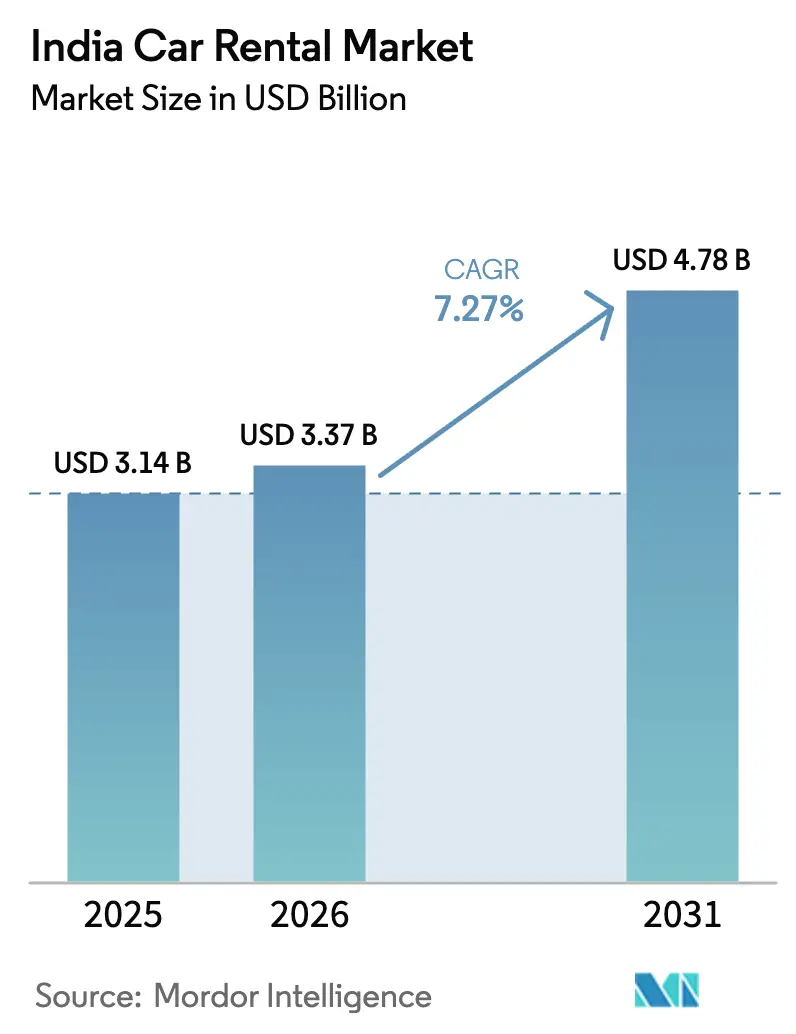
| Base Year Market Size (2025) | USD 3.14 Billion |
| Market Size (2026) | USD 3.37 Billion |
| Market Size (2031) | USD 4.78 Billion |
| Growth Rate (2026 - 2031) | 7.27 % |
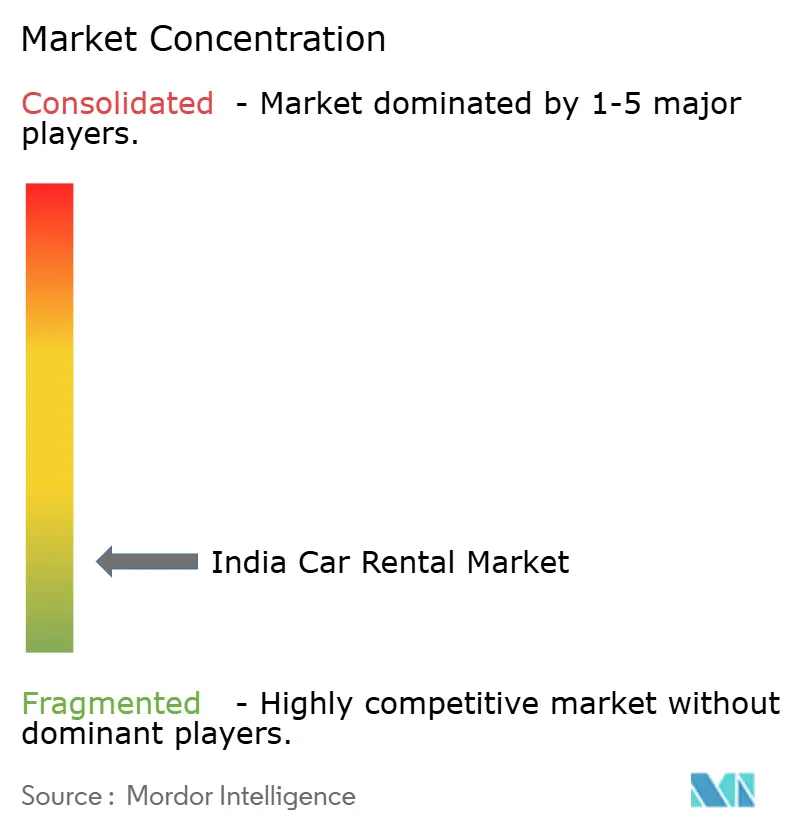
| Market Concentration | Low |
Major Players *Disclaimer: Major Players sorted in no particular order Image © Mordor Intelligence. Reuse requires attribution under CC BY 4.0. | |
India Car Rental Market Analysis by Mordor Intelligence
The India car rental market size is expected to grow from USD 3.14 billion in 2025 to USD 3.37 billion in 2026 and is forecast to reach USD 4.78 billion by 2031 at 7.27% CAGR over 2026-2031. Economic reopening, improving highways, and supportive tax policy keep demand resilient even as price-sensitive travelers scrutinize mobility budgets. Organized operators continue consolidating small fleets, bringing standardized safety features and digital booking tools to a broader customer base. Smartphone penetration surpassing 80% among urban adults has pushed online bookings above two-thirds of all reservations, while subscription models help corporate buyers avoid upfront capital outlays. Policy incentives for electric vehicle uptake and interstate permit simplification give the Indian car rental market additional growth vectors despite near-term cost pressures from insurance inflation.
Key Report Takeaways
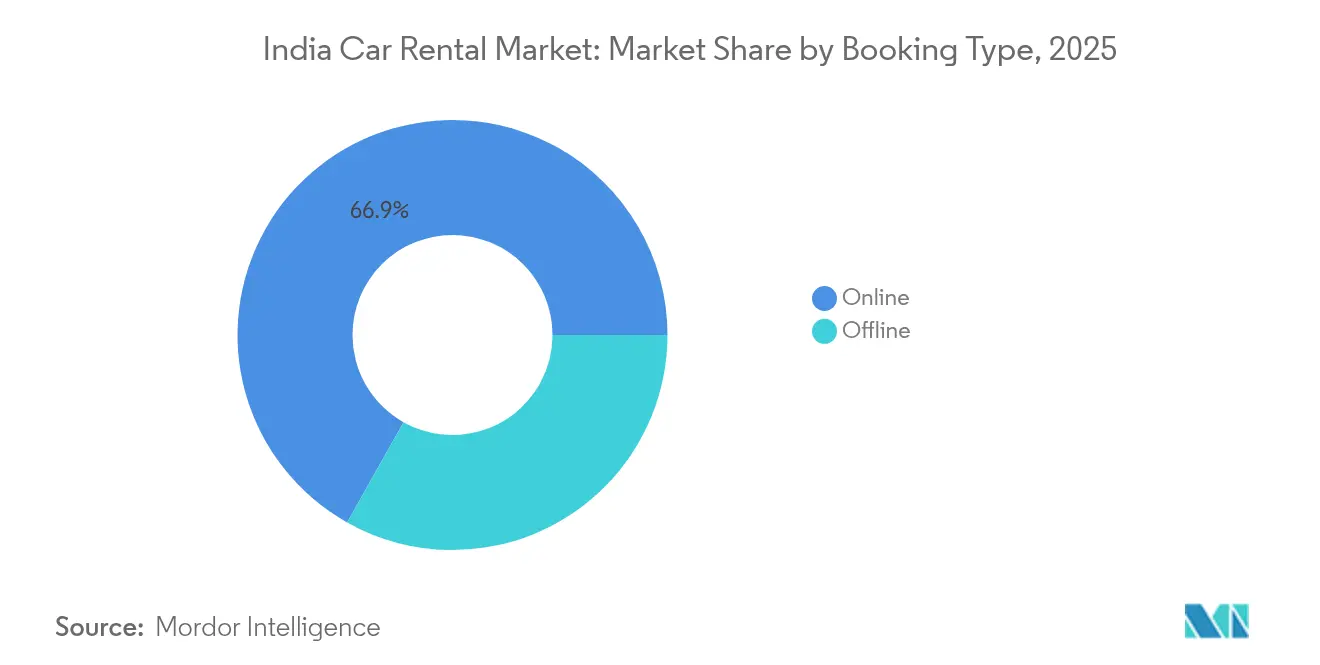
- By booking type, online channels controlled a 66.85% share of the India car rental market in 2025, and are projected to expand at a 7.60% CAGR during the forecast period (2026-2031).
- By application, tourism accounted for a 57.74% share of the Indian car rental market in 2025, while commuting and daily mobility are projected to grow at an 8.42% CAGR during the forecast period (2026-2031).
- By service model, chauffeur-driven controlled a 56.12% share of the Indian car rental market in 2025, while the Self-Drive segment is expected to post an 7.92% CAGR during the forecast period (2026-2031).
- By vehicle class, economy/budget cars controlled 71.88% share of the Indian car rental market in 2025, while the luxury/premium segment is expected to post a 8.82% CAGR during the forecast period (2026-2031).
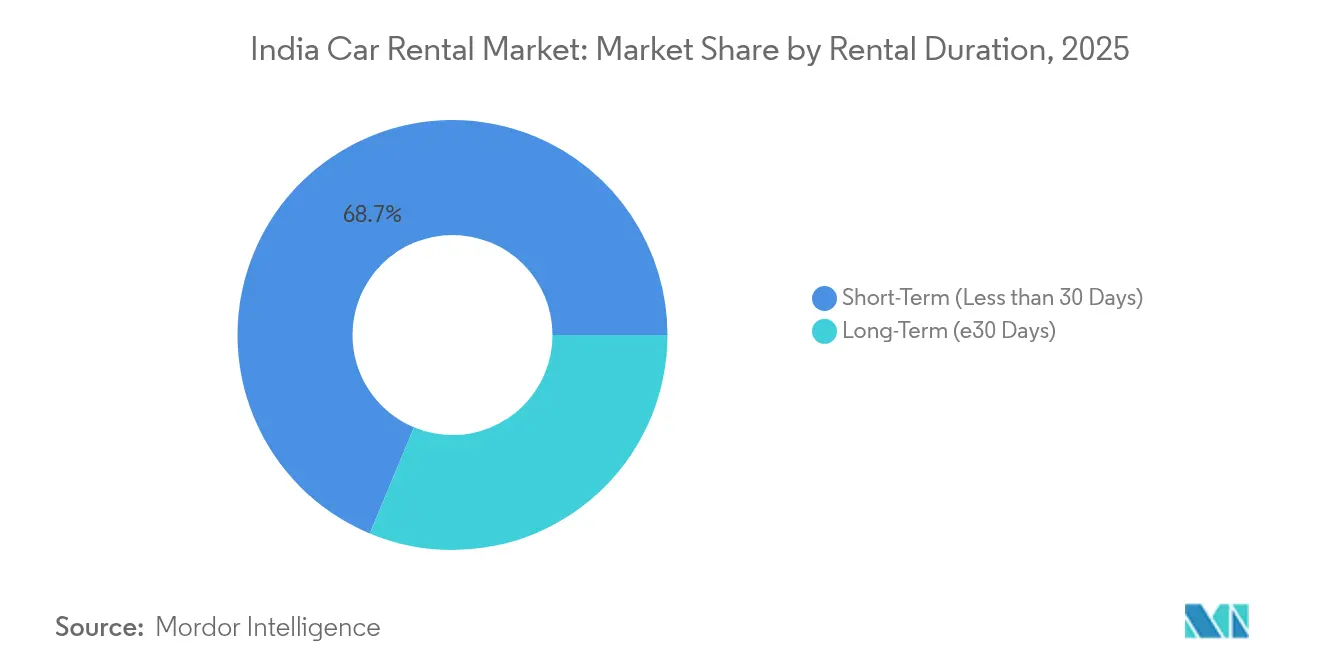
- By rental duration, short-term rentals dominated the Indian car rental market, with a 68.71% share in 2025, while long-term subscriptions are poised for a 9.18% CAGR during the forecast period (2026-2031).
- By rental channel, off-airport rentals controlled 76.10% of the India car rental market share in 2025, whereas airport rentals are projected to expand at an 8.39% CAGR during the forecast period (2026-2031).
Note: Market size and forecast figures in this report are generated using Mordor Intelligence’s proprietary estimation framework, updated with the latest available data and insights as of 2026.
Market Trends and Insights
Drivers Impact Analysis of India Car Rental Market*
| Driver | (~) % Impact on CAGR Forecast | Geographic Relevance | Impact Timeline |
|---|---|---|---|
| Tourist Flow Fuels Domestic Market | +1.8% | Major metros and tourist circuits | Medium term (2-4 years) |
| Corporates Drive Gig Mobility | +1.5% | Metro cities and industrial hubs | Medium term (2-4 years) |
| Mobile App Bookings Rise | +1.2% | Tier-I cities expanding to Tier-II/III | Short term (≤ 2 years) |
| EV Fleets Grow Via Incentives | +0.9% | Policy-supportive states | Long term (≥ 4 years) |
| GST, Permits Boost Inter-State Travel | +0.7% | National corridors | Short term (≤ 2 years) |
| Rentals Integrate With Travel Ecosystems | +0.6% | Airports and transit hubs | Medium term (2-4 years) |
| Source: Mordor Intelligence | |||
Expanding Domestic and Inbound Tourism Flow
Domestic holidaymakers are projected to drive a considerable revenue growth for tourism enterprises in FY25, prompting rental firms to deploy an incremental fleet in spiritual, coastal, and heritage destinations. Flexible short-duration hires appeal to travelers seeking “micro-holiday” itineraries that public transit cannot cover. Hotel occupancy approaching 68% in 2024 resurrects airport-ground transport synergies. Small-and medium-sized events and a steady rise in meetings demand amplify weekday utilization rates, cushioning seasonal volatility. Government investment in roads, rail connectivity, and destination marketing multiplies demand for legally compliant, tech-enabled car rentals.
Growth of Corporate Travel and Gig-Economy Mobility Demand
India's business travel sector is projected to recover to pre-2019 spending levels by 2025. In 2024, business travel spending in India reached an estimated USD 38.3 billion, making it the 8th largest market globally and 4th in the Asia-Pacific (APAC) region, according to the Global Business Travel Association (GBTA). Hybrid work has increased the need for sporadic yet premium door-to-door transport as firms curtail long-term chauffeur contracts. Employee transportation and chauffeur-car rental services currently penetrate only one-fifth of an addressable INR 1 lakh-crore opportunity, leaving wide space for organized entrants. Gig-economy workers favor daily or weekly packages that blend unlimited kilometers with predictable rates, generating a new mid-duration niche within the Indian car rental market. AI-driven routing helps operators hit punctuality targets despite urban congestion.
Rising Penetration of Mobile-App Based Booking Platforms
Integrations such as Zoomcar’s tie-up with Mappls allow users to locate nearby vehicles, compare tariffs, and complete payment inside a single navigation interface. Subscription features branded “Drive Longer, Pay Less” encourage multi-month commitments, improving fleet utilization. AI-based model selectors bypass the long-standing ambiguity of “Sedan” or “SUV” categories, giving travelers certainty on boot space, safety ratings, and infotainment features. Peer-to-peer listings enlarge supply in smaller towns without asset purchases, broadening the Indian car rental market while keeping overhead light for platform operators. Embedded booking journeys in airline, train, and hotel apps are expected to capture incremental impulse rentals over the next two years.
EV Adoption in Rental Fleets Fueled by FAME II Incentives
The PM E-DRIVE scheme running through March 2026 reimburses up to INR 10,000 per kilowatt-hour for qualifying commercial EVs, offsetting 15-20% of the upfront cost [1]. Maharashtra's proposal to waive freeway tolls for electric cars aims to reduce costs for operators on intercity routes. Demonstrating industry confidence, private partnerships are emerging, like an energy giant backing thousands of ride-share charging stations. However, the nation grapples with a scarcity of public chargers, operating only a fraction of the millions projected to be necessary by decade's end. Consequently, rental companies are strategically concentrating their EV fleets in Delhi, Bengaluru, and Mumbai, aligning with areas of higher charging density and corporate demand.
Restraints Impact Analysis of India Car Rental Market*
| Restraint | (~) % Impact on CAGR Forecast | Geographic Relevance | Impact Timeline |
|---|---|---|---|
| Limited Tier-I City Presence | -1.4% | Tier-II/III nationwide | Medium term (2-4 years) |
| Ride-Hailing Undercuts Multi-Day Rentals | -1.1% | Metro areas with dense ride-hailing fleets | Short term (≤ 2 years) |
| High Compliance Burdens Fleet Operators | -0.8% | National | Short term (≤ 2 years) |
| Sparse EV-Charging Network Hurts Rentals | -0.6% | Non-metro regions | Long term (≥ 4 years) |
| Source: Mordor Intelligence | |||
Limited Presence Beyond Tier-I Cities
Ecos (India) Mobility derives 60% of its turnover from just four metros, highlighting the difficulty of scaling service quality in smaller markets where maintenance vendors and roadside assistance coverage remain thin. Fragmented local taxes, divergent driver-license categories, and gaps in airport connectivity combine to raise the break-even fleet size in Tier-II towns. Yet used-car ownership is rising rapidly in these cities, signaling latent demand that organized rentals could unlock through franchise partnerships and asset-light peer fleets.
Ride-Hailing Price Advantage Over Multi-Day Rentals
Ride-hailing platforms can offer point-to-point trips at per-kilometer tariffs that are 10-30% lower than full-day rental rates, particularly during off-peak hours when dynamic pricing remains subdued. Their variable-cost driver model eliminates idle-time overhead, enabling frequent discount vouchers that attract price-sensitive travelers away from multi-day packages. Pay-as-you-go billing aligns with sporadic urban travel habits, reducing the perceived need to retain a vehicle for an entire day. Car-rental operators struggle to match these headline fares because daily bundles must absorb parking, insurance, and minimum driver wages even while the vehicle is parked. Rising adoption of ride-sharing passes and corporate wallet integrations further shifts price comparisons in favor of app taxis, leaving rental fleets with lower weekday utilization and heavier reliance on weekend tourism peaks to protect margins.
*Our forecasts treat driver/restraint impacts as directional, not additive. The impact forecasts reflect baseline growth, mix effects, and variable interactions.
India Car Rental Market Segment Analysis
By Booking Type:
Online Platforms Cement ControlThe India car rental market accounts for a 66.85% share in the India Car Rental Market in 2025, as bookings through websites or apps, and that are expected to grow with a 7.60% CAGR during the forecast period (2026-2031). Platform integrations with navigation suites reduce discovery friction and feed data back to fleet-planning algorithms. Offline counters persist at railway hubs where walk-up travelers favor human assistance, but automated kiosks and QR code unlocks are rapidly closing the convenience gap.
Peer-to-peer engines diversify fleet make-up and penetrate housing societies and tech parks where traditional rental storefronts are absent. AI chatbots handle most service queries, significantly reducing the average resolution time. Cashback campaigns tied to e-wallets lure budget travelers, while subscription bundles with smartphone upgrades signal cross-industry alliances.

By Application Type:
Commuting Demand Outpaces LeisureTourism still supplied a 57.74% share in the India Car Rental Market in 2025, but weekday commuting packages show the fastest trajectory at an 8.42% CAGR during the forecast period (2026-2031), as city dwellers pivot away from private ownership. The Indian car rental market share for commuting could rise significantly by the decade-end, narrowing the gap with leisure segments. Organized rental agreements tied to corporate travel platforms ensure predictable pricing and duty-of-care compliance.
Spiritual tourism and “micro-holiday” culture elongate peak seasons, smoothing fleet utilization across quarters. Meanwhile, growth in micro, small, and medium enterprises translates into demand for chauffeur-driven shuttles to ferry staff between suburban factories and transit nodes. Daily subscription passes bundle four intra-city trips under a fixed kilometer cap, reflecting operators' creative packaging.
By Service Model:
Self-Drive Continues to Erode Chauffeur RelianceChauffeur-driven rides held a 56.12% share in the India Car Rental Market in 2025. Still, self-drive bookings are predicted to grow at an 7.92% CAGR during the forecast period (2026-2031), as navigation apps and automatic transmissions simplify do-it-yourself driving. Indian car rental market players are modernizing fleets with telematics that monitor speed, fuel use, and driver behavior, reducing misuse and insurance claims.
Subscription hybrids merge self-drive flexibility with on-call driver availability for select legs, blurring category lines. Premium cab launches with AI vehicle-match engines allow passengers to guarantee exact models, raising average revenue per trip. Asset-light sourcing—where vendors own 94% of vehicles—keeps balance sheets nimble and supports rapid geographic roll-outs.
By Vehicle Type:
Premium Upswing Amid Economy CoreEconomy models supplied a 71.88% share in the India Car Rental Market in 2025. Still, luxury and premium vehicles are clocking a 8.82% CAGR during the forecast period (2026-2031) due to rising disposable income and corporate upgrades. The planned rollout of 100% connected-car fleets by several players will push infotainment and ADAS features into mid-segment classes, eroding the experiential gap. The size of premium cars in the Indian car rental market is projected to triple between 2025 and 2030.
SUVs dominate leisure and business hires, capturing customers who value ride height and luggage capacity on intercity highways. EV adoption remains skewed toward premium sub-segments because high sticker prices align better with premium tariff structures and corporate ESG targets.
By Rental Duration:
Long-Term Packages Shift Revenue MixShort-term hires under 30 days represented 68.71% share in the India Car Rental Market in 2025, but multi-month subscriptions are forecast to lift the long-term slice at a 9.18% CAGR during the forecast period (2026-2031). Corporations view operational leases as a hedge against residual-value swings and regulatory shifts. The Indian car rental market size generated by long-term packages is projected to double by 2030.
Gig-economy professionals subscribe for 28-day cycles, allowing unlimited intra-city kilometers, bolstering weekday utilization. Dynamic pricing engines adjust deposits and per-kilometer charges based on credit scores and telematics-verified driving behavior, rewarding safe use with lower renewals.
By Rental Channel:
Airports Rebound, Off-Airport Retains BulkOff-airport pickups still own 76.10% share in the India Car Rental Market in 2025, due to lower rents and flexible storefront placement. Airport counters, however, are on an 8.39% CAGR during the forecast period (2026-2031), as international arrivals bounce back. The Indian car rental market participants deploy self-service lockers that cut hand-over time to under five minutes, meeting tight connection schedules.
The government’s Bharatmala initiative has opened new six-lane corridors funneling tourists straight from runways to emergent leisure hubs, raising airport-origin one-way bookings. Off-airport operators respond by launching free doorstep delivery within a 15 km radius, leveraging shared-driver pools to optimize routing.
Geography Analysis
Revenue remains highly metropolitan: Mumbai, Delhi, Bengaluru, and Hyderabad account for a major share of the India car rental market, yet they cover less than 4% of cities served. Each metro records penetration levels above 35 cars per 10,000 residents versus below 5 for Tier-II towns. Interstate projects such as the Delhi–Mumbai Expressway trim transit times by 12 hours, stimulating one-way hires and widening catchment radii for urban suppliers . Maharashtra’s aggregator rules, effective October 2025, harmonize fares across app and offline operators, boosting consumer trust and formal fleet registrations.
Second-tier clusters—Ahmedabad, Kochi, Chandigarh, and Lucknow—display double-digit growth as airport expansion and hotel pipeline investments materialize. However, patchy charging infrastructure limits EV deployment outside metros; less than 400 public chargers operate across all Tier-II locations combined. State incentives such as road-tax waivers in Gujarat and toll discounts in Maharashtra narrow operating costs but remain inconsistent nationwide.
Tourism circuits in Uttarakhand, Rajasthan, and Goa show robust weekend demand; operators therefore document 30-40% above-average kilometer utilization on Friday-Monday blocks. Spiritual corridors encompassing Varanasi, Ayodhya, and Puri witness spikes during festival periods, prompting fleet repositioning strategies. The government’s priority rural road program complements expressways by connecting villages to arterial highways, allowing operators to offer last-mile extensions and tap fresh visitor segments.
Regulatory Landscape
India car rental operations sit within the Motor Vehicles Act and the CMVR framework, with the Rent-a-Cab Scheme, 1989, providing a baseline reference for licensing rent-a-cab and self-drive activities through State Transport Authorities. For platform-led models, the Ministry of Road Transport and Highways issued the Motor Vehicle Aggregator Guidelines, 2025, which set out expectations on safety, compliance, and digital governance for aggregators across ride-hailing and app-based rentals.
State enforcement and rulemaking continue to shape unit economics and compliance intensity. A specific example is the Maharashtra Motor Vehicle Aggregator Rules, 2026, which require licensing, link base fares to approvals by the Regional Transport Authority, cap surge pricing at 1.5x, and include provisions such as a minimum driver revenue share and penalties (reported up to INR 1 crore). On the tax side, self-drive rentals are commonly mapped under SAC 997329 for GST classification, affecting invoicing and input-credit structures versus operator-driven transport classifications.
Value Chain Analysis
The India car rental value chain begins with vehicle sourcing, including owned fleets, leasing, and vendor or partner-owned cars. This is followed by fleet onboarding and compliance (registration, permits, insurance, and periodic fitness or inspection requirements), then technology enablement for discovery, booking, pricing, KYC, and telematics. Demand aggregation and distribution are increasingly digital, with online channels accounting for 66.85% of bookings in 2025, supported by app platforms and integrations into travel and navigation ecosystems.
Operations and service delivery cover vehicle handover (airport and off-airport), chauffeur recruitment and management for driver-led services, maintenance and refurbishment networks, roadside assistance, and claims management. Payments, security deposits, and fraud controls (including KYC, driver and customer verification, and incident response) sit alongside customer support and ratings-based quality loops. Key participant archetypes include self-drive platforms such as Zoomcar and Revv, chauffeur-driven and aggregator-led supply such as Ola Drive, and corporate and premium specialists such as Avis India and Eco Rent A Car, while regulators increasingly influence platform governance through aggregator guidelines and state-level licensing rules.
Competitive Landscape
The India car rental market is fragmented. Recent consolidation moves - MakeMyTrip’s majority stake in Savaari and CarDekho’s purchase of Revv- mirror a strategic pivot toward scale economies and multi-service super-apps [3]. Incumbents improve differentiation through AI fleet-planning, IoT-based preventive maintenance, and customizable subscriptions. Technology spending averages 5-6% of revenue, covering proprietary telematics stacks and cloud-native booking engines.
Ride-hailing aggregators enter multi-day rental segments, leveraging captive driver networks and data. Traditional rental operators counter with vendor-sourced fleets to stay asset-light and geographic-agile. Corporate clients increasingly demand ESG-compliant transport; in response, suppliers commit to deploying 25% electric units by 2027. Partnerships with domestic OEMs accelerate electric asset availability while shared battery-swap stations lower range anxiety.
State-level fare and safety regulations raise compliance thresholds that could squeeze micro fleets out of the market, indirectly lifting market share for larger platforms. Yet customer loyalty remains fluid, hinging on vehicle quality and booking transparency rather than brand heritage. Investment capital flows to tech-centric challengers emphasizing subscription suites and embedded APIs for travel portals.
India Car Rental Industry Leaders
-
Zoomcar
-
Revv
-
Ola Drive
-
Avis India
-
Myles
- *Disclaimer: Major Players sorted in no particular order
India Car Rental Market Companies Covered in this Report
- Zoomcar
- Revv
- Drivezy
- MyChoize
- Myles
- Vroom Drive
- Eco Rent A Car
- Ola Drive
- Avis India
- Carzonrent
- Savaari Car Rentals
- Hertz India
- Europcar-Eco Mobility
- IndusGo
- FastTrack Tours & Travels
- One Way Cab
Market Opportunities and Future Outlook
Formalization around aggregator operations creates space for organized, compliant fleets to take share from more fragmented operators by standardizing fares, safety, and digital controls. The Motor Vehicle Aggregator Guidelines, 2025, along with state actions such as the Maharashtra Motor Vehicle Aggregator Rules, 2026, give clearer operating guardrails that operators can convert into scalable SOPs for onboarding, KYC, pricing governance, and grievance handling across cities.
Two practical expansion lanes are fleet electrification and longer-tenure products. The PM E-DRIVE scheme runs through March 2026 and reimburses up to INR 10,000 per kWh for qualifying commercial EVs, lowering upfront EV acquisition costs for operators that can place vehicles where charging density and corporate demand are strongest. On the demand side, self-drive (7.92% CAGR stated in the report) and long-term subscriptions (9.18% CAGR stated in the report) indicate product-market fit for app-led, repeat-use cohorts, supported by platform integrations and subscription bundles designed to lift utilization beyond weekend tourism peaks.
Recent Industry Developments in India Car Rental Market
- July 2026: Maharashtra Government notifies the Maharashtra Motor Vehicle Aggregator Rules 2026 establishing a uniform licensing, safety, and fare control framework for app based transport aggregators. The change standardizes operating conditions for app based mobility platforms in the state and signals a tighter regulatory environment that could influence fleet utilization and service rules.
- May 2026: Zoomcar completes principal milestones required to progress its financial restructuring. This marks a key internal step toward stabilizing the balance sheet, potentially enabling debt reduction and continued market competitiveness.
- April 2026: Zoomcar expects a 70 percent year-over-year reduction in net loss for FY2026. The anticipated improvement strengthens profitability metrics and supports tighter unit economics.
India Car Rental Market Report Scope and Research Methodology
Market Definition and Coverage
For this study, the market covers paid, short-term access to passenger cars in India where the end user rents a vehicle for personal or business travel, either with a driver or as self-drive, and the spending is counted as rental revenue.
Scope exclusions: We exclude app-based on-demand taxi rides, long-term vehicle leasing that behaves like ownership substitution, and informal cash rentals that cannot be reasonably validated.
Segments Covered in This Report
- By Booking Type
- Online
- Offline
- By Application Type
- Tourism
- Commuting / Daily Mobility
- By Service Model
- Self-Drive
- Chauffeur-Driven
- Corporate Leasing / Subscription
- By Vehicle Type
- Luxury / Premium Cars
- Economy / Budget Cars
- By Rental Duration
- Short-Term (Less than 30 Days)
- Long-Term (Greater than/equals 30 Days)
- By Rental Channel
- Airport
- Off-Airport
Data Sources, Market Sizing, and Validation
Desk Research
Desk research is used to set the demand context and to anchor the model to trackable mobility signals. We mainly reviewed public travel and transport indicators, such as tourism statistics from the Ministry of Tourism, road transport and vehicle registration series from MoRTH, fuel and price series from PPAC, and macro indicators from the World Bank and IMF.
To understand supply conditions and operating economics, we also used corporate disclosures like annual reports, investor presentations, and audited filings, supported by reputed press and association websites tied to travel and mobility. In a few places, paid subscriptions were used for company financials and structured news coverage so the revenue split and fleet trends could be cross-checked consistently. The sources listed here are illustrative, and many other public and paid references were also used to collect data, validate assumptions, and clarify gaps.
Primary Interviews and Surveys
Primary work focused on validating what is hard to see in public data, such as utilization patterns, typical rental duration mix, and how pricing changes by city and season. We spoke with a spread of fleet owners, operators, aggregators, travel agents, and corporate mobility buyers across major metros and fast-growing tier-2 clusters, and then we used follow-up checks when desk findings did not match market reality.
Distribution of primary research fieldwork respondents
| Company type | Respondent position |
|---|---|
| Top tier: 27% | CXOs: 14% |
| Mid tier: 59% | Functional/Unit leaders: 38% |
| Smaller Players: 14% | Managers: 48% |
Market-Sizing & Forecasting
Sizing starts with a top-down demand pool build, where passenger travel intensity in key corridors is reconstructed and then translated into rental trips using penetration assumptions that vary by city type. Once the demand pool is framed, we test it with selective bottom-up approximations, such as sampled average daily rate times paid rental days, plus channel checks with operators and intermediaries, which are then used to adjust totals when gaps show up.
A few practical inputs keep the model grounded, including rental days by purpose (airport, outstation, local), the share of chauffeur-driven versus self-drive, utilization and downtime assumptions for fleets, average price per day by vehicle class, and seasonality linked to holiday and business travel cycles. When bottom-up signals are thin for smaller cities, we fill gaps using benchmark ranges from similar urban clusters and then re-check them with interview feedback so extreme values are avoided.
For forecasting, scenario analysis is used because demand is sensitive to travel sentiment and price inflation, and then growth is shaped using variables like domestic tourism volumes, air passenger traffic trends, fuel prices, and vehicle purchase costs that influence substitution. The final output is kept reproducible, since each assumption is linked back to an observable indicator or a clearly explained primary input.
Data Validation & Update Cycle
Outputs are validated through multiple checks so the totals do not drift away from reality. We compare the modeled revenue trajectory with independent signals like travel volumes, fleet expansion commentary, and observed pricing direction, and then anomalies are flagged for a second review before sign-off.
If a major variance is found, we re-contact relevant respondents and re-run the sensitivity around the drivers causing the change, such as utilization, pricing, or mix shifts. Reports are refreshed annually, and interim updates are made when material events occur, followed by a final pre-delivery pass so clients receive the latest consistent view.
Mordor Intelligence's India Car Rental Market Size Versus Other Published Estimates
Published market sizes can vary a lot for car rental in India, even when the topic label looks the same. The gaps usually come from what is counted as rental, how self-drive and chauffeur revenue is treated, and how pricing and utilization are projected over the forecast window.
In this category, a common difference is scope creep into ride-hailing and taxi services, or into long-tenure leasing that behaves more like fleet management than rentals. Some estimates also bake in aggressive utilization recovery and faster price escalation without checking them against operator feedback and city-level seasonality, which can push the value up quickly in the model.
Benchmark comparison
| Source | Market Size | Gaps in Research Methodology |
|---|---|---|
| Mordor Intelligence | USD 3.14 B (2025) | |
| Global Consultancy A | USD 4.20 B (2025) | Uses a broader mobility definition that blends taxi and ride-hailing gross bookings into the same total, which inflates value versus rental-only revenue. |
| Trade Journal B | USD 2.60 B (2025) | Uses a narrower cut that focuses on organized operators and airport counters, and it undercounts intercity chauffeur rentals and app-led bookings outside major hubs. |
The spread is mainly explained by what each publisher treats as rental revenue and how utilization and pricing are normalized across cities. Some figures roll adjacent services into the total. For Mordor Intelligence, only paid car rental revenue in India is counted, and taxi-like on-demand rides are kept out, so the value stays traceable to rental days and realistic rates.
Key Questions Answered in the Report
How fast is the India car rental market expected to grow through 2031?
It is anticipated to advance at a 7.27% CAGR, taking revenue from USD 3.37 billion in 2026 to USD 4.78 billion in 2031.
Which booking channel currently dominates national car-rental reservations?
Online platforms captured 66.85% of 2025 bookings and are projected to widen that lead.
What role will electric vehicles play in the next five years?
EV uptake should accelerate as FAME II and PM E-DRIVE incentives cut capex, though charging density outside metros remains a constraint.
Which customer segment is driving the fastest rental-duration growth?
Long-term subscriptions tied to corporate and gig-economy users are forecast to grow at a 9.18% CAGR, outpacing short-term leisure hires.