
Market Overview
| Study Period | 2020 - 2031 |
|---|---|
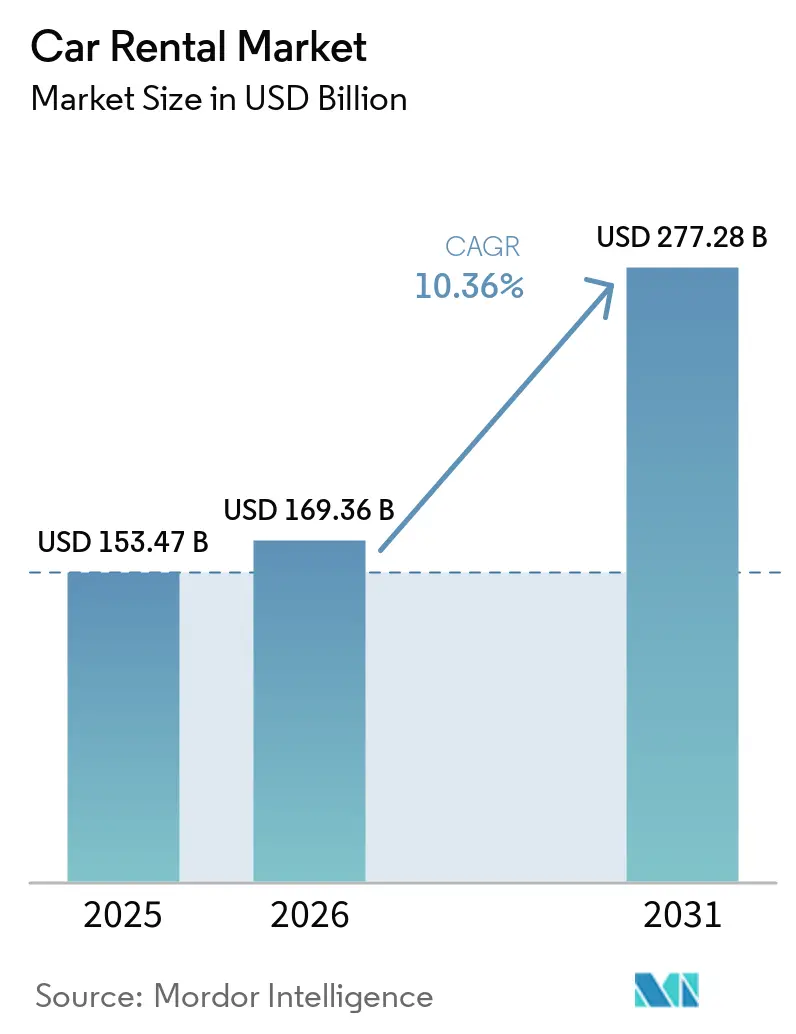
| Market Size (2026) | USD 169.36 Billion |
| Market Size (2031) | USD 277.28 Billion |
| Growth Rate (2026 - 2031) | 10.36 % |
| Fastest Growing Market | Asia Pacific |
| Largest Market | North America |
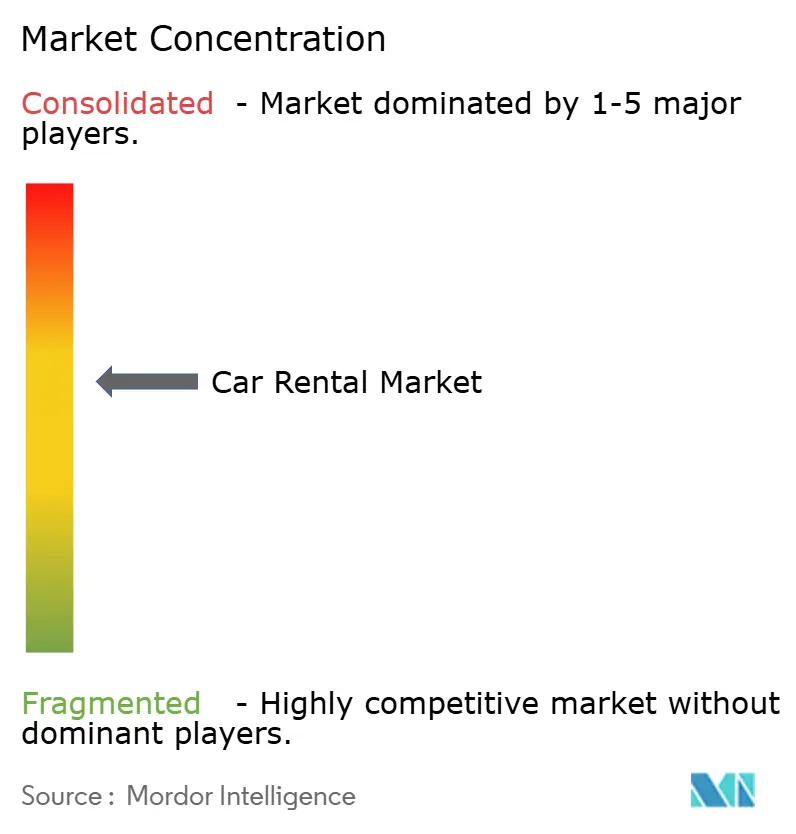
| Market Concentration | Medium |
Major Players *Disclaimer: Major Players sorted in no particular order Image © Mordor Intelligence. Reuse requires attribution under CC BY 4.0. | |
Car Rental Market Analysis by Mordor Intelligence
The Car Rental Market size was valued at USD 153.47 billion in 2025 and estimated to grow from USD 169.36 billion in 2026 to reach USD 277.28 billion by 2031, at a CAGR of 10.36% during the forecast period (2026-2031). This trajectory confirms the sector’s decisive rebound from its pandemic trough. Rising disposable income in emerging economies, continued airport infrastructure upgrades, and wider access to digital booking channels are steering sustained demand. Operators are capturing incremental revenue by matching dynamic pricing engines with data on flight arrivals, highway congestion, and local events. Peer-to-peer platforms, once considered fringe, have doubled down on safety guarantees and loyalty perks, drawing new hosts into the ecosystem. Fleet electrification remains uneven, yet corporate sustainability mandates have ensured steady procurement of low-emission models despite headline-grabbing write-downs at some incumbents.
Key Report Takeaways
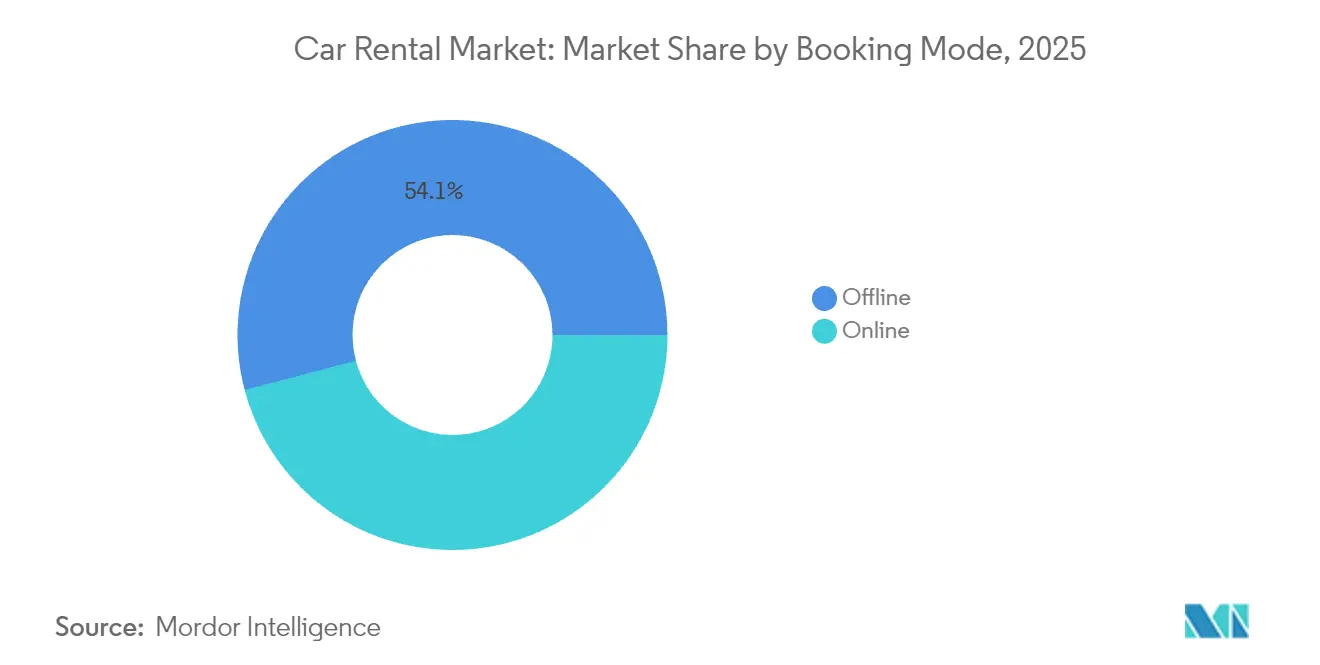
- By booking mode, offline platforms led the car rental market with a 54.12% share in 2025, while online platforms are forecast to grow at a 10.42% CAGR during the forecast period (2026-2031).
- By application, leisure travel had a 55.68% share in the car rental market in 2025 and is expected to advance at a 10.45% CAGR during the forecast period (2026-2031).
- By end user, self-drive individuals held 66.02% of the car rental market share in 2025, while peer-to-peer hosts recorded the highest projected CAGR at 10.58% during the forecast period (2026-2031).
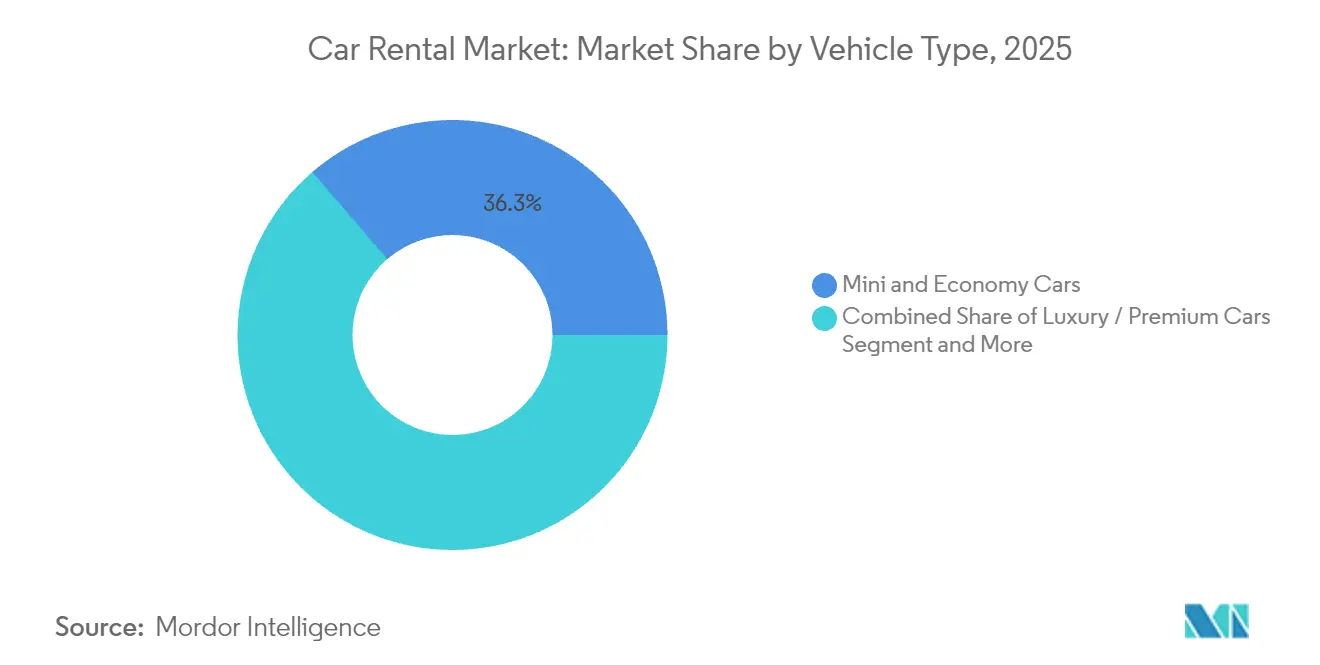
- By vehicle type, mini and economy cars captured a 36.30% share in the car rental market in 2025. SUVs and MPVs are set to expand at a 10.49% CAGR during the forecast period (2026-2031).
- By rental length, short-term bookings represented a 64.88% share in the car rental market in 2025, whereas long-term subscriptions are poised to grow at a 10.55% CAGR during the forecast period (2026-2031).
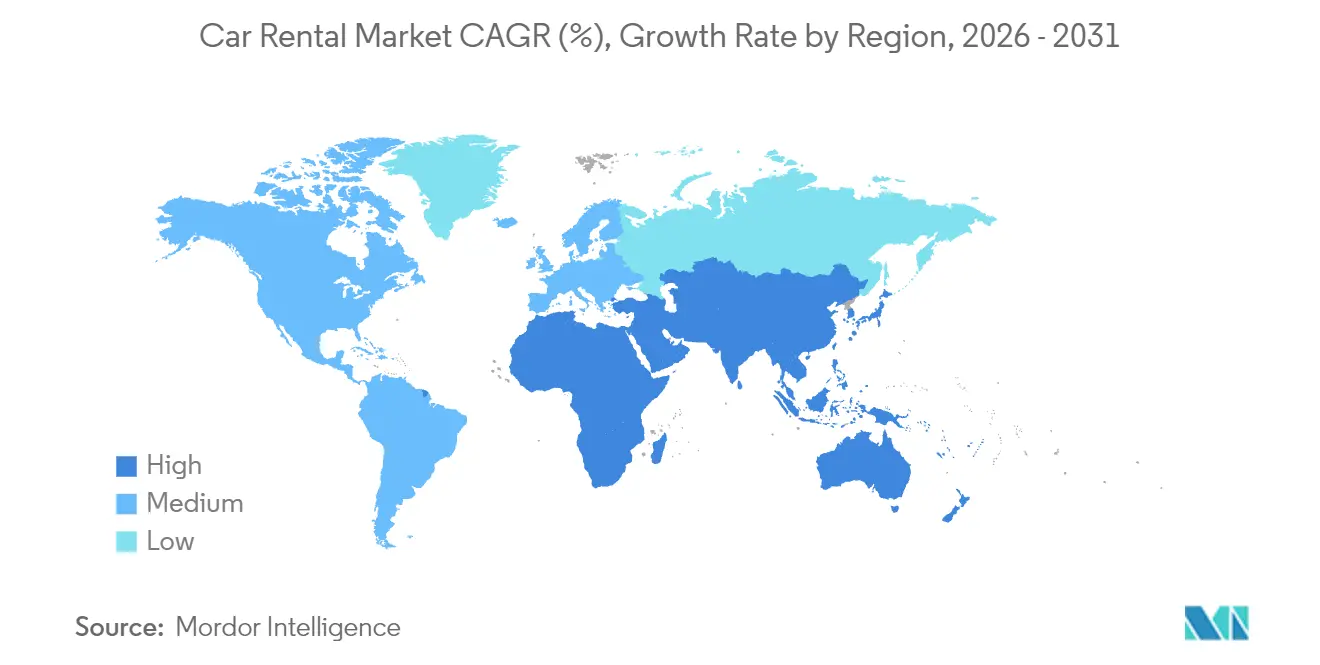
- By geography, North America retained a 35.02% share in the car rental market in 2025, and Asia-Pacific is projected to grow fastest at a 10.62% CAGR during the forecast period (2026-2031).
Note: Market size and forecast figures in this report are generated using Mordor Intelligence’s proprietary estimation framework, updated with the latest available data and insights as of 2026.
Market Trends and Insights
Drivers Impact Analysis of Car Rental Market*
| Driver | (~) % Impact on CAGR Forecast | Geographic Relevance | Impact Timeline |
|---|---|---|---|
| Rapid Rebound Of Post-Pandemic Leisure Travel | +2.8% | Global, with stronger impact in North America and Europe | Short term (≤ 2 years) |
| Growing Penetration Of Online Booking Platforms | +2.1% | Global, with accelerated adoption in Asia-Pacific | Medium term (2-4 years) |
| Expansion Of Low-Cost Airlines | +1.9% | Asia Pacific core, spill-over to Middle East and Africa and Latin America | Medium term (2-4 years) |
| Corporate ESG Mandates Accelerating Adoption Of EV Rental Fleets | +1.7% | North America and EU, early adoption in urban centers | Long term (≥ 4 years) |
| Data-Driven Dynamic Pricing Tools | +1.4% | Global, with advanced implementation in developed markets | Medium term (2-4 years) |
| Airport Infrastructure Upgrades | +1.2% | Asia-Pacific, Middle East, selective African markets | Long term (≥ 4 years) |
| Source: Mordor Intelligence | |||
Rapid Rebound Of Post-Pandemic Leisure Travel
Leisure passenger volumes have eclipsed pre-covid peaks, with U.S. Transportation Security Administration screenings up less than one-tenth year over year and mirrored surges seen at European airports[1]“Checkpoint Travel Numbers for 2025,” Transportation Security Administration, tsa.gov . Higher seat factors translate directly into stronger rental counter throughput, particularly on weekends when hybrid work allows extended stays. Travelers are booking earlier and keeping cars longer, a pattern that lifts revenue per transaction for operators employing day-based utilization targets. Bleisure trips lengthen average rental duration as executives tack on personal days. Normalizing corporate meetings add weekday demand density, allowing fleet planners to deploy assets more evenly through the week. Price resilience remains evident, with American Express Global Business Travel forecasting U.S. daily rates to inch up slightly across 2025 despite rising fleet capacity[2]“Air Monitor 2025,” American Express Global Business Travel, gbt.americanexpress.com .
Growing Penetration Of Online And Mobile Booking Platforms
As digital channels redefine customer acquisition, Avis Budget Group's cloud-native pricing system swiftly tailors offers for its loyalty members[3]“Rate Shop Modernization Press Release,” Avis Budget Group, avis.com . Mobile apps streamline check-in, upsell insurance, and permit mid-trip extensions with one tap, shrinking counter dwell time. Seamless payment flows encourage cross-selling roadside assistance, toll packages, and lifting attachment rates. Uber riders in select cities can now reserve Turo vehicles directly through the Uber app, seamlessly integrating the two platforms. This move channels millions of monthly active users into Turo's rental funnel, all at a marginal cost[4]“Uber and Turo Partnership Announcement,” Uber Technologies Inc., uber.com . Predictive analytics harvests clickstream and flight data to refine city-pair demand curves, allowing operators to rebalance inventory before peak surges hit.
Expansion Of Low-Cost Airlines Creating Multi-Modal Travel Demand
Low-cost carriers are opening secondary airports that sit far outside city limits, catalyzing last-mile rental demand. Adani’s redevelopment of Mumbai International is designed for massive incremental passengers by 2025, with adjacent pick-up bays earmarked for rental fleets. Point-to-point flight networks encourage travelers to design open-jaw itineraries that require flexible surface mobility. In Southeast Asia, domestic tourists bundle low-fare flights with self-drive vacations because intercity rail remains patchy. Operators that partner directly with airlines capture bundled booking traffic and secure prime curb space at new terminals. These linkages forge an integrated mobility narrative that positions a rental vehicle as the logical extension of an air ticket.
Corporate ESG Mandates Accelerating Adoption Of EV Rental Fleets
Global enterprises have set science-based targets that cascade down to travel policies, nudging employees toward low-emission options. Enterprise Mobility now fields thousands of battery electric vehicles across the United States, Canada, and Europe to meet these mandates. UK corporations are increasingly adopting electric vehicles, as evidenced by the country's leased fleet, which boasts markedly lower average CO₂ emissions and a substantial portion of deliveries being battery electric. Premium pricing on EV classes helps defray acquisition costs, yet high depreciation and repair bills strain margins. Hertz is strategically offloading a large segment of its electric vehicle fleet, incurring associated financial charges, all in a bid to manage its risks better. Operators continue to pilot subscription bundles that wrap carbon reporting and charging access into a single fee, aligning with procurement teams’ sustainability dashboards.
Restraints Impact Analysis of Car Rental Market*
| Restraint | (~) % Impact on CAGR Forecast | Geographic Relevance | Impact Timeline |
|---|---|---|---|
| Popularity Of Ride-Hailing And Car-Sharing Substitutes | -1.8% | Global, with concentrated impact in urban centers | Medium term (2-4 years) |
| Rising Residual-Value Risk Amid Rapid EV Technology Cycles | -1.5% | Global, with acute impact in markets with high EV adoption | Long term (≥ 4 years) |
| Airport Concession Fees Squeezing Operator Margins | -0.9% | Global, with higher impact in major airport hubs | Medium term (2-4 years) |
| Regulatory Caps On Ice Vehicles | -0.7% | Europe and North America, expanding to Asia-Pacific urban centers | Long term (≥ 4 years) |
| Source: Mordor Intelligence | |||
Popularity Of Ride-Hailing And Car-Sharing Substitutes
App-based rides are taking the lead in ground transport spending, with platforms like Uber and Lyft dominating urban travel, marking a decline for traditional rentals. Fare transparency, cashless payment, and driver-as-concierge appeal to city visitors reluctant to navigate traffic and parking. Peer-to-peer platforms layer another competitive vector: These models dodge airport concession fees, allowing lower headline prices. Traditional operators have responded with fast-pass pick-up lanes and entering white-label partnerships to regain relevance in downtown corridors. Nonetheless, urban day rentals continue to face structural pressure from on-demand alternatives.
Rising Residual-Value Risk Amid Rapid EV Technology Cycles
Manufacturers' aggressive pricing and rapid battery innovations are shaking up resale expectations. As a result, lessors have adjusted residual values in response to a significant drop in used EV listings, especially those of Teslas. ALG has trimmed residual projections across most EV nameplates, complicating fleet sourcing decisions. Operators contemplating large EV orders must now model multiple disposal scenarios and hedge resale via guaranteed buy-back clauses. The volatility tempers near-term electrification rollouts even as corporate customers clamor for green fleets, creating a push-pull dynamic weighing the car rental market growth curve.
*Our forecasts treat driver/restraint impacts as directional, not additive. The impact forecasts reflect baseline growth, mix effects, and variable interactions.
Car Rental Market Segment Analysis
By Booking Mode:
Digital channels reshape customer acquisitionIn 2025, offline platforms commanded a 54.12% share of the car rental market. Meanwhile, online platforms are projected to experience a robust growth rate of 10.42% CAGR during the forecast period (2026-2031). This evolving landscape has diminished the prominence of traditional brick-and-mortar counters, yet paradoxically broadened the global reach of even mid-tier brands. The convenience is palpable for loyalty members: pre-populated profiles and secure mobile keys allow them to bypass counters entirely, streamlining their experience. Moreover, with push notifications alerting them to flight delays, customers can effortlessly adjust pick-up times, enhancing overall satisfaction. While offline walk-ups still play a role in areas with limited smartphone access, they grapple with higher booking costs due to staffing and facility expenses.
Digital traffic is increasingly converging with airline applications, hotel platforms, and third-party online travel agencies, now cross-selling mobility options. This integration reduces customer acquisition costs and paves the way for additional revenue through bundled services like insurance and GPS add-ons. Furthermore, the data reservoirs generated from these transactions provide fleet planners with foresight into city-pair demands, enabling timely fleet transfers and reducing idle days. As a result, operators adopting API-first strategies have significantly outpaced their competitors in utilization metrics within the car rental sector.



By Application:
Leisure travel drives market expansionBased on experiential tourism trends, leisure travelers generated a 55.68% share of the car rental market in 2025 and will sustain a 10.45% CAGR during the forecast period (2026-2031). Families designing multi-stop road vacations prize vehicle control and luggage flexibility unavailable on group tours. Contactless delivery options introduced during the pandemic remain popular as they let renters proceed directly from baggage claim to parking bay, avoiding crowded shuttle buses. Higher fuel efficiency and spacious cargo areas rank at the top of leisure renters’ preference lists, directing procurement toward crossover models.
Business travel is regaining 2019 trip counts, as the average length of rental has increased due to hybrid work policies that allow employees to add personal days. This blend of business and leisure supports weekday and weekend utilization, smoothing the revenue curve. Programmable corporate accounts that bundle emissions reporting help operators attract sustainability-minded firms, reinforcing demand resilience even if corporate trip volumes plateau.
By End User:
Peer-to-peer models disrupt traditional segmentsSelf-drive individuals retained a 66.02% share of the car rental market in 2025, underlining personal autonomy as the dominant motivator for car rental market customers. Meanwhile, peer-to-peer rentals are growing at a 10.58% CAGR during the forecast period (2026-2031), chipping away at entry-level price tiers. Hosts monetize underused personal vehicles in residential neighborhoods closer to renters than airport depots. Ratings systems and insurance guarantees have eased safety concerns that once limited adoption. Traditional firms respond by repackaging idle cars into urban subscription schemes for local residents, protecting utilization on aging units.
Corporate fleets increasingly explore flexible subscriptions, swapping rigid leasing contracts for rental-based models that adjust as headcounts shift. This pivot channels some enterprise kilometers toward long-term rental agreements, including maintenance and roadside service. Chauffeur-drive services cater to executives and luxury tourists in jurisdictions with challenging road conditions, yet comprise a small slice of the overall car rental market.
By Vehicle Type:
SUVs lead growth despite economy dominanceMini and economy cars control a 36.30% share of the car rental market in 2025 due to price-sensitive travelers and corporations that enforce daily rate caps. Still, SUVs and MPVs are projected to record the fastest 10.49% CAGR during the forecast period (2026-2031), capturing aspirational demand and accommodating group travel. Higher seating positions and perceived safety boost their popularity among families. Fleet managers must weigh more substantial daily revenues against steeper acquisition and fuel costs, especially in regions lacking tax incentives for efficient powertrains.
Luxury and premium segments yield robust per-day margins but remain vulnerable to ride-hailing substitutes offering chauffeured premium vehicles. Operators pursue manufacturer buy-backs or guaranteed residual value contracts to de-risk prestige fleets. Meanwhile, commitments like SIXT’s order for up to 250,000 Stellantis units signal a broad-based pivot toward electrified powertrains, covering everything from compact hatchbacks to midsize SUVs.
By Rental Length:
Long-term subscriptions transform business modelsShort-term rentals held a 64.88% share of the car rental market in 2025, yet long-term agreements will progress at a 10.55% CAGR during the forecast period (2026-2031). Corporate buyers appreciate the off-balance-sheet nature of month-to-month rentals, while individual consumers in congested metros view subscriptions as a parking-free alternative to ownership. Operators bundle maintenance, insurance, and seasonal swaps under a monthly fee, stabilizing revenue and enhancing fleet predictability. Medium-term rentals serve relocating employees or film crews needing cars for several weeks, filling gaps between daily retail demand and annual lease commitments.
Enterprise Mobility credited slight growth in fleet management services for record FY24 revenue of USD 38 billion, underscoring the profitability of extended-duration contracts. Regulatory bodies are drafting guidelines that blur the line between rental and lease; compliance costs are expected to be modest relative to the upside of predictable cash flows.
Geography Analysis
North America Car Rental Market
North America comprises a 35.02% share in the car rental market in 2025, reflecting mature travel infrastructure and a high vehicle ownership culture. Avis Budget Group posted USD 12 billion in 2023 sales as airport passenger flows regained momentum and loyalty program re-enrollments climbed. Dynamic pricing engines exploited flight disruption data to capitalize on last-minute bookings. Electric vehicle uptake remains tempered by charging deserts along rural interstates, yet corporate clients have begun mandating low-emission classes for city centers such as New York and Los Angeles. Corporate travel sees slower growth because hybrid work reduces trip frequency, yet emissions reporting keeps EVs on preferred lists in the electric car rental market. Competitive intensity is elevated in urban corridors where ride-hailing platforms maintain a stronghold, though rentals still dominate one-way interstate journeys.
APAC Car Rental Market
Asia-Pacific is forecast to grow with a 10.62% CAGR during the forecast period (2026-2031). Rising middle-class travel, visa-on-arrival schemes, and vigorous airline seat growth underpin market momentum. Enterprise Mobility opened ten Thai branches in 2024 and now operates ninety-seven Japanese sites, illustrating aggressive network build-out. Indonesia, Vietnam, and India report double-digit inbound tourism growth, straining public transit capacity and directing visitors toward self-drive solutions. Chinese EV makers enter the tourist segment by offering discounted electric crossovers via rental partnerships, creating a low-cost path to overseas brand exposure.
Europe, North America, LATAM and Middle East Car Rental Market
Europe remains a sophisticated yet fiercely competitive arena. SIXT’s multi-year deal for 250000 Stellantis vehicles secures supply amid chip shortages and advances its electrification roadmap. Amsterdam introduces zero-emission zones in 2025, prompting operators to reserve high-value parking slots for electric fleets. Cross-border rentals flourish on the continent’s open internal borders, though differing road toll regimes complicate fleet tracking. Europcar’s re-entry into the United States with Atlanta and Dallas outlets signals renewed transatlantic ambitions. Elsewhere, Latin America and the Middle East benefit from improving highway networks and inbound events such as Saudi Arabia’s Vision 2030 tourism push, yet currency volatility and import restrictions require agile capital allocation.

Regulatory Landscape
Regulation for car rentals is tightening around consumer protection, safety compliance, and emerging peer-to-peer (P2P) models, with rules varying widely by jurisdiction. In the United States, federal requirements such as the Raechel and Jacqueline Houck Safe Rental Car Act (2015) continue to shape recall-management processes for larger fleets. At the state level, Maryland signed HB 1186 in April 2026 to set a clearer insurance and liability framework for P2P car sharing (effective October 1, 2026), while Colorado is phasing in ADA-related adaptive equipment obligations for rental vehicles, extending compliance to small business lessors by July 2026.
Outside the United States, authorities and industry bodies are formalizing standards that affect operating processes at the counter and online. The UK Government maintains the Rental Vehicle Security Scheme (RVSS) code of practice as a security benchmark for rental operators, emphasizing verified identity checks, staff training, and security procedures. In China, GB/T 29911-2025 establishes car rental service standards from November 2025. In Europe, cross-border rentals also sit under evolving guidance and administrative requirements, reinforced by competition and transparency norms such as the UK CMA-related disclosure guidance supported by ACRISS.
Value Chain Analysis
The car rental value chain begins with fleet acquisition (OEM sourcing and remarketing pathways), then moves through financing and insurance, fleet servicing (telematics, maintenance, repair, cleaning, and depot operations), and distribution across airport concessions, neighborhood branches, direct digital channels, online travel agencies (OTAs), and airline and travel loyalty ecosystems. Compliance and risk-management run across multiple nodes, including safety recall controls for larger fleets under the Raechel and Jacqueline Houck Safe Rental Car Act (2015) and liability considerations such as the federal Graves Amendment (2005) in the United States.
Recent moves suggest value creation is expanding beyond traditional daily rentals into platform-led distribution and third-party fleet operations. In April 2026, Europcar Mobility Group partnered with MIC Co., Ltd. (Niconico Rent-A-Car) to enable global booking access to Japanese rental supply through the Europcar platform, strengthening inbound-tourism distribution. On the operations side, Hertz launched Oro Mobility in April 2026 to provide turnkey fleet management services (maintenance, cleaning, and depot operations) for autonomous and rideshare vehicles, anchored by an Uber partnership. The company is effectively positioning contracted fleet-operations services as an additional downstream revenue layer. Loyalty and travel-platform integrations are also deepening demand capture, including SIXT USA becoming a featured partner in American Airlines AAdvantage in July 2026.
Competitive Landscape
Three incumbents, Enterprise Holdings, Avis Budget Group, and Hertz, anchor a market that admits nimble disruptors. While a handful of major players command a significant share of global revenue, the market still offers ample opportunities for regional leaders to flourish. Enterprise leverages its neighborhood branch density to feed corporate account growth and channels off-lease vehicles into retail remarketing at favorable margins. Avis Budget emphasizes digital transformation, migrating core rate-shopping processes to the cloud for faster experimentation. Hertz continues to right-size its fleet mix after heavy EV write-downs, reallocating capital toward more liquid combustion models.
Peer-to-peer leaders Turo and Getaround capitalize on low fixed costs and rapid host onboarding. Their platforms deploy machine-learning risk engines that approve most trips in seconds, capturing time-sensitive customers. Traditional operators have opted for collaboration rather than confrontation: several now place idle units on peer-to-peer marketplaces during shoulder seasons. Dynamic pricing sophistication has become a competitive wedge. AI-driven yield tools segment customers by churn propensity, preserving margin on inelastic segments while flexing into competitive price bands for leisure shoppers. Fleet electrification strategies diverge: SIXT installs universal chargers at European depots, whereas U.S. independents focus on hybrid models to hedge residual risk.
Turo’s alliance with Uber integrates rental inventory into on-demand mobility flows. Enterprise’s franchise expansion across Thailand secures first-mover advantage in secondary tourism provinces. Each initiative underscores the sector’s pivot from pure asset leasing toward platform-based mobility orchestration.
Car Rental Industry Leaders
Avis Budget Group Inc.
Sixt
Hertz Corp.
Enterprise Holdings Inc.
Europcar Group
- *Disclaimer: Major Players sorted in no particular order
Car Rental Market Companies Covered in this Report
- Avis Budget Group Inc.
- Hertz Global Holdings Inc.
- Enterprise Holdings Inc.
- Europcar Mobility Group
- Sixt SE
- Localiza Rent a Car S.A.
- ALD Automotive
- Beijing CAR Inc. (CAR Inc.)
- GIG Car Share
- Lyft Rental
- Uber Rentals
- Silvercar by Audi
- Getaround
- Zoomcar
- Ola Drive
- Fast Rent A Car
- Bettercar Rental
- TT Car Transit
- Renault Eurodrive
- Shenzhen Supreme Car Rental Co., Ltd.

Market Opportunities and Future Outlook
Mobility-platform partnerships are opening a whitespace for rental operators to monetize operational capabilities rather than only vehicle-days. Hertz launched Oro Mobility in April 2026 to deliver fleet operations for autonomous and driver-led mobility partners, starting with an Uber-linked deployment approach that bundles charging, cleaning, and maintenance into a managed service. This model adds a new buyer set, including robotaxi and rideshare operators, and increases the importance of depot networks, standardized processes, and real-time fleet visibility in major metros.
Digital distribution and loyalty-based demand capture also present an opportunity, since travel ecosystems can reduce customer acquisition costs and support repeat usage. The Turo and Uber integration referenced in the report context shows how large consumer platforms can embed rental options directly into everyday mobility apps. Airline loyalty tie-ins provide another access point for frequent travelers, reinforced by SIXT becoming a featured partner of American Airlines AAdvantage in July 2026. On the operations side, connected-fleet and AI tooling is increasingly central to utilization and pricing decisions, consistent with the American Car Rental Association (ACRA) emphasis in 2026 on faster, software-driven operating cycles that align with the market's shift toward dynamic pricing and frictionless booking journeys.
Recent Industry Developments in Car Rental Market
- July 2026: Avis Budget Group launched Avis First, a premium, concierge-style rental experience with curbside service and access to premium vehicles at major US airports and selected local markets. The move sharpens segmentation toward higher-yield travelers and strengthens differentiation at high-volume airport locations where service speed and loyalty conversion are critical.
- July 2025: Avis Budget Group announced a multi-year strategic partnership with Waymo to support autonomous ride-hailing fleet operations and related infrastructure in Dallas. This deepens ties between rental operators and AV platform economics, positioning fleet services and depot operations as a parallel growth lane alongside traditional retail rentals.
- October 2024: Enterprise Mobility expanded in Thailand through franchise partner Thai Rent a Car, opening Enterprise Rent-A-Car, National Car Rental, and Alamo branches. The rollout extends neighborhood and airport coverage in a fast-growing Asia-Pacific travel market and supports broader network build-out across the region.


Car Rental Market Report Scope and Research Methodology
Market Definition and Coverage
For this study, the car rental market is defined as the revenue earned from renting passenger cars and light commercial vehicles for a defined period, where pricing is typically time-based with add-ons like insurance, fuel options, and extra drivers.
Scope exclusions: We exclude vehicle sales, long-term consumer leasing, and pure ride-hailing or taxi fares where a vehicle is not rented to the user.
Segments Covered in This Report
- By Booking Mode
- Offline
- Online
- By Application
- Leisure
- Business
- By End User
- Self-Drive Individual
- Chauffeur-Drive
- Corporate Fleet Subscription
- Peer-to-Peer Rental
- By Vehicle Type
- Mini & Economy Cars
- Compact & Intermediate Cars
- Standard & Full-Size Cars
- SUVs & MPVs
- Luxury / Premium Cars
- By Rental Length
- Short-Term
- Medium-Term
- Long-Term
- By Geography
- North America
- United States
- Canada
- Rest of North America
- South America
- Brazil
- Argentina
- Rest of South America
- Europe
- Germany
- United Kingdom
- France
- Spain
- Italy
- Russia
- Rest of Europe
- Asia-Pacific
- China
- India
- Japan
- South Korea
- Rest of Asia-Pacific
- Middle East and Africa
- United Arab Emirates
- Saudi Arabia
- Turkey
- Egypt
- South Africa
- Rest of Middle East and Africa
- North America
Data Sources, Market Sizing, and Validation
Desk Research
Desk research was used to build the fact base around travel demand, mobility trends, and fleet economics, which then helped us set realistic ranges for utilization and pricing. We referred to public and official sources such as national transport statistics agencies, airport traffic statistics, tourism boards, and central bank or census macro series, which support the travel volume and seasonality inputs.
To make the model practical, we also used information from company annual reports, earnings presentations, association publications, and reputable press coverage to understand fleet size changes, channel mix, and pricing actions. Where needed, paid subscriptions for company financials and news, patent databases, and shipment-level import or export records were used to fill gaps around vehicle supply timing and new mobility features. These examples are not exhaustive, and many other public and paid sources were also checked for data collection, validation, and clarification.
Primary Interviews and Surveys
Primary work focused on interviews and short surveys with fleet operators, travel intermediaries, airport and off-airport location managers, and corporate mobility buyers across key regions so assumptions could be challenged in real time. These conversations helped confirm booking channel shifts, utilization ranges, and how add-on revenue and insurance attachment rates vary by traveler type and season, and that logic is carried into the final model.
Distribution of primary research fieldwork respondents
| Company type | Respondent position | Region |
|---|---|---|
| Top tier: 37% | CXOs: 15% | APAC: 41% |
| Mid tier: 48% | Functional/Unit leaders: 38% | EMEA: 32% |
| Smaller Players: 15% | Managers: 47% | Americas: 27% |
Market-Sizing & Forecasting
Sizing starts with a top-down demand-pool build that reconstructs rental transactions from travel activity (air passenger traffic, leisure arrivals, and business trip intensity), followed by rental penetration and average rental length to estimate days rented. Revenue is then built by applying blended daily rate levels plus add-on revenue (insurance, upgrades, and fees), and results are sanity-checked using selective bottom-up approximations such as sample station economics, fleet size roll-ups, and observed utilization times days-in-fleet.
Key inputs we leaned on include airport versus neighborhood share, online versus offline booking mix, average daily rate movement by season, fleet utilization and turn rates, mix of economy versus premium vehicles, and the share of self-drive versus chauffeur-driven demand where it is common. For forecasting, scenario analysis was used so we could reflect different travel recovery paths, vehicle supply tightness, and pricing normalization, and then align the chosen case to what interviewees described as most likely in the next few years. When bottom-up checks had missing data, gaps were handled by applying location-type averages and conservative utilization bands, and then those were re-tested against regional travel indicators before finalizing totals.
Data Validation & Update Cycle
Outputs were triangulated against independent signals such as travel volumes, fleet availability commentary, and visible pricing movements so the final value does not drift away from what the market can realistically support. Outliers were flagged, reviewed by another analyst, and then either corrected through updated assumptions or re-confirmed through a follow-up expert touchpoint when the variance stayed unexplained.
The report is refreshed annually, and material events like sharp fuel-price swings, major regulatory changes, or large fleet reductions trigger interim checks on utilization and rate assumptions. Before delivery, a final pass is completed so the model reflects the latest public disclosures and demand indicators available at that time.
Mordor Intelligence's Car Rental Market Estimate Compared With Other Published Estimates
It is common to see different market sizes for car rental because publishers do not always count the same revenue streams, and they may also use different base years, exchange-rate timing, and pricing assumptions. The spread usually becomes larger when one estimate relies heavily on high-level travel growth rates without enough checks on fleet capacity and utilization.
By tracking utilization days, blended daily rates, and add-on revenue logic, Mordor Intelligence keeps the value tied to rentals that are actually delivered, which reduces scope creep from adjacent mobility services and makes the year-to-year bridge easier to validate.
Benchmark comparison
| Source | Market Size | Gaps in Research Methodology |
|---|---|---|
| Mordor Intelligence | USD 169.36 B (2026) | |
| Global Consultancy A | USD 214.85 B (2025) | Uses a broader service-revenue framing and a different base year, and the public summary does not clearly separate classic rentals from bundled mobility services, which can lift the headline value. |
| Industry Research Group B | USD 168.48 B (2025) | Anchors the series to a 2024 base and projects forward, so the 2025 value is sensitive to the chosen travel rebound and rate growth assumptions, with limited detail on how fleet availability constrains demand. |
Taken together, the main takeaway is that small scope choices like whether add-ons are fully counted, how booking channels are treated, and what year is used for the anchor can move the market size meaningfully. Our approach stays traceable because each region is built from travel-driven demand, then checked against fleet and pricing reality before the totals are finalized.


Key Questions Answered in the Report
How large is the car rental market in 2026?
The car rental market size stands at USD 169.36 billion in 2026.
What is the projected CAGR for car rentals through 2031?
The sector is forecast to register a 10.36% CAGR between 2026 and 2031.
Which region is expected to grow fastest for car rentals by 2031?
Asia-Pacific leads growth with a projected 10.62% CAGR due to rising tourism and infrastructure investment.
Which booking channel holds the largest share of rental reservations?
Offline platforms command 54.12% share and continue to widen their lead.
Why are long-term rental subscriptions gaining traction?
Enterprises and urban residents favor subscriptions for flexibility and cost predictability, lifting long-term rentals at a 10.55% CAGR.
What risks do electric vehicles pose to rental fleets?
Rapid depreciation and uncertain residual values can erode profitability, as highlighted by recent losses at Hertz.
Page last updated on:


 Your data is secure and never sold or shared.


