
Indian E-Bike Rental Market Size and Share
Market Overview
| Study Period | 2020 - 2031 |
|---|---|
| Forecast Data Period | 2026 - 2031 |
| Base Year Market Size (2025) | USD 7.26 Million |
| Market Size (2026) | USD 8.13 Million |
| Market Size (2031) | USD 14.3 Million |
| Growth Rate (2026 - 2031) | 11.96 % |
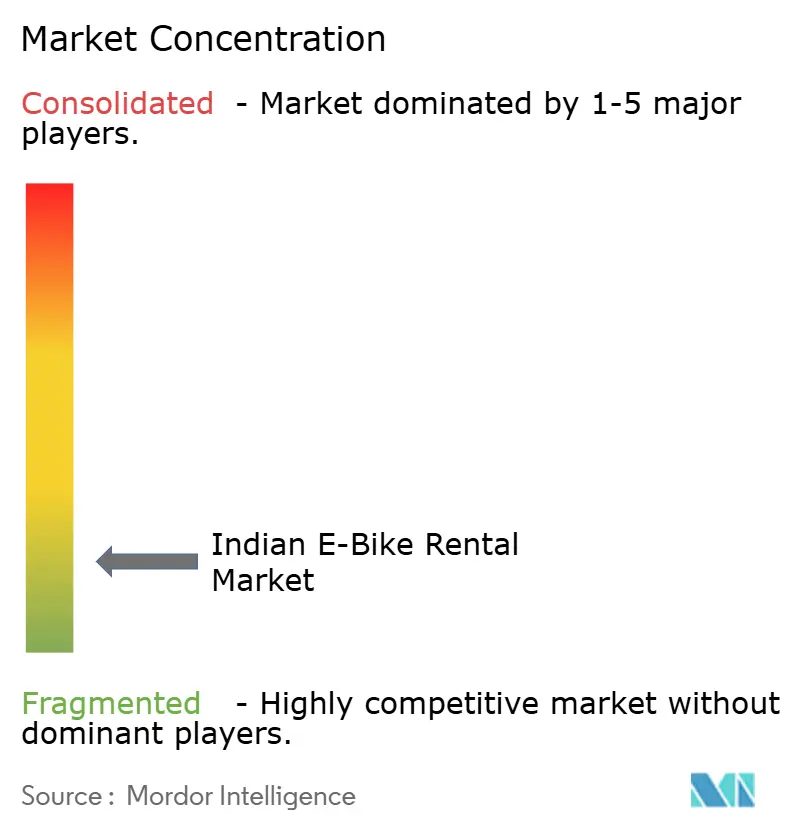
| Market Concentration | Low |
Major Players *Disclaimer: Major Players sorted in no particular order Image © Mordor Intelligence. Reuse requires attribution under CC BY 4.0. | |
Indian E-Bike Rental Market Analysis by Mordor Intelligence
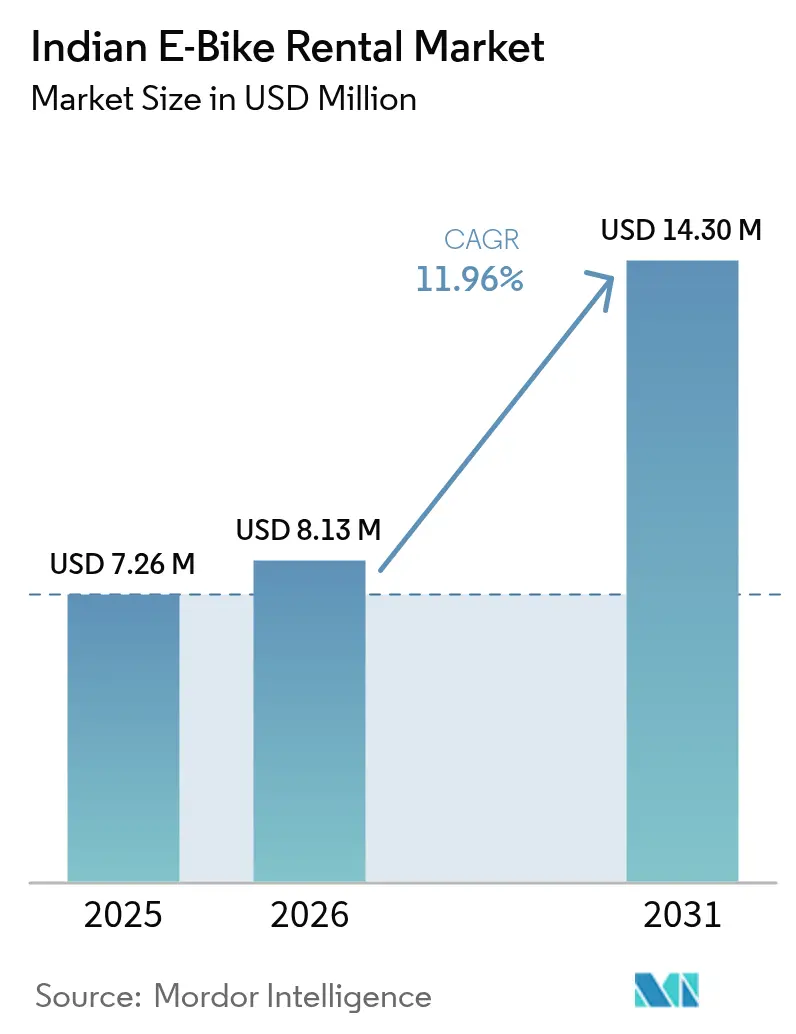
The Indian E-Bike Rental Market size in 2026 is estimated at USD 8.13 million, growing from 2025 value of USD 7.26 million with 2031 projections showing USD 14.3 million, growing at 11.96% CAGR over 2026-2031. Aggressive state-level electrification mandates, widening corporate sustainability targets, and dense charging infrastructure pipelines reshape urban mobility economics. Delhi’s draft EV Policy 2.0, which proposes a new gasoline two-wheeler ban from August 2026, gives operators obvious forward demand signals. As Zypp Electric’s Series C1 exemplifies, rapid venture funding rounds allow operators to scale fleets before profitable unit economics fully mature. Battery-as-a-Service (BaaS) options, such as Honda’s Activa e: subscription, reduce capital stress that once hampered large deployments. Meanwhile, Battery Smart’s milestone of 50 million swaps across 1,400+ hubs confirms that dense swapping networks can offset charger scarcity inside congested city cores.
Key Report Takeaways
- By application, urban/city trips dominated the Indian electric bike rental market, with an 83.12% share in 2025; cargo & logistics is projected to register the fastest 12.09% CAGR during the forecast period (2026-2031).
- By vehicle type, throttle-assisted models held 60.74% of the Indian electric bike rental market size in 2025, while pedal-assisted units are expected to grow at a 12.12% CAGR during the forecast period (2026-2031).
- By end user, the B2C consumer segment controlled 45.12% of 2025 revenues, whereas last-mile delivery services are expected to post at a 12.16% CAGR during the forecast period (2026-2031).
- By subscription model, hourly rentals led with 35.78% share in the Indian Electric Bike Rental Market in 2025; long-term leasing is expected to grow at a 12.05% CAGR during the forecast period (2026-2031).
- By battery type, lithium-ion systems captured an 85.63% share of the Indian electric bike rental market in 2025 and is expected to grow at a 12.08% CAGR during the forecast period (2026-2031).
- By power output, ≤250 W vehicles claimed 72.82% share in the Indian electric bike rental market in 2025, yet 251-500 W models are expected to grow at a 12.14% CAGR during the forecast period (2026-2031).
Note: Market size and forecast figures in this report are generated using Mordor Intelligence’s proprietary estimation framework, updated with the latest available data and insights as of 2026.
Indian E-Bike Rental Market Trends and Insights
Drivers Impact Analysis*
| Driver | (~) % Impact on CAGR Forecast | Geographic Relevance | Impact Timeline |
|---|---|---|---|
| Government Incentives | +3.2% | National, with early gains in Delhi, Karnataka, Maharashtra | Medium term (2-4 years) |
| Surge In VC Funding and Strategic Investments | +2.8% | Metro cities, expanding to Tier-2 cities | Short term (≤ 2 years) |
| Corporate ESG Goals | +2.4% | Urban centers with high delivery density | Medium term (2-4 years) |
| Declining Lithium-Ion Battery Prices | +1.9% | National | Long term (≥ 4 years) |
| Expansion Of Battery-Swapping Hubs | +1.6% | Metro cities, pilot expansions | Medium term (2-4 years) |
| Urban Congestion Charges and LEZs Nudging Commuters | +1.4% | Delhi NCR, with spillover to Mumbai, Bangalore | Short term (≤ 2 years) |
| Source: Mordor Intelligence | |||
Government Incentives Under FAME-II & State EV Policies
Generous purchase subsidies, fee waivers, and clear battery-swap standards are tilting the total cost of ownership decisively toward rentals. The Ministry of Power’s 2025 guidelines on swap-station interoperability cut vendor lock-in and simplify multi-brand fleet operations [1]“Battery Swapping Standards 2025,” Ministry of Power, mop.gov.in . Delhi’s EV Policy 2.0 earmarks a dedicated fund, sourced from green taxes and aggregator license fees, to finance four-fifth of two-wheeler electrification by 2027. West Bengal is bolstering its electric mobility initiative by offering significant purchase incentives and complete road-tax waivers. As a result, operators can now set e-bike rental prices lower than those of traditional scooters. These initiatives are fostering consistent demand trends, drawing in fleet financing partners. Yet, lessons from previous subsidy programs underscore the importance of a coordinated infrastructure rollout to capitalize on this burgeoning demand.
Surge In VC Funding & Strategic Investments In Micromobility Start-Ups
Capital inflow reached record velocity in 2025, filling a historical funding gap that once throttled hardware scale-up. Yulu hit EBITDA breakeven while delivering annual recurring revenue, giving investors a rare proof point for positive unit economics [2]“Press Release—EBITDA Positive,” Yulu Bikes, yulu.com . Greenerg Mobility, a new entrant, has garnered substantial investments, notably securing support from L.G. Balakrishnan & Bros to launch subscription-based hybrid models in Coimbatore. Ample liquidity shortens fleet payback cycles, subsidizes rider acquisition, and accelerates SaaS telematics rollouts. Partnerships with delivery giants convert capital into immediate utilization, protecting gross margins. Yet cash-burn tolerance varies; smaller operators without unique moats still face consolidation or acqui-hire prospects as the market matures.
Corporate ESG Goals Accelerating Last-Mile E-Fleet Conversions
Public sustainability pledges translate into contractual demand for thousands of two-wheelers each year. Zomato already fields fifty thousand electric delivery partners and eyes complete conversion by 2030 [3]“Sustainability Update 2025,” Zomato, zomato.com . Flipkart targets to be highly profitable by 2030, and Amazon has committed to a considerable number by 2025. Fleet electrification satisfies emission-inventory reporting and delivers marketing equity, but outright purchase strains gig-worker cash flows. Rental platforms, such as Zypp Electric, are rolling out flexible models, including a rent-to-own plan that tailors payment structures to rider earnings. By leveraging institutional contracts, operators are stabilizing utilization, moving beyond just sporadic consumer demand, and securing more predictable revenues throughout seasonal cycles.
Declining Lithium-Ion Battery Prices Lowering Operator Capex
Operators are feeling the relief as battery pack costs plummet. Replacement packs have become significantly more affordable, and companies like Ecozen and Volektra are pioneering magnet-free motor research, diminishing the dependence on expensive rare-earth materials. With subscription-based battery-as-a-service plans, the depreciation risk shifts from fleet owners to OEMs, bolstering cash flow. These combined trends not only shorten payback periods but also allow for reduced rider fees, fueling a robust adoption cycle. Moreover, as battery chemistries evolve, enhanced durability is leading to notable savings in lifetime maintenance costs.
Restraints Impact Analysis*
| Restraint | (~) % Impact on CAGR Forecast | Geographic Relevance | Impact Timeline |
|---|---|---|---|
| Limited Public Charging | -2.1% | Tier-2/3 cities, rural areas | Medium term (2-4 years) |
| High Battery Replacement Costs | -1.8% | National | Short term (≤ 2 years) |
| Regulatory Ambiguity On E-Bike Lane | -1.3% | State-level variations | Short term (≤ 2 years) |
| Theft & Vandalism Risk Elevating Insurance Premiums | -1.1% | Urban areas with high crime rates | Medium term (2-4 years) |
| Source: Mordor Intelligence | |||
Limited Public Charging & Swapping Infrastructure Density
India logged numerous public chargers by June 2024—roughly 1 unit for every 191 EVs—with three-fifths clustered inside five states. Such concentration compels operators to circle megacities, delaying entry into infrastructure-poor tier-2 catchments. Only a few swap stations operated nationally by March 2024, many OEM-exclusive, limiting cross-brand compatibility. The Ministry of Road Transport and Highways has issued model concession agreements for states, yet fragmented execution slows right-of-way approvals. Without dense grids, fleets over-invest in higher-capacity packs that impair capital efficiency. Resulting cost pass-through often erodes the consumer value proposition relative to ride-hailing or public transport.
High Battery Replacement Costs Squeezing Operator Margins
Despite a drop in battery cell prices, replacement packs continue to strain the budgets of delivery bikes with heavy usage. Insurance companies usually categorize chemical degradation under wear-and-tear, which means operators bear the brunt of the costs. To counter this, rental platforms have started implementing tiered pricing as battery health wanes, yet many riders push back against the increased charges. While battery-as-a-service models offer a way to distribute replacement costs over time, the associated subscription premiums can diminish this advantage. Furthermore, talks on residual-value guarantees between insurers and OEMs are sparse, perpetuating the challenge of cost volatility.
*Our forecasts treat driver/restraint impacts as directional, not additive. The impact forecasts reflect baseline growth, mix effects, and variable interactions.
Segment Analysis
By Application Type: Urban Dominance Drives Market Structure
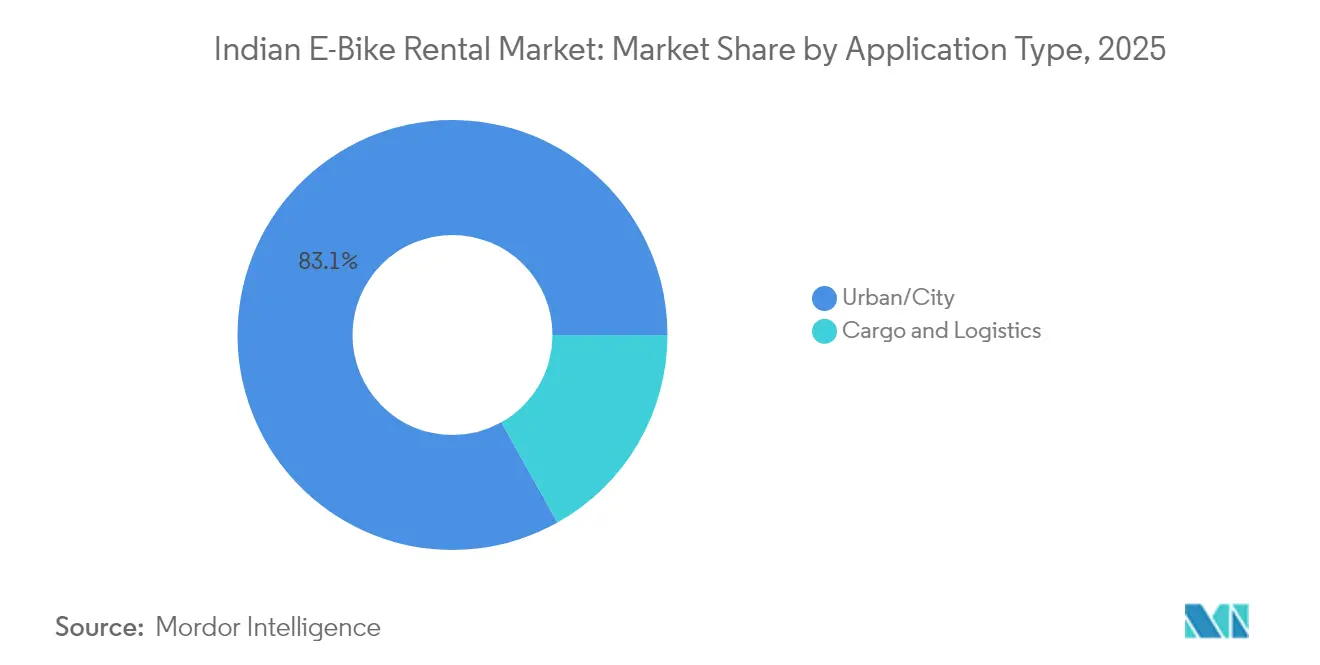
Urban/City trips account for a 83.12% of 2025 revenue for the Indian electric bike rental market, reaffirming the synergy between dense rider pools and short-trip range envelopes. Metropolitan catchments deliver network effects that push asset utilization above the 5–6 rides per day breakeven threshold. Although Cargo & Logistics has a far smaller 2025 base, it is accelerating at 12.09% CAGR to 2031 by piggybacking on e-commerce parcel volumes and corporates’ net-zero roadmaps. Rental fleets deployed for Zomato in Delhi since June 2025, plus EVIFY’s 1,000-unit Hero fleet, illustrate recipe-driven route economics that suit swappable batteries.
Urban prevalence also mirrors policy incentives and LEZ rules that penalize internal-combustion counterparts. Charge-point density allows operators to rebalance fleets throughout the day using telematics cues, minimizing deadheading. Conversely, cargo sub-verticals enjoy contractual locks and predictable shift patterns, supplying steady demand that dilutes the weekend slump typical in B2C rentals. As city master plans adopt congestion fees, rental bikes gain another cost uptick over taxis, cementing urban primacy even while parcel fleets seize incremental volume from heavyweight vans.



By Vehicle Type: Throttle-Assisted Models Lead Market Share
Throttle-assisted bikes accounts for a 60.74% of the 2025 spend within the Indian electric bike rental market share because friction-free acceleration and no-pedal convenience resonate with commuters juggling traffic bursts. They suit courier payloads yet require a license, registration, and third-party insurance, which inflates compliance costs per unit. Pedal-assisted alternatives, expanding at a 12.12% CAGR, slip under the 250 W ceiling and thus bypass licensing, letting casual users onboard instantly at tourist hotspots.
Operators stack fleets with a 70-30 throttle-pedal ratio in metros, but invert the mix in heritage districts where speed caps apply. Motor-efficiency gains now allow pedal-assist models to tackle minimal urban gradients without severe battery drain, shrinking performance gaps. Meanwhile, OEMs like Oben Electric publish simplified compliance matrices to demystify power-band thresholds, hoping to curb accidental regulatory breaches that once led to impounds.
By End User: B2C Leads While B2B Accelerates
Individual riders accounts for a 45.12% share in the Indian Electric Bike Rental Market in 2025,, holding the most significant slice of the Indian electric bike rental market, as students and office goers escaped parking hassles and surge-priced taxis. Their trips skew toward 3–5 km hops between metro stations, justifying lightweight, license-free models. Last-mile delivery crews, however, will outpace at 12.16% CAGR by 2031, fueled by swelling parcel densities and corporate ESG scoring. Zomato provides a robust funnel: Numerous delivery partners on EVs generate stable monthly earnings that tolerate bundled insurance surcharges.
In destinations such as Goa and Pondicherry, where guided e-bike tours fetch premium rates, tourism-centric rentals, despite their modest volume, yield robust margins. Corporates are testing intra-campus fleets as a strategy to curtail parking demands. Operators are tailoring fleet specifications—like cargo racks for couriers and step-through frames for tourists—based on user segments, thereby enhancing utilization and reducing idle time.
By Subscription Model: Hourly Usage Dominates Current Demand
Hourly passes comprised 35.78% share in the Indian Electric Bike Rental Market in 2025, riding on consumer appetite for low-commitment exploration and last-leg commutes. QR-based unlocks let travelers string rides across multimodal trips without daylong liabilities. Long-term leasing rockets at 12.05% CAGR as enterprise contracts and gig-economy riders crave price predictability over volatile fuel budgets. Zypp’s graduated weekly plans illustrate alignment with delivery-partner cash cycles, while ONN Bikes’ per-day promo garners staycation crowds.
Daily and monthly tiers bridge occasional rides and full leases, cushioning seasonality swings during monsoons. Operators now embed swap-station credits into subscriptions, treating battery swaps as soft-cap usage to nudge riders toward off-peak exchanges that flatten grid load. Membership analytics feed dynamic pricing bands to spread demand, maximizing fleet turns against depreciation clocks.
By Battery Type: Lithium-Ion Dominance Reflects Technology Maturity
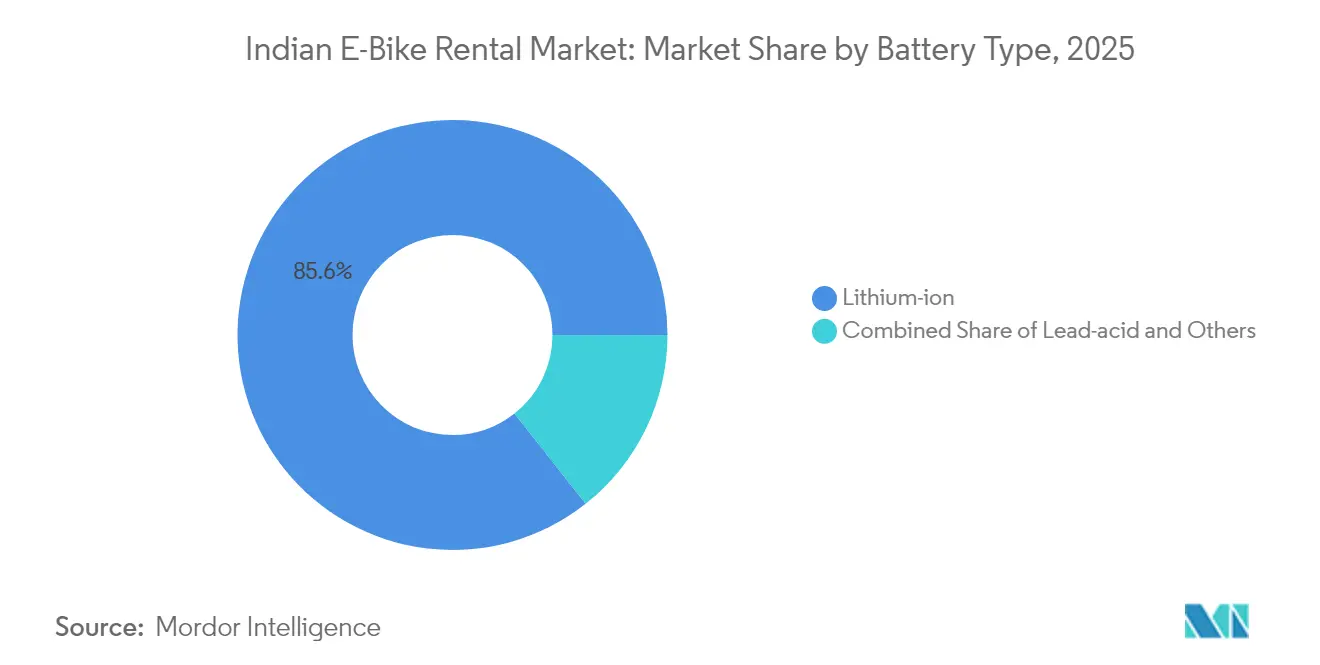
Lithium-ion captured 85.63% share in the Indian Electric Bike Rental Market in 2025, validating its cycle life and charge speed supremacy. Operators interchangeably specify NMC and LFP chemistries, depending on payload needs versus thermal stability. The 12.08% CAGR outlook signals further consolidation as lead-acid packs phase out under tightening weight and range expectations. BaaS models knit OEMs into operator cost stacks, with Honda’s tiered scheme transferring degradation liability while retaining predictable monthly outflows.
R&D alliances such as Ecozen-Volektra push toward magnet-free motors, potentially reducing battery peak-current demands. Such synergies could permit downsized packs in commuter bikes, lowering capital per slot and stretching citywide deployment coverage. Operators also leverage battery analytics to schedule pre-emptive swaps, averting in-ride failures that once dented Net Promoter Scores.
By Power Output: Low-Power Segment Benefits From Regulatory Advantages
Bikes at or below 250 W held 72.82% share in the Indian Electric Bike Rental Market in 2025, owing to frictionless onboarding—no license, no registration, and a minimal insurance footprint. Tourists and students embrace the convenience, while operators value the absence of RTO paperwork. Yet, 251-500 W machines are expected to grow at a 12.14% CAGR during the forecast period (2026-2031), as logistics clients demand higher torque for payloads and flyover climbs. Although they incur compliance overhead, they unlock new revenue verticals where journey times dictate courier SLAs.
OEMs cleverly aim to straddle the threshold, tuning controllers to present sub-250 W nominal but deliver higher peak bursts for brief hill climbs. Misdirection risks legal backlash, so certification transparency is rising; Chetak’s blog openly lists age minimums and license needs for each power band, reducing rider confusion and subsequent fines.
Geography Analysis
Delhi NCR spearheads adoption, fueled by impending gasoline two-wheeler bans and a target of 48,000 public chargers by 2026, translating into superior fleet uptime ratios. Yulu and Battery Smart leverage the region’s dense commuter corridors and swap hubs, ensuring round-trip ranges align with 10-km urban loops. Karnataka and Maharashtra jointly house two-fifths of India’s charger stock, giving Bangalore and Mumbai operators second-tier launch pads. Bangalore’s tech-savvy demographic hastens app downloads, while Mumbai’s congestion fees will tilt modal splits toward e-bike subscriptions.
Tier-2 cities such as Jaipur and Lucknow are earlier in the curve, yet Royal Brothers’ pilot fleet in Trivandrum proves that holiday traffic can cross-subsidize off-peak weekdays. Infrastructure lags remain material; fewer public chargers served all of Uttar Pradesh in 2024, prompting battery swap vans to fill stop-gap needs. State incentive asymmetry further shapes rollouts; West Bengal’s upfront subsidy and tax waiver sparked operator bids around Kolkata’s new EV corridor, yet patchier enforcement slows scale in adjacent districts.
Tourism clusters present seasonal spikes: Goa mandates electric two-wheelers for rented fleets from January 2024, diverting petrol-bike operators toward battery leasing partnerships. BLive curates nine guided routes, monetizing each bike for multiple high-margin daily tours. However, rural hinterlands around these tourist hotspots lack charging backbones, forcing operators to dispatch mobile gensets during peak season. Across regions, adoption maps to a tight triad: policy clarity, infrastructure density, and rider density—the trifecta that currently maximizes India's electric bike rental market expansion potential.
Regulatory Landscape
India's e-bike rental operations sit at the intersection of central motor-vehicle rules, state-level aggregator licensing, and EV incentive programs. The Motor Vehicle Aggregator Guidelines 2025 (MoRTH, under Section 93 of the Motor Vehicles Act, 1988) give states the authority to permit aggregation of private (non-transport) motorcycles for passenger journeys. The same framework also enables states to set annual targets for adding zero-emission vehicles to aggregator fleets. This creates a formal pathway for shared two-wheeler use cases, but execution depends on state notifications, authorization conditions, and fee structures.
On the vehicle and infrastructure side, compliance with safety and technical standards is shaping fleet procurement and operations. BIS standards such as IS 18590:2024 and IS 18606:2024, along with automotive requirements under AIS-156 Amendment 4 (including BMS requirements and water-ingress protection for traction batteries), raise the bar for OEM eligibility and operator risk management. Incentive support under the PM E-DRIVE scheme (effective from October 2024) ties demand incentives to qualifying product and manufacturing requirements, reinforcing the importance of compliant and certified vehicles for scaled rental deployments.
Value Chain Analysis
The value chain starts with OEMs and component suppliers providing BIS/AIS-compliant e-bikes and lithium-ion battery systems, followed by fleet financiers and NBFC-style lending that fund vehicle acquisition for operators. Rental operators (B2C and B2B) sit at the center, combining fleet procurement with telematics and app platforms for onboarding, pricing, geofencing, and loss prevention, and running field operations such as docking/parking management, charging or battery-swapping workflows, and maintenance hubs. Downstream demand comes from commuters and tourists in B2C models, and from enterprise users, especially last-mile delivery platforms and aggregators, in B2B models.
Infrastructure providers, including public charging operators and battery-swapping networks, along with power distribution utilities, influence uptime, route planning, and unit economics through site approvals and power-connection lead times, with high-tension connectivity a recurring bottleneck for larger hubs. Policy instruments also feed directly into the chain: PM E-DRIVE demand incentives (October 2024 to March 2026) affect OEM pricing and operator procurement timing, while the Motor Vehicle Aggregator Guidelines 2025 push operators and platforms toward measurable electrification targets. Operational risk management, including insurance, theft mitigation, battery health monitoring, and end-of-life handling, is increasingly embedded into contracts and subscription bundles, tightening links between operators, OEMs, and battery lifecycle service partners.
Competitive Landscape
The competitive field is fragmented: the top five players account for under half of total active fleets, keeping entry barriers modest but capital requirements steep. Yulu operates with ARR at a mature EBITDA-positive stage, giving it balance-sheet leverage for preferential battery supply contracts. Zypp Electric, armed with a Series C1, plans a 200,000-unit fleet that would triple its 2024 base, underscoring the capital intensity inherent to parcel-delivery niches. Newer arrivals like SnapE Cabs raise multi-modal bets, blending ride-hailing and rentals under a single app to boost lifetime customer value.
Strategic M&A has begun: Vogo’s share-swap merger with bus-aggregator Chalo aims to integrate first-mile e-bikes with mass-transit tickets, illustrating platform convergence. OEM alliances pivot around BaaS; Hero Electric tests co-branded swap stations with Battery Smart, while Honda offers fully integrated pack rentals. Technological differentiation leans heavily on fleet-management SaaS, AI-led repositioning, and tamper-proof battery lockers that reduce theft claims. Operators eye unpenetrated tier-2 supply gaps, but infrastructure misalignment remains the gating variable even as equipment financing lines open up via NBFCs hungry for ESG-aligned assets.
In city centers, competition revolves around docking versus dockless philosophies: Yulu relies on geo-fenced drop zones to cut clutter fines. Bounce Infinity runs keyless lock technology that tolerates free-floating returns. Regulatory preferences vary; Ahmedabad favors fixed stations, nudging operators toward controlled hubs. The interplay of funding access, regulatory rapport, and tech stack robustness will decide which brands consolidate position versus cede market share as the Indian electric bike rental market matures toward 2030.
Indian E-Bike Rental Industry Leaders
Vogo Rental
Zypp Electric
Bounce Infinity
Yulu Bikes Pvt Ltd
eBikeGo Pvt Ltd
- *Disclaimer: Major Players sorted in no particular order

Market Opportunities and Future Outlook
Commercial, contract-led deployment is expanding addressable use cases beyond short urban trips, particularly where quick commerce and last-mile delivery density supports higher daily utilization. In 2026, Yulu expanded via a franchise-led model in Bhopal through its partner initiative, using local execution while keeping centralized technology and operating playbooks. This route supports whitespace in tier-2 cities where delivery ecosystems have demand but lack the capital and execution depth for company-owned rollouts.
Policy and infrastructure programs also give operators levers to deepen city-level penetration and broaden service offerings. Delhi's Electric Vehicle Policy 2026-2030 and the city's charging buildout plans, together with the national PM E-DRIVE incentive window running through mid-2026 for electric two-wheelers, improve near-term fleet economics for compliant vehicles and organized rental models. Battery swapping and battery lifecycle management create additional operational opportunities, since densifying swap networks reduces downtime in congested cores. Partnerships focused on end-of-life battery circularity further align operations with emerging recycling and compliance expectations, helping professionalize fleet residual value management.
Recent Industry Developments
- May 2026: Yulu launched a franchise-led EV mobility service in Bhopal, Madhya Pradesh, partnering with Tezz Mobility under its business partner initiative. The move extends Yulu's operating model beyond metros by leveraging local execution while retaining centralized technology and fleet standards. It also strengthens the B2B delivery-led rental use case by building presence where gig-demand exists but organized fleet supply is thinner.
- December 2025: Zypp Electric launched FleetEase.ai, an AI-enabled fleet management platform for logistics and rental fleets. The product shift adds a software layer to operational scaling, targeting higher utilization, better preventive maintenance, and tighter control over loss and misuse. It supports rental economics by improving dispatch, battery and vehicle health monitoring, and service turnarounds across multi-city operations.
- October 2024: The Ministry of Heavy Industries rolled out the PM E-DRIVE scheme framework and operational guidelines, setting demand-incentive conditions for electric two-wheelers and linking support to compliant products. For rental operators, the scheme influences procurement timing and OEM offerings, especially for fleets that need standardized, certified vehicles to reduce safety and warranty risks. It also reinforces the role of formal aggregation and compliant fleets in scaling shared electric mobility.


Research Methodology Framework and Report Scope
Market Definition and Coverage
For this report, the market covers paid services where an operator provides an electric bicycle to a user for a defined time period in India, and earns revenue through rentals, subscriptions, or lease-style plans.
Scope exclusions: Excludes direct sales of e-bikes, non-electric bike rentals, and supporting infrastructure revenue such as public charging sales that is not bundled into the rental price.
Segmentation Overview
- By Application Type
- Urban/City
- Cargo & Logistics
- By Vehicle Type
- Pedal-Assisted
- Throttle-Assisted
- By End User
- Consumers (B2C)
- Last-Mile Delivery & Couriers (B2B)
- Tourism & Leisure
- Corporate/Institutional Sharing
- By Subscription Model
- Hourly
- Daily
- Monthly
- Long-term Leasing
- By Battery Type
- Lithium-ion
- Lead-acid
- Others
- By Power Output
- Less than or equal to 250 W
- 251–500 W
Data Sources, Market Sizing, and Validation
Desk Research
Desk research was used to build the initial demand and supply picture for e-bike rentals in India, and to set practical boundaries around what should be counted as rental revenue. We reviewed policy and adoption signals from public bodies and regulators, then used them to frame the base demand pool for shared and rented electric two-wheelers.
Typical inputs came from sources such as Ministry of Road Transport and Highways registration statistics, NITI Aayog mobility and EV roadmaps, NHEV and related EV policy documents, Government of India and state transport department notifications, and peer-reviewed papers that discuss shared mobility behavior and total cost of ownership. We also checked company filings, investor presentations, reputed press coverage, and app or website pricing pages to compare typical rental plans.
Where needed, paid subscriptions that aggregate company financials, patent activity, and news were used for faster screening of operators and technology signals. The sources listed above are illustrative, and other public and paid references were also used to confirm data points and tighten assumptions.
Primary Interviews and Surveys
We interview rental operators, fleet managers, mobility partners, regulators, and urban transport specialists in India, supported by surveys covering rental days, fees, utilization, booking behavior, and demand from passenger and delivery users. The findings validate public fleet signals, fill gaps in city-level data, and test assumptions on battery life, downtime, and policy effects. Conflicting responses are reviewed and experts are re-contacted when a change could materially affect the model.
Distribution of primary research fieldwork respondents
| Company type | Respondent position |
|---|---|
| Top tier: 27% | CXOs: 14% |
| Mid tier: 50% | Functional/Unit leaders: 31% |
| Smaller Players: 23% | Managers: 55% |
Market-Sizing & Forecasting
We sized the market mainly using a top-down demand pool build that starts from the active shared-mobility user base in key Indian cities, then filters by e-bike rental penetration and the share of trips that shift to paid rental plans. After setting this backbone, we ran selective bottom-up checks using sampled city-level fleet counts, observed price cards (hourly, daily, and monthly plans), and utilization ranges provided by operators, and then reconciled totals when the differences indicated a gap.
Key model inputs included active fleet and deployment density by city, average rides or rental days per bike, typical pricing by plan duration, seasonality linked to tourism and weather months, share of B2B delivery usage versus consumer commuting, and battery type mix that affects downtime and replacement cycles. For forecasting, we ran scenario analysis, since adoption is sensitive to policy support, charging and swapping access, and unit economics that depend on utilization. Where operator data was incomplete, we used conservative ranges for utilization and pricing, and then tightened them after re-checks with field respondents so the resulting series remains reproducible.
Data Validation & Update Cycle
Outputs were checked against independent signals such as city expansion announcements, visible fleet rollouts, rental price movements, and reported utilization ranges from multiple respondent types. Variances were reviewed in steps, first by the analyst building the model, then through internal review that tests whether each assumption can be traced back to a clear source or an interview input.
If a large mismatch is seen across cities, or if a major policy or funding event shifts likely deployment plans, respondents are re-contacted to confirm what changed and how quickly it is flowing into revenue. Reports are refreshed annually, and interim updates are made when a material market event occurs. Before delivery, a final pass is done so clients receive the latest updated view of the market.
Mordor Intelligence's Indian E Bike Rental Market Size Versus Other Published Estimates
It is common to see different market values for India e-bike rentals because authors do not always count the same services, and the use of different years and conversion assumptions can move the number. Some estimates also mix rental revenue with adjacent models such as fleet leasing for delivery or broader bike sharing, which changes the total even if the growth story appears similar.
Registration and policy signals, along with operator pricing cards and utilization checks, are the evidence that ties Mordor Intelligence's estimate to rental revenue earned from active e-bike fleets operating within India's defined rental window, instead of folding in wider two-wheeler rental or vehicle sales value. Differences usually come down to whether B2B delivery contracts are treated as rentals or as fleet services, how aggressive a utilization uplift is assumed, and whether pricing is modeled as a steady average or allowed to vary by city and plan duration.
Benchmark comparison
| Source | Market Size | Gaps in Research Methodology |
|---|---|---|
| Mordor Intelligence | USD 8.13 M (2026) | |
| Industry Research Firm A | USD 6.85 M (2026) | Uses narrower city coverage and applies conservative utilization assumptions, and it often excludes B2B delivery-linked rental revenue that is still billed as a rental plan. |
| Mobility Insights Publisher B | USD 11.40 M (2026) | Appears to include adjacent shared bike programs and longer-term fleet access models, and it assumes faster price and utilization uplift without consistent cross-checks to active fleet deployment signals. |
Overall, the spread is mainly explained by scope boundaries and the way utilization and pricing are handled across Indian cities. When the counted revenue is kept strictly to paid e-bike rentals, and key assumptions are checked against fleet activity and plan-level pricing, the resulting market size stays easier to track and update year after year.


Key Questions Answered in the Report
What is the current value of the Indian electric bike rental market?
The market is valued at USD 8.13 million in 2026 and is forecast to reach USD 14.3 million by 2031.
How fast is the segment serving cargo and logistics growing?
Cargo & Logistics rentals are projected to record a 12.09% CAGR between 2026 and 2031 on the back of e-commerce demand.
Which battery technology dominates rental fleets?
Lithium-ion batteries command 85.63% of 2025 fleet installations thanks to their high energy density and rapid charge traits.
Why are ≤250 W e-bikes so prevalent in India?
Models at or below 250 W avoid license and registration requirements, reducing onboarding friction for riders and operators.
What policy changes could most influence market growth?
Delhi’s proposed gasoline two-wheeler ban from August 2026 and expansive state-level subsidies will likely accelerate adoption nationwide.
Page last updated on:


 Your data is secure and never sold or shared.


