United States Hyperscale Data Center Market Size and Share
Market Overview
| Study Period | 2025 - 2031 |
|---|---|
| Forecast Data Period | 2025 - 2031 |
| Historical Data Period | |
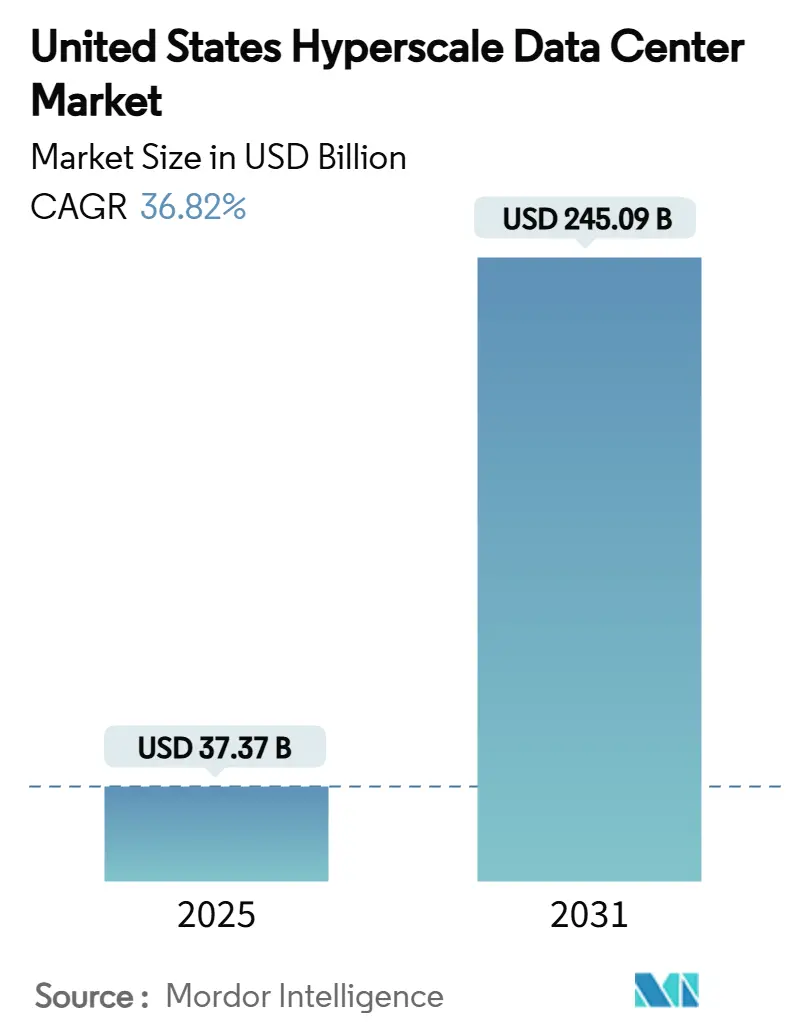
| Market Size (2025) | USD 37.37 Billion |
| Market Size (2030) | USD 245.09 Billion |
| Growth Rate (2025 - 2031) | 36.82% CAGR |
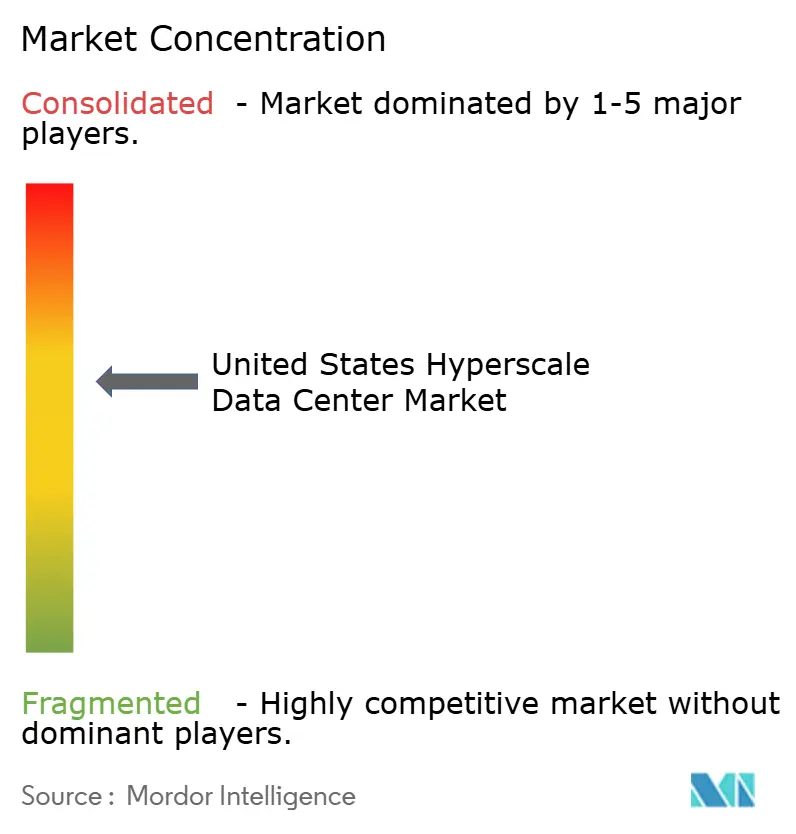
| Market Concentration | Medium |
Major Players *Disclaimer: Major Players sorted in no particular order Image © Mordor Intelligence. Reuse requires attribution under CC BY 4.0. | |
United States Hyperscale Data Center Market Analysis by Mordor Intelligence
The United States hyperscale data center market size stood at USD 37.368 billion in 2025 and is forecast to reach USD 245.091 billion by 2031, registering a robust 36.82% CAGR over the period. The revenue curve is climbing faster than installed IT load, which is projected to expand from 33.589 thousand MW in 2025 to 73.752 thousand MW by 2031, a 14.01% CAGR that underscores how higher rack-power densities not merely floor space are driving value creation. Operators are re-architecting facilities around liquid-cooled racks exceeding 50 kW, advancing direct-to-chip solutions, and upgrading switchgear to support 32 amp branch circuits for GPU clusters. Competitive momentum is intensifying as self-build giants scale campus projects while colocation specialists chase AI-ready footprints, prompting an uptick in strategic alliances and equity injections topping USD 35 billion since late 2024. Regional growth pockets are shifting westward to Arizona and Nevada where tax incentives, renewable power and drier climates suit next-gen cooling strategies, even as Virginia’s I-95 corridor remains the global traffic core. Policy pressures around water use, Scope 3 disclosures and grid curtailment are simultaneously compelling innovation in closed-loop cooling and nuclear-backed power purchase agreements.
Key Report Takeaways
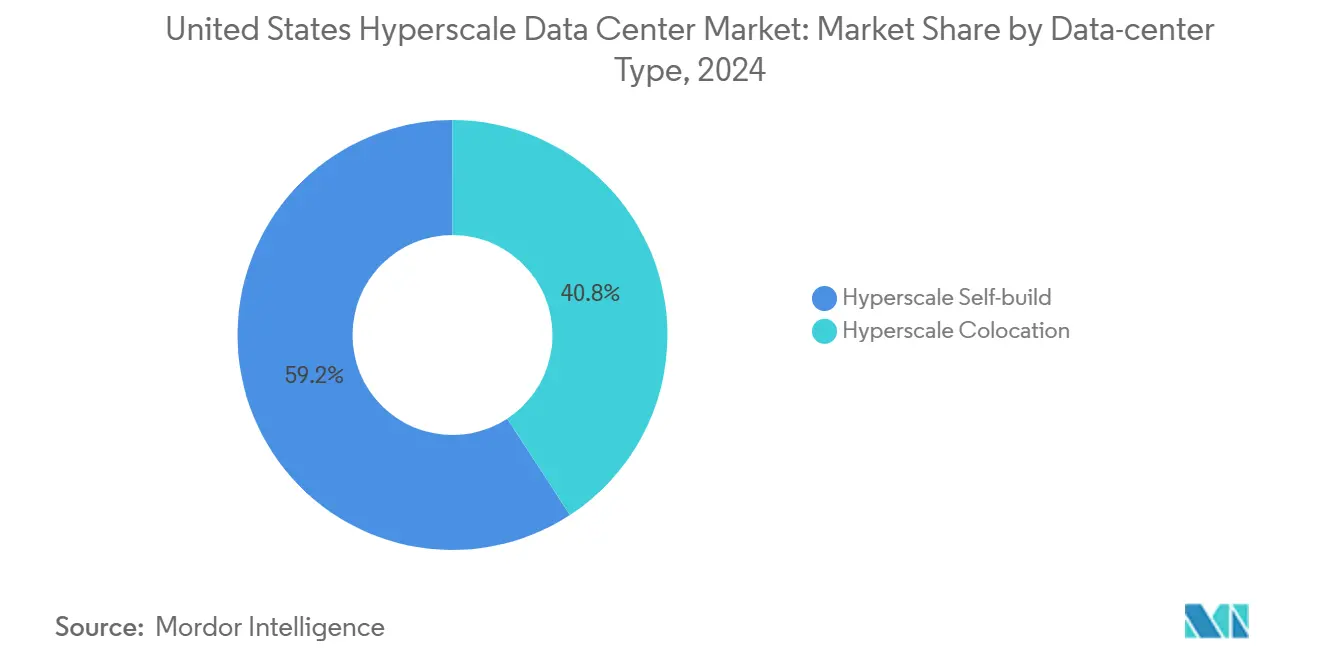
- By data center type, self-build facilities captured 59.20% of the United States hyperscale data center market share in 2024, whereas hyperscale colocation is projected to grow at 12.8% CAGR through 2031.
- By component, IT infrastructure led with 41.20% revenue share in 2024 while DCIM/BMS solutions are advancing at a 13.7% CAGR to 2031.
- By tier standard, Tier III sites held 70.40% share in 2024 whereas Tier IV deployments post an 11.4% CAGR forecast to 2031.
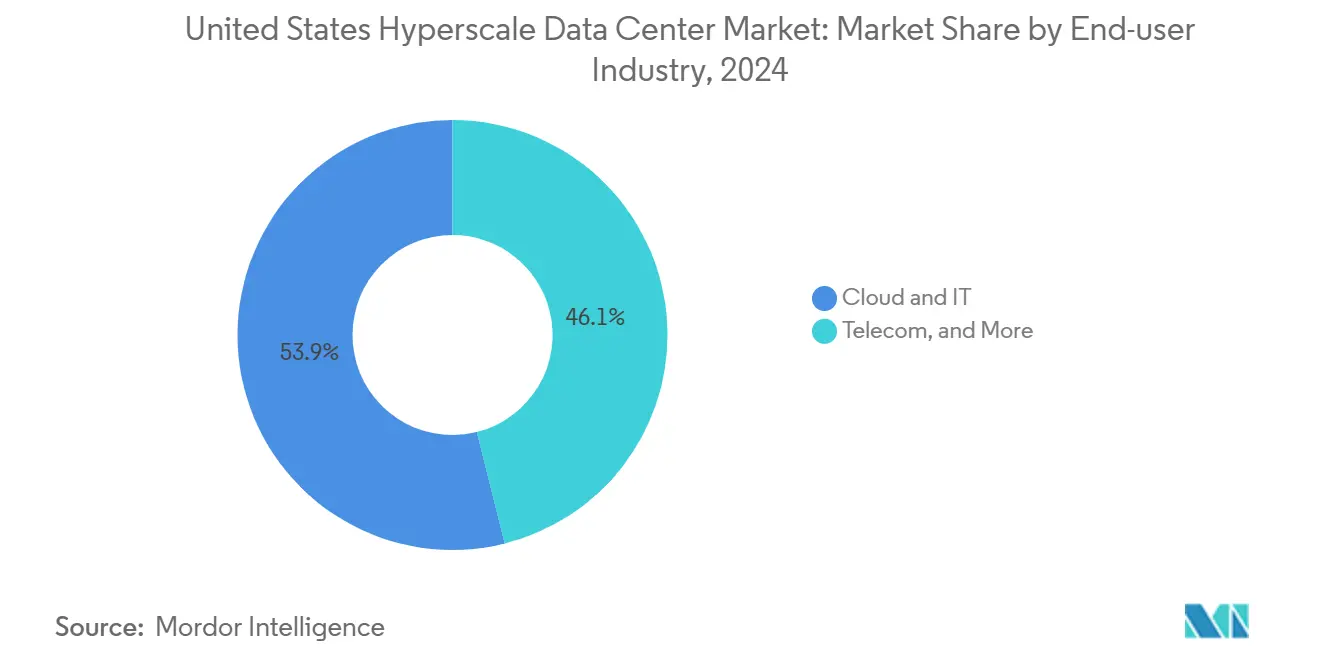
- By end-user industry, cloud and IT accounted for 53.90% of 2024 value, while the government segment is set to expand at 14.90% CAGR on sovereign-cloud mandates.
- By data center size, massive data center controlled 42.10% revenue in 2024; mega-scale campuses (>60 MW) are on track for a 15.20% CAGR to 2031.
- By geography, the South US region carried 34.60% share in 2024, while the West US leads future growth at 13.30% CAGR through 2031.
Global valuation is built by aggregating outputs from multiple countries and regions, with United states being one of the contributors. Our global hyperscale data center market size represents that cumulative total.
United States Hyperscale Data Center Market Trends and Insights
Drivers Impact Analysis*
| Driver | (~) % Impact on CAGR Forecast | Geographic Relevance | Impact Timeline |
|---|---|---|---|
| AI/ML rack-power density explosion | +8.50% | West and South US primary clusters | Short term (≤ 2 years) |
| Public-sector sovereign-cloud zones | +4.20% | National, Virginia and Texas hubs | Medium term (2-4 years) |
| 5G edge-core convergence | +3.80% | Nationwide, Midwest and Northeast | Medium term (2-4 years) |
| GenAI inference campus cooling | +7.10% | West and South US | Short term (≤ 2 years) |
| SMR-backed green PPAs | +2.90% | Pilot projects in multiple states | Long term (≥ 4 years) |
| Tax-incentive fast-track corridors | +3.70% | Texas, Georgia, Ohio | Medium term (2-4 years) |
| Source: Mordor Intelligence | |||
AI/ML Rack-Power Density Explosion Drives Infrastructure Transformation
Rack densities crossing 50 kW have turned legacy air-cooling into a liability, prompting wholesale adoption of liquid loops and immersion baths. Google’s 1 MW liquid-cooled rack stack highlights a 20-fold leap over conventional designs. Mechanical rooms now integrate redundant heat exchangers, reinforced raised floors and dielectric fire suppression to manage concentrated thermal loads. Power distribution is shifting toward overhead busways that accommodate 277-480 V feeds at 50 amps per whip, supporting the United States hyperscale data center market’s pivot to AI-first architectures. Supply-side innovation is visible in Supermicro’s turnkey coolant distribution units packaged with Nvidia H100 trays, shrinking deployment cycles by four weeks [1]Supermicro, “Supermicro Delivers Liquid Cooling Solutions for xAI Colossus Supercomputer,” supermicro.com. Real-time telemetry feeds DCIM algorithms that dynamically adjust pump speeds and rack fan curves, elevating energy savings while maintaining outlet-air ≤ 35 °C.
Public-Sector Sovereign-Cloud Zones Accelerate Secure Infrastructure Demand
Defense mandates such as JWCC stipulate FedRAMP High and Impact Level 6 controls, driving isolated halls with electromagnetic shielding, U.S.-citizen staffing and biometric tri-factor access [2]Citrix Systems, “Citrix Cloud Government Achieves FedRAMP High Authorization,” citrix.com. Virginia’s and Texas’ dedicated government availability zones are shaping a specialized carve-out within the United States hyperscale data center market that blends hyperscale economics with classified-grade security. Growth is buttressed by state initiatives: California’s Natural Resources Agency now runs a sovereign-cloud pod to keep geospatial and wildfire records onshore, a model being replicated across 14 other agencies. Higher compliance overhead is spawning demand for DCIM tools capable of continuous configuration verification and zero-trust micro-segmentation, elevating the software portion of new-build CAPEX by up to 7%.
5G Edge-Core Convergence Expands Secondary-Market Opportunities
Telecom tower owners such as American Tower are co-locating 500 kW prefabricated edge boxes at macro sites to shave latency below 10 ms for AR streaming and vehicle-to-eveything workloads. Hyperscalers tether these edge nodes via dark fiber to central training clusters, forming an integrated mesh where data in-flight is minimized. Midwest metros like Columbus and St. Louis are emerging build targets, reflecting how the United States hyperscale data center market is diffusing beyond coastal strongholds. Cogent Communications’ lit-building program folds 400G wave services into edge POPs, ensuring deterministic throughput for AI inference bursts. Operators report revenue uplift of 12-14% on racks running real-time analytics compared with batch-processing bays.
GenAI Inference Clusters Demand Campus-Scale Liquid Cooling
Generative AI inference requires low-latency, high-throughput clusters often exceeding 40,000 GPUs per campus. CoreWeave’s 420% year-over-year revenue spike validates this form factor as it builds multi-building compounds with centralized chilled-water plants and dedicated 230 kV substations. Colocated liquid coolers slash in-rack energy by 30% versus air, enabling PUE targets of 1.10 even during summer peaks. The United States hyperscale data center market is witnessing record land acquisitions of 200+ acres to host such campuses, a scale that facilitates on-site solar arrays and fuel-cell peakers. Robust looped distribution allows hot-swap of coolant distribution units without downtime, satisfying Tier IV maintainability requirements and lowering unplanned outage risk below 0.4 hours per year.
Restraints Impact Analysis*
| Restraint | (~) % Impact on CAGR Forecast | Geographic Relevance | Impact Timeline |
|---|---|---|---|
| Water-use restrictions on evaporative cooling | -2.80% | California and Arizona | Short term (≤ 2 years) |
| GPU/optic supply-chain bottlenecks | -4.10% | All US regions | Short term (≤ 2 years) |
| Heat and carbon levies | -1.90% | New York and California | Medium term (2-4 years) |
| Local grid curtailment rules | -3.20% | Texas and California | Medium term (2-4 years) |
| Source: Mordor Intelligence | |||
Water-Use Restrictions Constrain Cooling Strategies
Severe drought conditions have spurred counties from Phoenix to Santa Clara to cap evaporative make-up water at 4 liters per kWh of IT load, a threshold most legacy chillers breach [3]Arizona Department of Water Resources, “Water Management Regulations,” azwater.gov. Operators now pivot to closed-loop adiabatic systems and rear-door heat exchangers that trim consumption by up to 80%, albeit at 15-20% higher CAPEX. These policies dent short-term margins yet catalyze innovation in liquid-to-air heat-recovery units capable of feeding district heating loops.
GPU Supply-Chain Bottlenecks Stall AI Builds
Scarcity of Nvidia H100s and HBM3 memory has extended delivery lead times to 12-18 months, freezing 2.5 GW of planned capacity nationwide. Secondary impacts ripple through optics as 1.6 Tbps coherent modules face substrate shortages, delaying spine upgrades. Companies hedge by ordering AMD MI300 accelerators yet still grapple with liquid-block compatibility variances. Copper futures touched USD 5.02 per pound in mid-2024, inflating bus-duct bids by 11% year-over-year.
*Our forecasts treat driver/restraint impacts as directional, not additive. The impact forecasts reflect baseline growth, mix effects, and variable interactions.
Segment Analysis
By Data Center Type: Self-Build Dominance Faces Colocation Acceleration
Self-build projects remained the backbone of the United States hyperscale data center market, responsible for 59.20% revenue in 2024 as operators prioritized bespoke layouts, proprietary optical fabrics and private substation ownership. Hyperscalers leveraged this control to deploy 800G DR8 optical transceivers six months ahead of colocation peers, shaving network hop latency by 12 µs. Yet the cost to integrate liquid cooling, hardened floors and triple-redundant switchgear now pushes all-in build costs above USD 12.5 million per MW, sparking a 12.8% CAGR surge in colocation as a capital-light alternative.
Colocators such as Digital Realty pre-install shared coolant distribution systems and offer rack densities up to 85 kW, enabling enterprises to ride the AI wave without nine-figure capex outlays. Service-level agreements embed coolant loop redundancy guaranteed at 99.999% availability, a feature once exclusive to bespoke builds. This hybrid landscape is fostering joint-venture models where operators co-own shell space but outsource facility management to colocation specialists.


By Component: IT Infrastructure Leadership Challenged by DCIM Innovation
IT hardware accounted for 41.20% of 2024 spend as Nvidia HGX trays, AMD EPYC Genoa processors and NVMe drives dominated procurement cycles. However DCIM/BMS software, though a smaller slice, is climbing at 13.7% CAGR as AI workloads demand granular telemetry and automated remediation. Contemporary platforms ingest 60,000 data points per rack every 15 seconds, allowing predictive adjustments that cut chilled-water flow by 9% without thermal excursions.
Electrical systems are also undergoing redesign; lithium-ion UPS strings now ship with AI-based state-of-health algorithms that extend life cycles by three years. Mechanical line items show the quickest inflation, with coolant economizers and dielectric immersion tanks posting 18% price increases due to stainless-steel shortages. The United States hyperscale data center market size for mechanical infrastructure is projected to reach USD 54 billion by 2031, reflecting both volume and technology premium.
By Tier Standard: Tier III Dominance Faces Tier IV AI Demands
Tier III still dominates at a 70.40% share, leveraging concurrent maintainability for most cloud applications. Yet mission-critical AI training cycles are nudging budgets toward Tier IV, which promises fault-tolerant topologies with 2N cooling, isolated distribution paths and 96-hour diesel autonomy. Operators calculate that a failed training run can waste USD 30 million in GPU-hours, dwarfing the 15% incremental CAPEX needed for Tier IV.
Designers embed dual coolant plants with cross-connect valves that sustain flow even during pump swap-outs, while fiber meshes feature physically diverse duct banks to satisfy stringent availability targets. PUE remains competitive because modern Tier IV layouts integrate variable-speed drives and thermal-store tanks that shift load off-peak, counterbalancing redundancy overhead.
By End-User Industry: Cloud Dominance Meets Government Acceleration
Cloud and IT providers such as AWS, Azure and Google Cloud represented 53.90% of 2024 demand, scaling generative AI APIs that now contribute up to 12% of total cloud revenue. The United States hyperscale data center market size for government applications is forecast to climb to USD 27 billion by 2031 on a 14.90% CAGR, spurred by zero-trust mandates and classified data repatriation. BFSI firms pursue AI-driven fraud analytics, reserving dedicated pods with ultralow jitter for high-frequency trading.
Manufacturers are piloting digital twins that mirror factory floors in real time, requiring GPU clusters co-located with MES back-ends. Telecom companies, meanwhile, integrate edge colocation to host virtual RAN and network slicing management, tightening synergy between 5G rollouts and core hyperscale centers. Such cross-industry adoption cements the United States hyperscale data center market as a foundational layer of national digital competitiveness.

By Data Center Size: Massive Facilities Lead Mega-Scale Expansion
Massive-scale sites retained 42.10% share thanks to right-sized risk profiles and incremental phasing agility. Even so, the mega-scale category (>60 MW) is sprinting at 15.20% CAGR, propelled by GPU clusters exceeding 100,000 accelerators that benefit from campus-level network fabrics. Mega campuses optimize capex through shared utility corridors, on-site 400 MVA substations and central liquid plants feeding multiple buildings via concentric steel mains.
Examples include CoreWeave’s USD 6 billion Lancaster project, targeting 90 MW IT load across three halls and shipping cooled glycol back to a 62,000 ton central chiller block. These builds negotiate direct interconnect agreements with transmission operators, bypassing retail tariffs and unlocking 15% energy savings against city-center sites.
Geography Analysis
The South US accounted for 34.60% revenue in 2024, anchored by Northern Virginia’s density where 70% of global internet traffic transits Ashburn cross-connects. Dominion Energy plans 11 GW of additional generation by 2031 to serve data-center loads, demonstrating public-private coordination depth. Georgia extends tax abatements through 2035, lifting project IRRs by 2 percentage points. Texas leverages deregulated ERCOT markets and its 15 GW wind fleet to attract operators eyeing renewable PPAs despite grid intermittency caps.
The West US shows the fastest climb with a 13.30% CAGR outlook. Arizona’s cooler desert nights and aggressive incentives cut chiller hours and accelerate permitting, causing build square footage to surge 76% in 2024. California advances carbon-neutral agendas through SB-253, prompting adoption of on-site solar-plus-storage microgrids and fuel-free backup stacks to avoid diesel bans. Emerging nodes in Nevada and Utah offer abundant land, 230 kV backbone access and seismic-resistant plateaus attractive for mega campuses.
Northeast and Midwest corridors post steady expansion tied to financial trading, logistics and manufacturing digitization. Chicago’s inventory climbed 20.6% in 2024 amid sub-2% vacancy, underpinned by contiguous parcel availability and 345 kV tie-ins. New York’s Local Law 97 charges press operators toward upstate locations with hydro-backed power, while Michigan offers 100% renewables on-ridgeline wind deals. Overall, regional diversification mitigates single-grid exposure and spreads talent pools across the United States hyperscale data center market.
Coverage of the hyperscale data center market by Mordor Intelligence spans a wide geographic footprint, with regional analysis available for Africa, South America, and Asia, alongside detailed country-level intelligence for Mexico, Brazil, South Africa, Taiwan, Spain, and Netherlands, each shaped by local operating conditions.
Competitive Landscape
The United States hyperscale data center market is moderately concentrated, with the top five operators—AWS, Microsoft, Google, Meta and Apple—estimated to control roughly 62% of installed IT load through a mix of self-build and strategic colocation leases. These players deepen vertical integration by contracting directly with transformer and switchgear OEMs, thereby front-running lead-time bottlenecks. Colocation majors such as Equinix, Digital Realty and CyrusOne respond with AI-optimized halls featuring 85 kW racks, dielectric coolant baths and 800G fabrics, catalyzing an ecosystem of coolant additive vendors and graphite TIM suppliers.
Strategic maneuvers center on capital deployment: Vantage’s USD 9.2 billion equity raise and Aligned’s USD 12 billion funding round in early 2025 exemplify investor appetite for AI-ready assets with 20-year yield visibility. M&A activity continues as smaller players armed with entitlement landbanks but lacking build capital become targets for private-equity backed consolidators. Operators also fortify supply resilience by booking multiyear GPU allotments and co-developing HBM packaging lines with silicon fabs.
Technology differentiation pivots on thermal solutions and automation. Patent trends show a rise in plate-to-chip fluid couplers and coolant dielectric formulations. AI-driven BMS suites now execute closed-loop set-point control, trimming energy spend by 6-8% year-on-year. Sustainability remains a competitive signal; AWS’s nuclear-powered Pennsylvania campus and Switch’s LEED-Platinum Las Vegas site headline the race to sub-1.1 PUE. As regulatory scrutiny escalates, operators embed life-cycle carbon dashboards into tenant portals, providing granular emissions accounting.
United States Hyperscale Data Center Industry Leaders
Amazon Web Services, Inc. (AWS)
Microsoft Corporation
Google LLC
Meta Platforms Inc.
Digital Realty Trust Inc.
- *Disclaimer: Major Players sorted in no particular order

Recent Industry Developments
- May 2025: Microsoft Corporation announced plans to invest approximately USD 80 billion in AI-powered data centers for fiscal year 2025. Over 50% of this funding is allocated to facilities within the United States. This initiative represents the company's largest annual capital expenditure to date, emphasizing the extensive infrastructure required to manage AI operations.
- April 2025: Amazon Web Services (AWS) announced plans to invest approximately USD 11 billion in Georgia to develop new data center facilities. This initiative highlights the company's strategic focus on expanding its infrastructure in regions offering advantageous power resources and regulatory frameworks. The investment underscores AWS's long-term commitment to enhancing its global operational capabilities.
- February 2025: Meta Platforms, Inc. announced plans to invest approximately USD 60-65 billion in developing advanced data center infrastructure. This initiative focuses on creating facilities specifically designed to support artificial intelligence workloads, reflecting the company's commitment to accelerating its AI advancements.
- January 2025: OpenAI, Microsoft Corporation, and their collaborators have introduced the Stargate Project, a groundbreaking initiative to invest USD 500 billion over four years in developing AI data centers. With USD 100 billion allocated for 2025, this effort signifies an unparalleled commitment to advancing specialized AI infrastructure on a massive scale.
- August 2024: Alphabet Inc.'s Google has significantly expanded its artificial intelligence (AI) training infrastructure in Iowa. The Council Bluffs campus is nearing an IT capacity of 300 MW, with projections indicating it will exceed 500 MW by 2025. This development highlights the immense scale of resources required to support AI advancements.
- April 2025: CoreWeave, Inc. has raised approximately USD 650 million to accelerate its growth in the GPU cloud industry. This funding strengthens its position as a leading provider of high-performance computing infrastructure, specifically designed for artificial intelligence applications.


Research Methodology Framework and Report Scope
Market Definitions and Key Coverage
Our study defines the United States hyperscale data center market as revenue generated from new-build or fully refurbished campuses that deliver at least 20 MW of critical IT load under a single ownership block, whether self-built by cloud providers or delivered as wholesale colocation. This scope captures site preparation, powered-shell fit-outs, electrical and mechanical infrastructure, racks, and integrated DCIM software.
Edge micro-sites below 5 MW and retrofit projects limited to server refresh without power or cooling upgrades are omitted to keep the focus on true hyperscale campuses.
Segmentation Overview
- By Data Center Type
- Hyperscale Self-build
- Hyperscale Colocation
- By Component
- IT Infrastructure
- Server Infrastructure
- Storage Infrastructure
- Network Infrastructure
- Electrical Infrastructure
- Power Distribution Unit
- Transfer Switches and Switchgears
- UPS Systems
- Generators
- Other Electrical Infrastructure
- Mechanical Infrastructure
- Cooling Systems
- Racks
- Other Mechanical Infrastructure
- General Construction
- Core and Shell Development
- Installation and Commissioning
- Design Engineering
- Fire, Security and Safety Systems
- DCIM / BMS Solutions
- IT Infrastructure
- By Tier Standard
- Tier III
- Tier IV
- By End-user Industry
- Cloud and IT
- Telecom
- Media and Entertainment
- Government
- BFSI
- Manufacturing
- E-Commerce
- Other End Users
- By Data Center Size
- Large (Less than equal to 25 MW)
- Massive (Greater than 25 MW and less than equal to 60 MW)
- Mega (Greater than 60 MW)
- By Geography
- Northeast US
- Midwest US
- South US
- West US
Detailed Research Methodology and Data Validation
Primary Research
Mordor analysts interviewed design-build contractors in Northern Virginia, power utilities in Texas and Arizona, and procurement leads at three hyperscale operators. These conversations validated assumed capex ranges, supply-chain lead times, and realistic commissioning schedules across U.S. regions.
Desk Research
We began with industry statistics from the U.S. Energy Information Administration, Federal Energy Regulatory Commission filings, and state utility tariff dockets, which map grid additions, average $/kW tariffs, and PUE norms. Public trade groups such as the Data Center Coalition and the Open Compute Project offered insight on rack power-density migration and liquid-cooling adoption. SEC 10-Ks and quarterly transcripts from leading operators supplied capex per MW and build cadence, while patent analytics from Questel highlighted innovation in immersion cooling valves. Dow Jones Factiva and D&B Hoovers rounded out deal flow and land-bank disclosures. The sources listed are illustrative; many other public documents supported data collection and clarification.
Market-Sizing & Forecasting
A top-down capacity-reconstruct model converts installed IT load (MW) by region into revenue using weighted average capex per MW and phased draw-down curves, and results are cross-checked with a selective bottom-up roll-up of announced campus pipelines and sampled ASP × volume contracts. Key variables include grid interconnection queue length, median rack density, liquid-cooling penetration, land cost per acre, and utility PPA price trends. Multivariate regression with scenario analysis (baseline, supply-chain delay, demand surge) projects through 2031, while gaps in bottom-up disclosures are bridged using operator spend ratios from prior filings.
Data Validation & Update Cycle
Outputs pass variance checks against third-party capacity trackers, intra-team peer review, and anomaly flags before sign-off. Reports refresh annually; material events such as a >500 MW campus approval trigger interim updates, and a final analyst sweep ensures each delivery reflects the freshest view.
Why Mordor's United States Hyperscale Data Center Baseline Is Trusted
Published estimates often diverge because firms choose different facility-size thresholds, classify refurbishment spend inconsistently, or update models on uneven schedules.
Key gap drivers here include some publishers bundling sub-5 MW edge pods with hyperscale totals, others baking in land value at assessed rather than transactional prices, and a few applying historical 8-10 kW rack density even as operators push beyond 50 kW, inflating or understating totals. Mordor's baseline anchors on clearly disclosed ≥20 MW projects, uses contemporaneous ASPs from live bids, and refreshes yearly, yielding a balanced, repeatable view.
Benchmark comparison
| Market Size | Anonymized source | Primary gap driver |
|---|---|---|
| USD 37.37 B (2025) | Mordor Intelligence | - |
| USD 188.61 B (2024) | Global Consultancy A | Includes micro edge and refurbishment spend, uses book value land costs |
| USD 17.5 B (2024) | Industry Association B | Counts only colocation revenue, omits self-build hyperscale projects |
| USD 29.94 B (2023) | Regional Consultancy C | Applies flat 6 % CAGR without AI-driven rack-density adjustments |
In sum, the disciplined scope selection, dual-path modeling, and frequent refresh cadence give decision-makers a dependable baseline that mirrors on-the-ground build economics and evolving AI workloads better than sporadic, one-dimensional estimates in the market.


Key Questions Answered in the Report
How fast is the United States hyperscale data center market growing?
The market is projected to expand from USD 37.37 billion in 2025 to USD 245.09 billion by 2031 at a 36.82% CAGR, driven mainly by AI infrastructure demand.
Which region will post the highest growth?
The West US is forecast to lead with a 13.30% CAGR through 2030 thanks to Arizona’s AI-centric build incentives and abundant land availability.
Why are rack-power densities increasing?
AI and machine-learning workloads require GPU-intensive racks exceeding 50 kW, prompting adoption of liquid cooling and higher-voltage power distribution.
What is the main challenge to capacity expansion?
GPU and optical transceiver supply shortages have extended delivery times up to 18 months, delaying 2.5 GW of planned capacity.
How are operators addressing sustainability regulations?
Strategies include closed-loop cooling to curb water use, nuclear or renewable PPAs to cut carbon footprints, and advanced DCIM tools for real-time efficiency optimization.
Which facility tier is gaining traction for AI workloads?
Tier IV builds are rising at 11.4% CAGR because fault-tolerant architectures minimize costly interruptions during long AI training jobs.
Page last updated on:


