
AI Computing Hardware Market Size and Share
Market Overview
| Study Period | 2020 - 2031 |
|---|---|
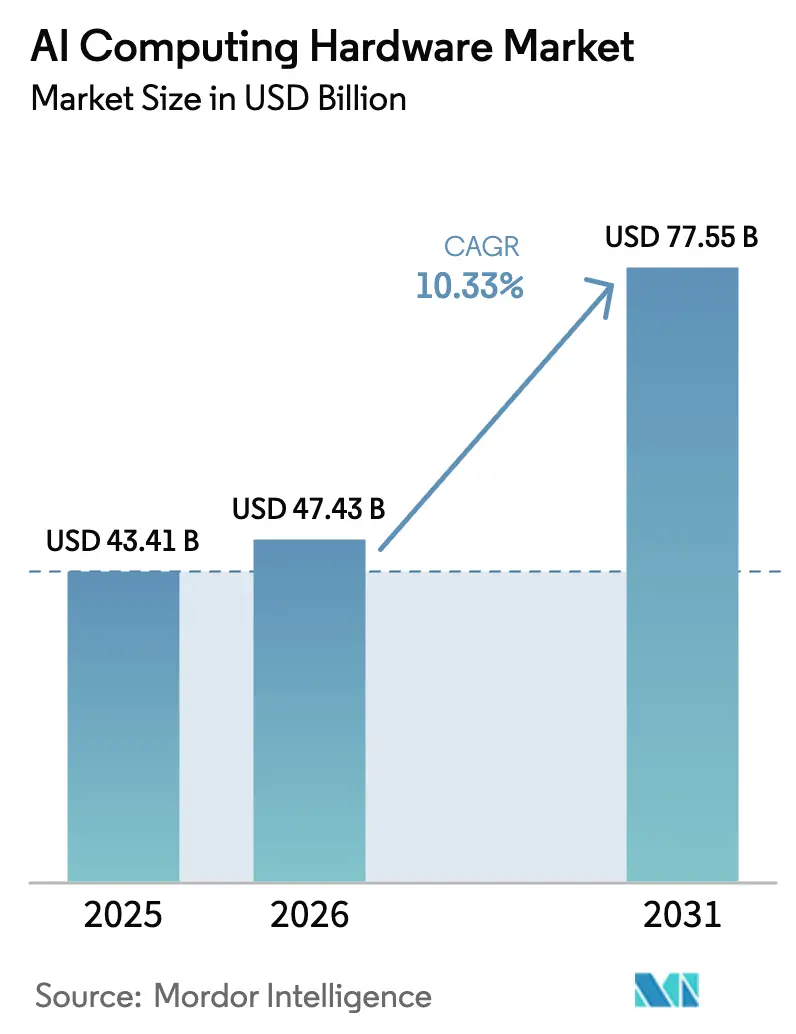
| Market Size (2026) | USD 47.43 Billion |
| Market Size (2031) | USD 77.55 Billion |
| Growth Rate (2026 - 2031) | 10.33 % |
| Fastest Growing Market | Asia Pacific |
| Largest Market | North America |
| Market Concentration | Low |
Major Players *Disclaimer: Major Players sorted in no particular order Image © Mordor Intelligence. Reuse requires attribution under CC BY 4.0. | |
AI Computing Hardware Market Analysis by Mordor Intelligence
The AI Computing Hardware Market size is expected to increase from USD 43.41 billion in 2025 to USD 47.43 billion in 2026 and reach USD 77.55 billion by 2031, growing at a CAGR of 10.33% over 2026-2031.
Growth follows a clear shift in system design, as inference workloads dominate production deployments, reshaping capacity planning, infrastructure design, and accelerator selection. Capital spending by hyperscalers reinforces this trajectory, with large-scale programs centered on servers, accelerators, high-speed interconnects, and liquid cooling that support higher thermal design power at the rack. Annual product refresh cycles and the shift to integrated rack-scale systems enable operators to compress the time to deploy and standardize performance envelopes across regional sites. Power availability, memory supply, and export policies remain the primary friction points; however, long-term contracts and pre-committed power strategies help stabilize investment decisions in the AI computing hardware market. The AI computing hardware market continues to recalibrate around scalable, production-grade inference as the primary driver of recurring spend, and this emphasis on real-time serving is shaping thermal, networking, and memory design choices across operators. Rack-level integration and co-packaged optics are gaining traction as operators strive to reduce power per bit and enhance cluster resiliency in large-scale training and inference fabrics.[1] Strategic partnerships between chipmakers and platform providers underscore the long-term nature of AI buildouts, including commitments to multi-gigawatt deployments for next-generation systems. The AI computing hardware market therefore reflects both technical and operational shifts that align with large, contracted demand profiles across leading regions.
Key Report Takeaways
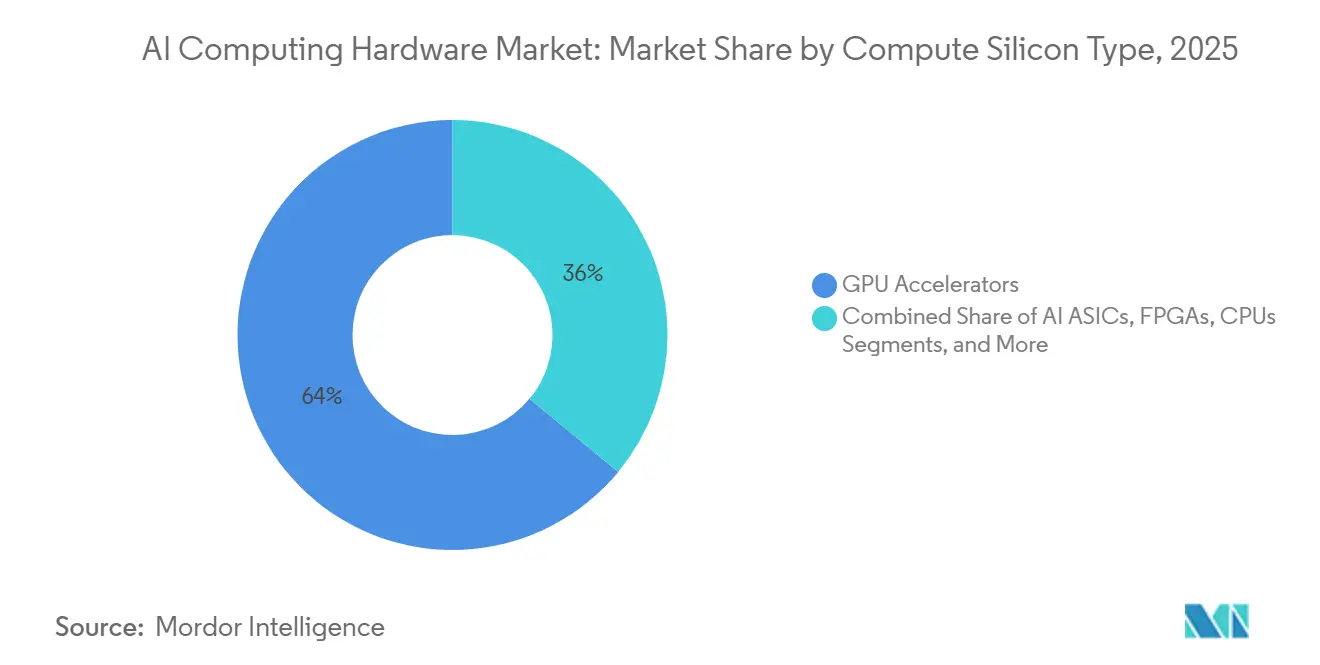
- By compute silicon type, GPU accelerators led with 64% revenue share in 2025, while AI ASICs are projected to expand at a 10.6% CAGR through 2031.
- By system form factor, AI servers accounted for a 78% share in 2025, and integrated rack-scale platforms posted the highest growth at a 10.7% CAGR through 2031.
- By deployment location, cloud data centers held a 44% share in 2025, while edge and endpoint sites grew at the fastest rate, with a 10.9% CAGR from 2026 to 2031.
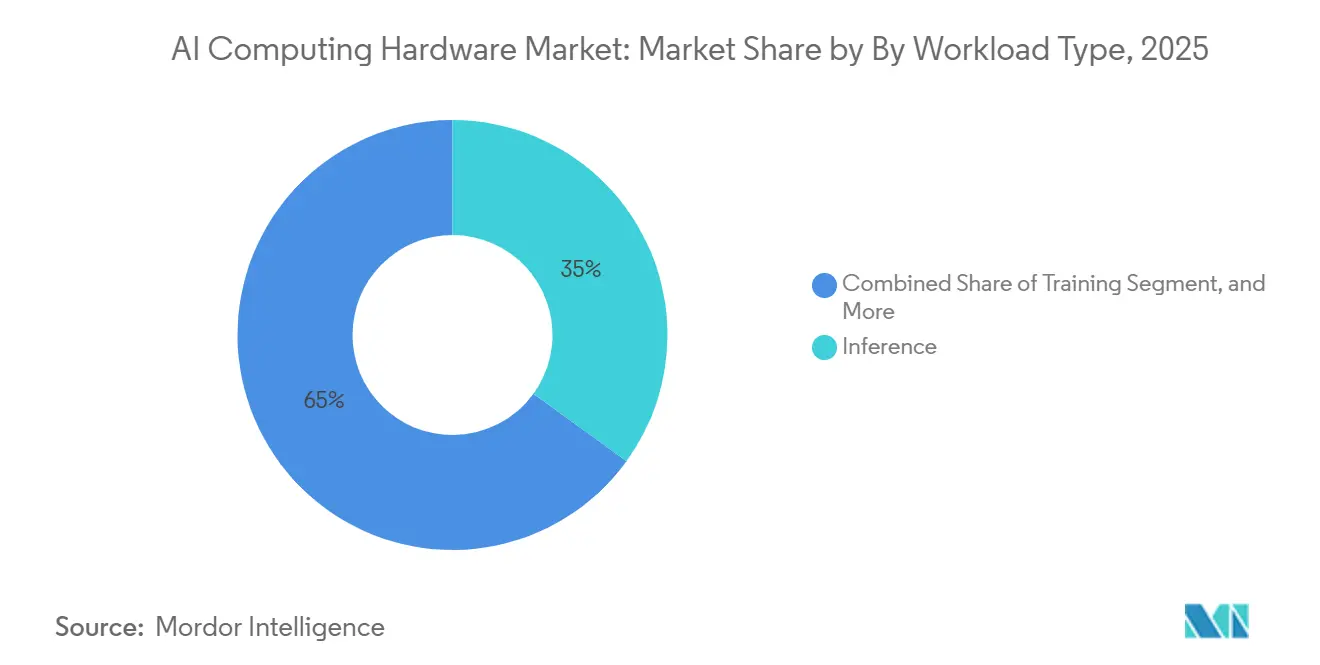
- By workload type, inference captured a 35% share in 2025 and is expected to advance at a 11.2% CAGR through 2031.
- By end-user industry, hyperscalers and cloud service providers accounted for 57.4% of spending in 2025, while healthcare and life sciences grew at a 10.9% CAGR through 2031.
- By geography, North America accounted for a 35.7% share in 2025, and Asia-Pacific leads growth at an 11.0% CAGR through 2031.
Note: Market size and forecast figures in this report are generated using Mordor Intelligence’s proprietary estimation framework, updated with the latest available data and insights as of January 2026.
Market Trends and Insights
Drivers Impact Analysis of AI Computing Hardware Market*
| Driver | (~) % Impact on CAGR Forecast | Geographic Relevance | Impact Timeline |
|---|---|---|---|
| Hyperscaler AI Infrastructure Capex Expansion | +3.2% | Global, concentrated in North America and Asia-Pacific hyperscale hubs | Medium term (2-4 years) |
| Shift From Training To Inference Increases Compute Volume | +2.8% | Global, with early gains in North America, Europe, and urban Asia-Pacific markets | Medium term (2-4 years) |
| Rapid Product Cadence In High-End AI GPUs and Rack-Scale Systems | +1.7% | Global, led by advanced semiconductor manufacturing nodes in Taiwan, South Korea | Short term (≤ 2 years) |
| Accelerated Servers Dominate AI Infrastructure Spending | +2.1% | Global, hyperscale data centers in Northern Virginia, Santa Clara, Singapore, Frankfurt | Medium term (2-4 years) |
| Co-Packaged Optics Adoption For High-Bandwidth Interconnects | +0.8% | Global, initial deployment in hyperscale AI clusters, North America and Europe lead | Long term (≥ 4 years) |
| Liquid Cooling Penetration Unlocks Higher-TDP AI Systems | +1.5% | Global, rapid adoption in China, North America, Northern Europe data center corridors | Short term (≤ 2 years) |
| Source: Mordor Intelligence | |||
Hyperscaler AI Infrastructure Capex Expansion Fuels Accelerator Demand
Hyperscaler capital programs continue to scale, with aggregate outlays crossing into the hundreds of billions for 2026 and growing year on year in the mid-thirties percent range. Momentum is centered on AI-specific infrastructure that includes servers with accelerators, high-speed networking fabrics, and liquid-cooled rack designs that sustain higher density per rack. Mega-deployments that commit to multi-gigawatt system footprints further validate the scale and durability of operator demand across training and inference use cases. Strategic alliances between platform vendors also concentrate investment in integrated solutions, including CPU platform collaborations that streamline scale-out deployments in AI clusters. Broadening adoption of liquid cooling and rack-scale assemblies reduces deployment friction by pre-integrating thermal and power subsystems for high-TDP accelerators.[2] The AI computing hardware market benefits from this acceleration in capital spending, as it transitions from pilot projects to scaled production footprints across multiple regions.
Inference Workload Shift Redefines Data Center Economics
The balance of compute cycles is shifting toward inference, which drives recurring consumption patterns and turns serving performance into the central design constraint for fleets. This change favors accelerators and systems tuned for cost per token, low latency, and efficient memory hierarchies, which differs from training-optimized profiles. Memory footprints and bandwidth become critical for rapid token generation, and new memory modules that shorten time to first token reinforce the value of memory-rich designs in production environments. The need to place inference closer to users also increases the attractiveness of smaller, regional deployments that balance latency and power availability without compromising reliability. Operator strategies now prioritize consistent rollouts of inference-capable capacity alongside training clusters to serve steady workloads. The AI computing hardware market reflects these priorities in both silicon roadmaps and integrated rack offerings that consolidate compute, memory, networking, and cooling.
Rapid GPU and Rack-Scale Product Cadence Compresses Refresh Cycles
Leading vendors are operating on accelerated update cycles for top-end accelerators and rack-scale systems, which compresses refresh planning to roughly annual horizons for large operators. Rack-scale platforms that integrate compute, high-bandwidth networking, and liquid cooling allow faster commissioning and offer consistent performance envelopes across facilities. Co-packaged optics is emerging in data center fabrics to reduce power per bit and improve system resiliency, and this direction is informing network design for both training and inference clusters. The cadence is supported by vertical partnerships that align CPU platforms with AI accelerators and related fabrics to simplify cluster integration.[3] As a result, operators evaluate full-stack solutions and pre-configured racks that reduce deployment complexity while supporting liquid-cooled, higher-TDP roadmaps. The AI computing hardware market therefore aligns capex cycles with rapid product introductions to maintain competitive performance and energy efficiency.
Accelerated Server Architectures Dominate AI Infrastructure Spending
Servers embedding GPUs and custom accelerators account for the lion’s share of new AI infrastructure spending as large transformer models and scale-out training require thousands of tightly networked accelerators. Pre-integrated rack systems from major vendors shorten lead times by combining compute, fabrics, and liquid cooling into uniform building blocks that can be replicated at scale. Multi-gigawatt deployment commitments by leading AI developers further reinforce that large, accelerator-rich clusters are the primary path to meet training and serving targets. At the same time, networking roadmaps that introduce co-packaged optics support the bandwidth and reliability required for all-reduce and real-time inference patterns within and across racks. The supporting ecosystem for power and cooling is responding with modular, serviceable designs that align with liquid-cooled racks exceeding 100 kilowatts per rack. As these pieces converge, the AI computing hardware market consolidates spend around accelerated servers, rack-scale architecture, and advanced interconnects.
Restraints Impact Analysis of AI Computing Hardware Market*
| Restraint | (~) % Impact on CAGR Forecast | Geographic Relevance | Impact Timeline |
|---|---|---|---|
| Power and Grid Constraints For AI Data Centers | -2.3% | Global, acute in PJM, ERCOT, Northern Virginia; emerging in Dublin, Frankfurt, Singapore | Long term (≥ 4 years) |
| Supply Constraints In HBM and Advanced Packaging | -1.9% | Global supply chain, manufacturing concentrated in South Korea (SK Hynix, Samsung), U.S. (Micron), Taiwan (TSMC CoWoS) | Medium term (2-4 years) |
| Export Controls and Tech Fragmentation | -0.7% | U.S.-China technology corridor, spillover effects in Europe, Japan, South Korea | Long term (≥ 4 years) |
| Serviceability and Ecosystem Complexity For Advanced Cooling | -0.4% | Global, most acute in retrofit scenarios for legacy facilities in Tier 1 metro data center markets | Medium term (2-4 years) |
| Source: Mordor Intelligence | |||
Power and Grid Constraints Throttle Deployment Velocity
Power availability and interconnection timelines shape where and how operators deploy AI capacity, and constraints in key metros are extending commissioning schedules for large campuses. To manage higher density and sustained load profiles, operators adopt liquid cooling and modular power architectures that align with higher-TDP accelerator roadmaps. Networking innovations such as co-packaged optics also help reduce the power penalty per bit, which indirectly eases facility-scale energy budgets at the margins. These measures do not remove siting challenges, yet they improve the performance-per-watt envelope for both training and inference clusters. The AI computing hardware market is therefore sensitive to regional grid dynamics and seeks standardization around integrated, liquid-cooled racks to ensure consistent thermal and electrical behavior. Large offtake commitments by AI platform leaders signal that long-term capacity planning is underway to mitigate grid bottlenecks through diversified siting and staged buildouts.
HBM and Advanced Packaging Supply Chain Bottlenecks Constrain Scaling
High-bandwidth memory and advanced packaging remain gating factors for accelerator shipments, and demand growth continues to pressure available capacity across near-term horizons. Memory density and bandwidth are central to inference efficiency, and new low-power modules marketed for AI servers are targeting faster time-to-first-token and improved performance per watt. Vendors are responding with design choices that balance SRAM, HBM, and interconnect topology to achieve higher throughput for token generation at predictable power budgets. Persistent tightness in packaging and memory supply guides customers toward longer-term procurement agreements and diversification strategies. As a result, the AI computing hardware market continues to calibrate system designs around memory availability while ramping new form factors that reduce service complexity in liquid-cooled deployments. Export regimes add another layer of planning complexity for cross-border sourcing of advanced accelerators and components, which increases the value of resilient local supply strategies.
*Our forecasts treat driver/restraint impacts as directional, not additive. The impact forecasts reflect baseline growth, mix effects, and variable interactions.
AI Computing Hardware Market Segment Analysis
By Compute Silicon Type:
Custom ASICs Challenge GPU Dominance Despite Inferior EcosystemsGPU accelerators are expected to account for the largest share in 2025 at 64%, supported by mature software stacks and trained engineering talent that keep switching costs high. AI ASICs post the fastest growth at a 10.6% CAGR through 2031 as large operators prioritize per-token efficiency and tighter workload alignment for production inference. Across the AI computing hardware market, hyperscaler-designed chips reduce reliance on merchant silicon and support optimization of power, memory, and networking at rack scale. FPGAs remain relevant at the edge for deterministic latency and field reconfigurability in safety and automation settings. NPUs embedded in client devices address privacy and latency for on-device tasks within tighter thermal and power budgets. CPUs continue to anchor control-plane duties, storage orchestration, and general-purpose tasks while handing heavy matrix workloads to attached accelerators.
ASIC momentum and GPU incumbency coexist as software ecosystems, with developer familiarity and vendor toolchains continuing to influence platform decisions. Interoperability standards in fabrics and networks have become important differentiators as buyers weigh vendor lock-in against cost, availability, and performance. The AI computing hardware market is also seeing interest in emerging architectures such as neuromorphic and photonic processors, though these efforts remain nascent. For memory-intensive inference, product choices emphasize high-bandwidth memory capacity and memory bandwidth to sustain throughput. As a result, platform selection now balances peak compute against memory, networking, and thermal characteristics that are relevant to real-time serving. AI accelerators from leading vendors anchor these decisions within rack-scale blueprints that unify compute, fabric, and cooling.

By System Form Factor:
Rack-Scale Integration Accelerates as Power Density Mandates Liquid CoolingAI servers held the dominant 2025 share at 78%, and integrated rack-scale solutions record the fastest growth at a 10.7% CAGR. GPU refresh cadence, memory requirements, and thermal envelopes push operators toward pre-integrated racks that deliver predictable performance and simplify commissioning in liquid-cooled environments. In 2025 to 2026, multiple vendors advanced rack-scale platforms that consolidate accelerators, networking, and cooling into standardized building blocks to streamline capacity additions. This approach reduces integration risk while aligning with site-level electrical and mechanical constraints. Within the AI computing hardware market, rack-level architectures also improve serviceability and reduce cabling complexity relative to bespoke system combinations.
Accelerator cards and modules remain important for retrofits and incremental upgrades in facilities that have yet to migrate to high-density racks. Edge devices and gateways fill latency-sensitive roles where low power budgets and compact footprints are essential. The AI computing hardware market benefits from vendor ecosystems that include reference designs, validated fabrics, and cooling solutions tuned to rack-level operation. As these platforms mature, purchasers value interoperability and standards participation that protect long-lived deployments. Vendors are pairing silicon roadmaps with liquid cooling and fabric strategies to ensure predictable performance across product generations. Co-packaged optics will play a growing role in top-of-rack and spine layers as data rates increase and operators focus on power per bit.
By Deployment Location:
Inference Migration to Edge Fragments Centralized Training FootprintCloud data centers account for a 44% share in 2025 as training and large inference clusters favor purpose-built sites with high power density and advanced networking. Edge and endpoint sites grow fastest at a 10.9% CAGR to 2031 as latency-sensitive inference moves closer to users in regional metros. In the AI computing hardware market, this distribution ensures low-latency serving for applications that require rapid token generation and local data handling. Operators pair centralized training footprints with distributed inference capacity to meet both development and production requirements. On-premises enterprise deployments support regulated workloads and data sovereignty mandates.
Legacy facilities continue to retrofit power and cooling to accommodate higher-density racks while new builds favor liquid-cooled designs from day one. The AI computing hardware industry is converging on rack-scale products that balance heat density, serviceability, and interoperable fabrics. Procurement now includes longer planning horizons for power and interconnection alongside multi-year arrangements for accelerators and memory. Strategic partnerships across vendors aim to reduce integration friction and align CPU, accelerator, and networking roadmaps. The AI compute hardware market therefore distributes capacity across core cloud hubs and edge sites while aligning facility design with serving and training roles.
By Workload Type:
Inference Dominance Reshapes Hardware Requirements Toward Cost per QueryInference holds a 35% workload share in 2025 and grows at an 11.2% CAGR, reflecting the continuous nature of serving workloads after initial model training. This reality drives design choices that value cost per token, throughput per watt, and time to first token. Memory density is a differentiator for hosting large-context models in fewer devices, and component vendors are introducing low-power modules that accelerate token generation. The AI computing hardware market therefore balances peak compute with memory and fabric choices that sustain steady serving loads. Training remains centered in large sites with high power availability and bisection bandwidth needs.
Serving deployments favor regional locations that reduce latency and improve user experience for real-time applications. Operators standardize on rack-scale assemblies to simplify rollout and reduce commissioning risk across geographies. Networking upgrades, including co-packaged optics, improve resilience and power efficiency at higher link speeds. The AI computing hardware market gains from these improvements through consistent scaling paths from development to production.
By End-User Industry:
Healthcare Surges as On-Premises Compliance Drives Accelerator ProliferationHyperscalers and cloud service providers account for 57.4% of 2025 spending as platform services aggregate demand for training and inference. Healthcare and life sciences post a 10.9% CAGR through 2031 thanks to diagnostic imaging, clinical decision support, and discovery workloads that prefer high-throughput, compliant, and frequently on-premises deployments. The AI computing hardware market supplies accelerators and rack systems that meet certification and uptime needs in regulated settings. Financial services, technology platforms, and media are expanding the use of inference in fraud prevention, recommendations, and code generation. Automotive and manufacturing integrate AI across edge workloads for safety and inspection.
In industries with strict data residency, on-premises clusters or sovereign-cloud models remain important purchasing paths. The AI computing hardware market supports both cloud-based access to advanced accelerators and on-premises configurations aligned with privacy and governance policies. Vendor ecosystems help enterprises navigate software portability and model deployment across sites. Buyer preferences now reflect a mix of hyperscale consumption for frontier models and localized inference for real-time tasks. As a result, verticals adopt combinations of cloud training and distributed serving that fit specific compliance and latency requirements.
Geography Analysis
North America, Europe, APAC and Middle East AI Computing Hardware Market
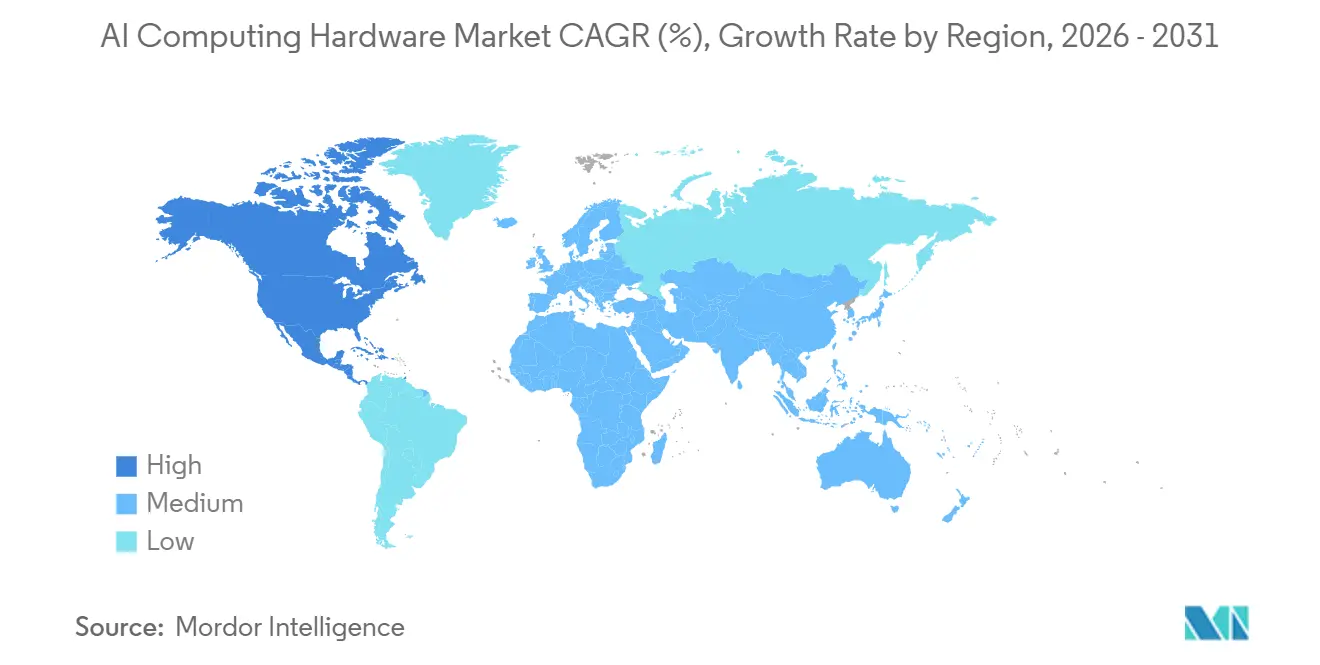
North America accounts for a 35.7% revenue share in 2025 as global hyperscalers concentrate headquarters, platform engineering, and advanced design partnerships in the region. Asia-Pacific posts the fastest expansion at an 11.0% CAGR through 2031 as sovereign cloud initiatives and regional digital services increase local compute footprints. Within the AI computing hardware market, North American growth is tempered by power and interconnection constraints in several Tier 1 metros, prompting diversification to adjacent markets. Europe balances data residency and power availability, and operators distribute deployments across regions that can provide land, grid capacity, and renewable sourcing. The Middle East continues to invest in large-scale AI infrastructure that complements Western technology stacks.
North America and APAC AI Computing Hardware Market
Export controls shape sourcing and deployment decisions along the U.S.-China corridor, which introduces planning complexity for cross-border capacity allocation and chip availability. Operators respond by staging multi-region builds and by pursuing longer-term procurement commitments for accelerators and components. In Asia-Pacific, growing demand for regional model serving reinforces investments in edge sites that balance latency and power access. The AI computing hardware market therefore expands through a distributed footprint that segments training and serving across facility classes. Partnerships that secure large system deployments illustrate the region-wide scale of future buildouts across training and inference. In aggregate, regional strategies converge on liquid-cooled rack-scale systems and high-speed fabrics to sustain rapid growth.
Regulatory Landscape
Export controls and trade measures continue to shape the availability and deployment of advanced AI accelerators and systems across regions. In January 2026, the US Bureau of Industry and Security (BIS) revised the license review policy for exports of advanced computing commodities to China and Macau, moving from a presumption of denial to a case-by-case review. This shift increases compliance diligence for OEMs, distributors, and cloud operators managing cross-border procurement. BIS also issued guidance in May 2026 clarifying that license requirements for advanced computing items (including ECCNs 3A090 and 4A090) apply to certain entities tied to Country Group D:5 or Macau regardless of where they operate, tightening screening requirements across global supply chains.
Standards and conformity activity in Europe is advancing alongside AI governance, which is influencing procurement specifications for AI infrastructure deployed in regulated environments. ETSI published EN 304 223 as a full European Standard for AI cybersecurity in May 2026, aligning with EU AI Act-related requirements and international frameworks. CEN/CENELEC also advanced draft work, including prEN 18286 entering public enquiry in October 2025, aimed at AI quality management systems. These initiatives raise the importance of security, traceability, and assurance controls across AI computing hardware stacks, from servers and accelerators to network fabrics and supporting infrastructure.
Value Chain Analysis
The AI computing hardware value chain runs from silicon and platform architecture through manufacturing, integration, and deployment into cloud, enterprise, and edge environments. Upstream, compute silicon development spans merchant GPU vendors and CPU suppliers, alongside hyperscaler custom silicon programs (for example, Google TPU, AWS Trainium, and Meta MTIA) that target tighter workload alignment for production inference and greater control over supply. Midstream manufacturing is anchored by leading-edge foundries (notably TSMC) and advanced packaging and test providers (such as ASE and Amkor), with performance and availability increasingly determined by CoWoS-class packaging throughput and HBM supply from memory leaders including SK hynix, Samsung, and Micron.
Downstream, system OEMs and ODMs assemble accelerators into AI servers and integrated rack-scale systems, supported by substrate providers (for example, Unimicron and Elite Material) and by power and thermal ecosystems that include power distribution and cooling specialists. Bottlenecks have broadened beyond wafers into packaging, memory, and data center infrastructure inputs (power components, liquid cooling subsystems, and grid interconnect timelines), which makes long-lead procurement and qualification central to delivery schedules. Platform announcements, such as NVIDIA bringing together the Vera CPU and Rubin GPU under the Vera Rubin platform for AI factories (March 2026), also underscore how silicon, memory, interconnects, and rack integration are being productized as coordinated supply chains rather than stand-alone components.
Competitive Landscape
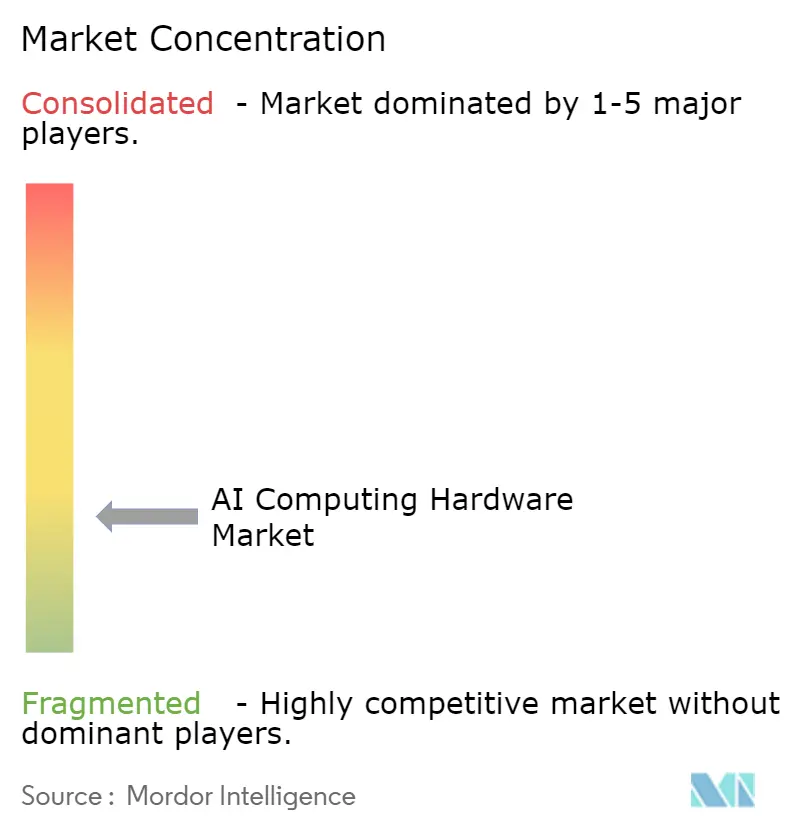
The AI computing hardware market has moderate consolidation, with one vendor holding near 70% share of AI accelerators through 2025 and others gaining through custom silicon programs and open ecosystem positioning. NVIDIA sustains incumbency with a full-stack approach that couples GPUs, fabrics, and software, which creates switching costs for enterprises and developers. AMD is advancing an open, interoperable approach across scale-up and scale-out fabrics and is pairing this with a rack-scale platform that integrates liquid cooling and networking as a pre-configured building block. Intel and NVIDIA announced a strategic collaboration on custom x86 CPUs integrated with NVIDIA AI platforms, which aligns CPU and accelerator roadmaps for data center deployments. These moves align with the market’s shift toward packaged rack solutions and integrated fabrics.
Liquid cooling suppliers and power distribution vendors have become central to system performance, serviceability, and uptime. New coolant distribution units, manifolds, and intelligent power distribution units are being introduced as modular offerings that scale with higher-TDP accelerators and rack densities. Partnerships between cooling and industrial technology firms aim to deliver reference architectures for hyperscale AI sites, which reduces design risk and deployment time for operators. On the networking side, the adoption of co-packaged optics reduces power per bit and improves fabric robustness, which positions CPO as a critical enabler of future AI fabrics. The computing hardware market therefore reflects tighter integration across compute, cooling, and networking vendors.
Scale commitments by leading AI developers are also reshaping supply alignment. Multi-gigawatt partnerships are setting new baselines for system deployment footprints and for how vendors coordinate CPU platforms, accelerators, interconnects, and power delivery at rack scale. In response, chipmakers are aligning silicon roadmaps with system blueprints that emphasize liquid cooling, high memory capacity, and fast fabrics. Open software stacks and standards-based fabrics remain a lever for buyers that want to avoid high switching costs and long-term lock-in. The AI computing hardware market continues to balance vendor incumbency with rising demand for interoperable and serviceable rack-scale systems that simplify deployment across diverse geographies.
AI Computing Hardware Industry Leaders
-
NVIDIA Corporation
-
Intel Corporation
-
Huawei Technologies Co., Ltd.
-
International Business Machines Corporation
-
Dell Technologies Inc.
- *Disclaimer: Major Players sorted in no particular order
AI Computing Hardware Market Companies Covered in this Report
- NVIDIA Corporation
- Advanced Micro Devices, Inc.
- Intel Corporation
- Huawei Technologies Co., Ltd.
- International Business Machines Corporation
- Dell Technologies Inc.
- Hewlett Packard Enterprise Company
- Super Micro Computer, Inc.
- Lenovo Group Limited
- Inspur Electronic Information Industry Co., Ltd.
- Amazon.com, Inc.
- Google LLC
- Microsoft Corporation
- Baidu, Inc.
- Alibaba Group Holding Limited
- Tencent Holdings Limited
- Cerebras Systems Inc.
- Graphcore Limited
- Tenstorrent, Inc.
- Groq, Inc.
- SambaNova Systems, Inc.
- Qualcomm Incorporated
- Arm Holdings plc
- Ampere Computing LLC
Market Opportunities and Future Outlook
A key whitespace is in non-GPU constraints that now govern how quickly AI computing capacity can be deployed, including advanced packaging, HBM, and data center power and cooling subsystems. In 2026, concrete supply-side actions point to opportunity for vendors and integrators that can secure packaging throughput and memory availability: TSMC reported mass production at two advanced packaging facilities in Phase I of the Chiayi Science Park (June 2026), and SK hynix announced a USD 12.85 billion investment in an advanced packaging plant (P&T7) in Cheongju, South Korea (July 2026). As buyers prioritize predictable commissioning of high-density racks, additional opportunity is emerging for validated rack-scale reference designs that bundle accelerators, fabrics, and liquid cooling into repeatable building blocks, reducing site integration risk under tight power constraints.
Demand-side opportunity is also expanding through verticalization and custom silicon programs aimed at inference efficiency and allocation control. OpenAI and Broadcom announced the Jalapeno inference chip for LLM inference (June 2026), while Meta outlined continued production plans for its MTIA chips, including starting production of new MTIA versions in September 2026 as reported in July 2026. These moves expand the addressable market for supporting components and systems around custom accelerators, including server platforms, high-speed Ethernet or other scale-out fabrics, memory-rich configurations, and serviceable liquid-cooled designs. Manufacturing and supply resilience investments, including Micron accelerating US fab investment with activity at its Clay, New York site (July 2026), also reinforce opportunity for suppliers positioned across memory, packaging, and system integration as deployments scale across regions under export, security, and availability constraints.
Recent Industry Developments in AI Computing Hardware Market
- June 2026: NVIDIA and SK hynix announced a multiyear technology partnership to co-develop next-generation memory for AI factories, including support for NVIDIA Vera Rubin systems and related platforms. The collaboration elevates memory roadmaps as a strategic lever for accelerator availability and system throughput as inference and training clusters push higher bandwidth and capacity requirements.
- May 2026: NVIDIA and IREN announced a strategic partnership to accelerate deployment of up to 5 gigawatts of NVIDIA DSX-aligned AI infrastructure over time. The agreement ties AI system supply to data center-scale power and site readiness, reflecting how deployment velocity is increasingly governed by energy and infrastructure execution rather than compute alone.
- October 2025: AMD introduced the Helios rack-scale AI platform at the OCP 2025 Summit, built on Open Rack Wide specifications and centered on upcoming Instinct accelerators with an emphasis on open interoperability. The move strengthens buyer options for standardized rack integration and broader ecosystem compatibility as operators seek repeatable, high-density deployment blocks.
AI Computing Hardware Market Report Scope and Research Methodology
Market Definition and Coverage
This market counts the revenue generated from computing hardware that is mainly used to run AI workloads, including dedicated AI chips and related accelerator hardware used in data centers and at the edge.
Scope exclusions: Software licenses, AI models, cloud services, and pure IT services revenue are excluded even when they are bundled in broader AI offerings.
Segments Covered in This Report
- By Compute Silicon Type
- GPU Accelerators
- AI ASICs
- FPGAs
- CPUs
- NPUs (Edge)
- Other Compute Silicon Types
- By System Form Factor
- AI Servers
- Accelerator Cards and Modules (PCIe, OAM, SXM)
- Integrated Systems and Appliances
- Edge Devices and Gateways
- Other System Form Factors
- By Deployment Location
- Cloud Data Centers
- Enterprise and On-Premises Data Centers
- Edge and Endpoint
- Other Deployment Locations
- By Workload Type
- Training
- Inference
- Other Workload Types
- By End-user Industry
- Hyperscalers and Cloud Service Providers
- Technology and Internet Companies
- Financial Services
- Healthcare and Life Sciences
- Automotive and Manufacturing
- Telecommunications
- Retail and Consumer
- Public Sector
- Other End-user Industries
- By Geography
- North America
- United States
- Canada
- Mexico
- South America
- Brazil
- Argentina
- Chile
- Rest of South America
- Europe
- Germany
- United Kingdom
- France
- Italy
- Spain
- Netherlands
- Russia
- Rest of Europe
- Asia-Pacific
- China
- Japan
- South Korea
- India
- Australia
- Singapore
- Taiwan
- Rest of Asia-Pacific
- Middle East
- United Arab Emirates
- Saudi Arabia
- Turkey
- Israel
- Rest of Middle East
- Africa
- South Africa
- Egypt
- Nigeria
- Rest of Africa
- North America
Data Sources, Market Sizing, and Validation
Desk Research
Desk research was used to set the boundaries of AI computing hardware and to build the first set of demand and supply indicators by region. We relied on public sources such as U.S. International Trade Commission trade statistics, UN Comtrade, World Semiconductor Trade Statistics releases, OECD ICT indicators, and IMF exchange-rate series to keep currency and macro assumptions consistent.
To translate the market into measurable drivers, we also reviewed annual reports and investor decks from relevant hardware and infrastructure suppliers, plus press releases around new silicon launches and data center build-outs. Where needed, a paid subscription covering company financials, patent databases, and shipment-level import and export records was used to cross-check product exposure and directional volume signals. The sources listed here are illustrative, and many other public and paid references were also used for data collection, validation, and clarification.
Primary Interviews and Surveys
Primary work focused on confirming what portion of shipped compute is actually used for AI workloads and how average selling prices move when configurations change (for example, more memory and higher interconnect needs). We spoke with a mix of chip ecosystem participants, system integrators, and large buyers such as cloud and enterprise data center teams, then we rechecked the logic across Americas, EMEA, and APAC to reduce the risk of a region-specific interpretation.
Distribution of primary research fieldwork respondents
| Company type | Respondent position | Region |
|---|---|---|
| Top tier: 36% | CXOs: 17% | APAC: 41% |
| Mid tier: 43% | Functional/Unit leaders: 24% | EMEA: 36% |
| Smaller Players: 21% | Managers: 59% | Americas: 23% |
Market-Sizing & Forecasting
The core model starts with a top-down build that reconstructs AI compute hardware demand using data center capex trends, accelerator attach rates, and the mix shift between training and inference deployments. After that, we corroborate the totals through selective bottom-up checks, such as sampled system configurations multiplied by estimated unit volumes, plus supplier and channel feedback that helps correct obvious overcounts.
Key inputs used in the model include accelerator and server shipment trends, memory and interconnect intensity per AI server, utilization-driven refresh cycles in data centers, edge device adoption where NPUs are embedded, and currency timing for regional revenue conversion. Because price and configuration changes can swing the value quickly, average selling price progression is kept tied to practical signals from buyer quotes and bill-of-material direction, instead of a flat inflation uplift.
For forecasting, scenario analysis was used, supported by short series time-trend smoothing on the main drivers and then adjusted using expert consensus on capacity additions and procurement cycles. When bottom-up signals were incomplete for smaller geographies or niche form factors, we filled gaps using proxy indicators like regional data center investment and semiconductor shipment growth, and then normalized the result back to the overall demand pool.
Data Validation & Update Cycle
Validation is done in layers, starting with checks against independent signals such as semiconductor shipment trends, public data center expansion announcements, and import and export movements for relevant compute components. If a region or form factor shows a step-change that cannot be explained by the drivers, assumptions are revisited and, when needed, targeted follow-up calls are triggered to confirm whether the change is real or timing-related.
Before sign-off, the model goes through multi-step analyst review where calculation logic, currency conversions, and driver linkages are rechecked, and then variances are documented and resolved. Reports are refreshed annually, and interim updates are made when material events occur, such as major platform transitions, policy shifts affecting supply, or a sharp change in spending cycles. Before delivery, one last pass is completed so clients receive the latest updated view.
Mordor Intelligence's AI Computing Hardware Market Estimate Compared With Other Published Estimates
Published market sizes for AI computing hardware often differ because teams draw the boundary in different places and then apply different price and demand assumptions. In our work, we tie the value to what gets shipped and deployed for AI workloads, and then make each major input easy to explain and recheck.
Data center build-out signals, accelerator shipment direction, and configuration-level pricing checks are the evidence that anchors Mordor Intelligence to USD 43.41 B (2025) without inflating the market through broader AI spend that does not convert into hardware revenue. Differences usually come from whether adjacent categories are counted, how training versus inference mix is projected, and how fast average selling prices are assumed to rise as systems get denser.
Benchmark comparison
| Source | Market Size | Gaps in Research Methodology |
|---|---|---|
| Mordor Intelligence | USD 43.41 B (2025) | |
| Global Research House A | USD 45.51 B (2025) | Uses a wider interpretation of form factors and end-use coverage, and the pricing curve appears to move up faster as configurations scale, which lifts the 2025 value. |
| Industry Study B | USD 60.60 B (2025) | Often grouped under a broader AI hardware bucket that can blend compute with additional hardware lines, and the inclusion rules for data center networking and storage can expand the counted revenue. |
The spread in the table mainly reflects boundary choices and how quickly price per deployed system is assumed to increase. By keeping the model connected to shipment and deployment signals and then cross-checking pricing and mix assumptions, we end up with a balanced number that can be repeated and stress-tested year to year.
Key Questions Answered in the Report
What is the current size and growth outlook for the AI computing hardware market by 2031?
The category stands at USD 47.43 billion in 2026 and is projected to reach USD 77.55 billion by 2031 at a 10.3% CAGR.
Which compute silicon type leads in the AI computing hardware market and which grows the fastest?
GPU accelerators lead with a 64% share in 2025, while AI ASICs are the fastest-growing at a 10.6% CAGR through 2031.
Which deployment locations will expand fastest for AI computing hardware through 2031?
Edge and endpoint sites rise at a 10.9% CAGR as latency-sensitive inference moves closer to users, while cloud data centers remain the largest base at a 44% share in 2025.
What is the primary workload shaping system design in the AI computing hardware market?
Inference is central, with a 35% share in 2025 and an 11.2% CAGR, which shifts design priorities toward cost per token, memory capacity, and power efficiency.
Which end-user segments are driving demand for AI computing hardware in 2025?
Hyperscalers and cloud service providers command 57.4% of 2025 spending, and healthcare and life sciences are the fastest-growing at a 10.9% CAGR.
Which region leads and which region grows fastest in AI computing hardware?
North America leads with a 35.7% share in 2025, and Asia-Pacific grows fastest at an 11.0% CAGR through 2031.