Serverless Computing Market Size and Share
Market Overview
| Study Period | 2020 - 2031 |
|---|---|
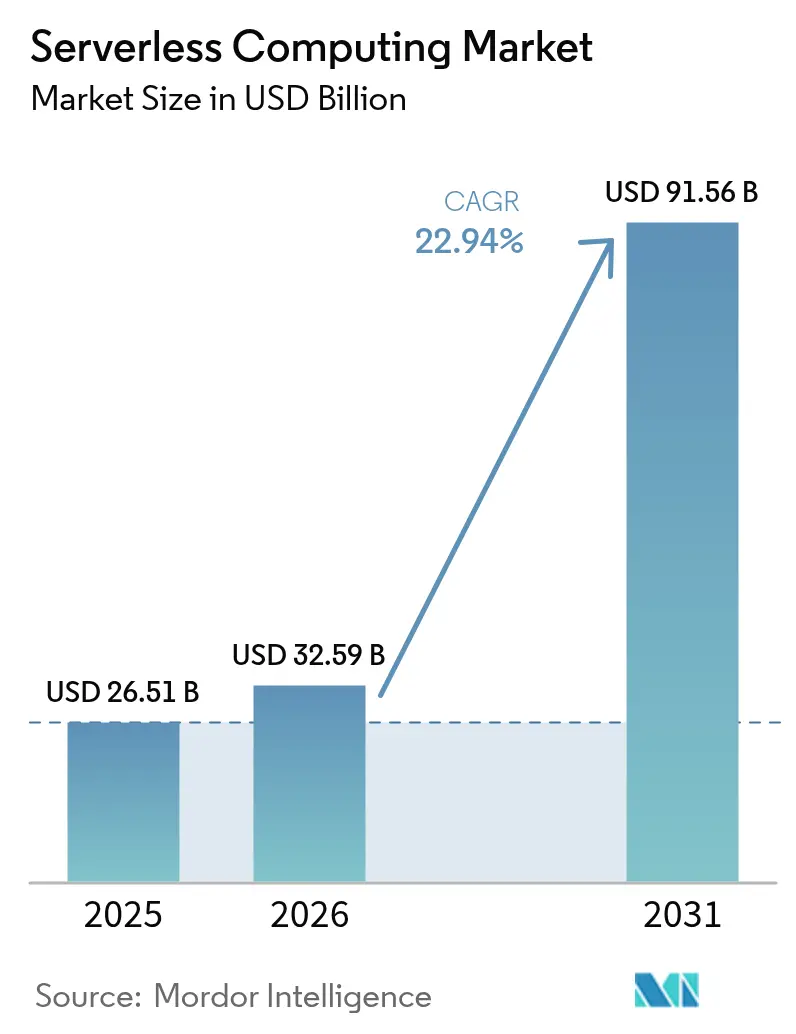
| Market Size (2026) | USD 32.59 Billion |
| Market Size (2031) | USD 91.56 Billion |
| Growth Rate (2026 - 2031) | 22.94% CAGR |
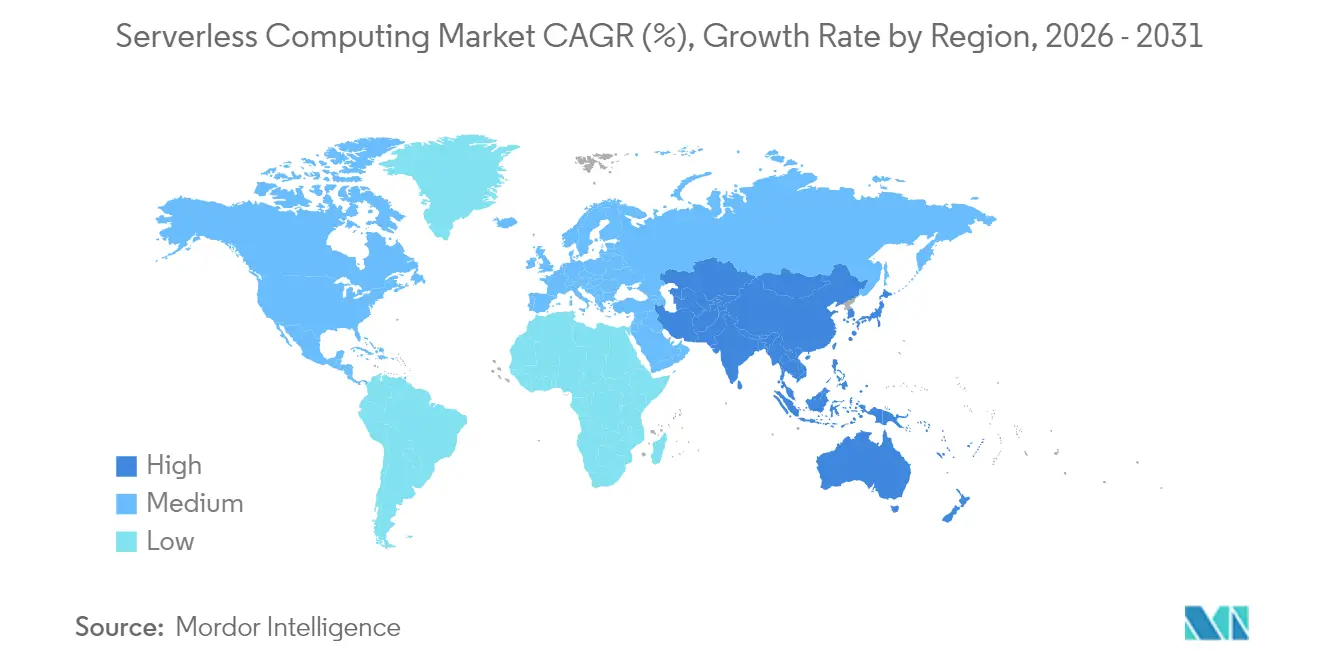
| Fastest Growing Market | Asia Pacific |
| Largest Market | North America |
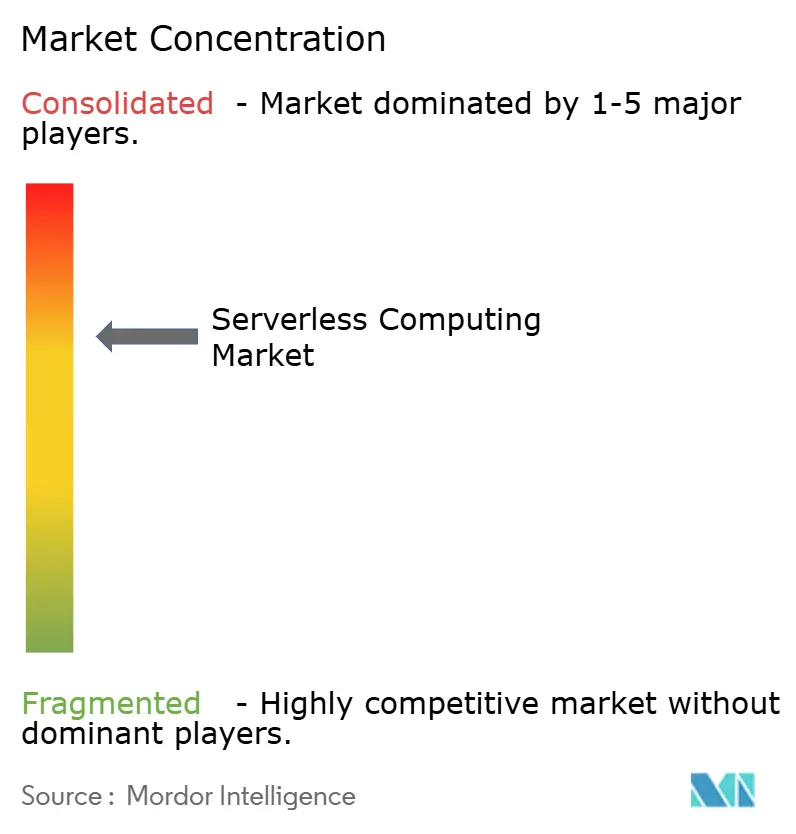
| Market Concentration | Medium |
Major Players*Disclaimer: Major Players sorted in no particular order Image © Mordor Intelligence. Reuse requires attribution under CC BY 4.0. | |
Serverless Computing Market Analysis by Mordor Intelligence
Serverless computing market size in 2026 is estimated at USD 32.59 billion, growing from 2025 value of USD 26.51 billion with 2031 projections showing USD 91.56 billion, growing at 22.94% CAGR over 2026-2031. Demand is rising because development teams want to write code without managing infrastructure, and hyperscale clouds now bundle robust observability, security and integration capabilities. Momentum is reinforced by event-driven microservices, edge-native 5G deployments, and real-time AI workloads that scale irregularly yet require sub-second response. Enterprises are moving from cost savings to innovation goals, using serverless to speed new digital products, automate DevSecOps and support data-sovereign architectures. Public cloud remains the dominant deployment model, but multi-cloud strategies are gaining ground as enterprises look to balance best-of-breed features with vendor risk.
Key Report Takeaways
- By service type, Function-as-a-Service led with 57.30% of the serverless computing market share in 2025; Backend-as-a-Service is projected to grow at a 24.32% CAGR through 2031.
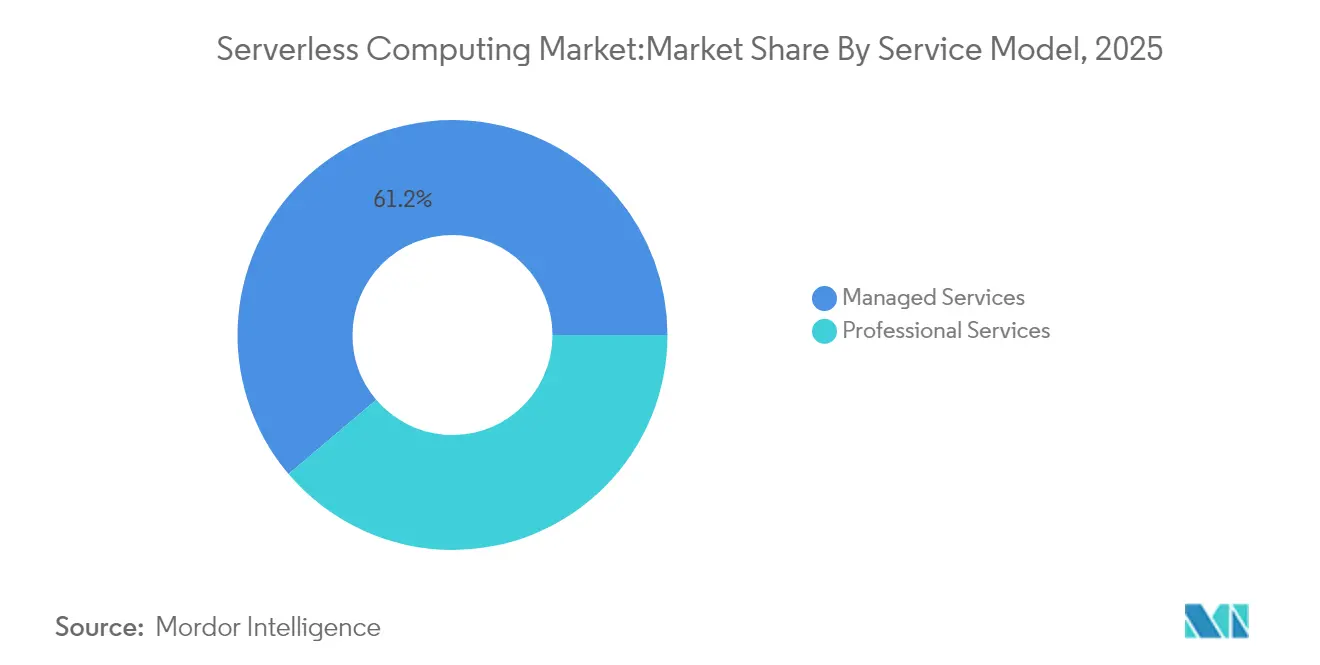
- By service model, Managed Services accounted for 61.20% of the serverless computing market size in 2025, while Professional Services is set to expand at an 17.65% CAGR over 2026-2031.
- By deployment model, Public Cloud held 70.10% of the serverless computing market size in 2025; Multi-Cloud is the fastest-expanding model at 23.15% CAGR to 2031.
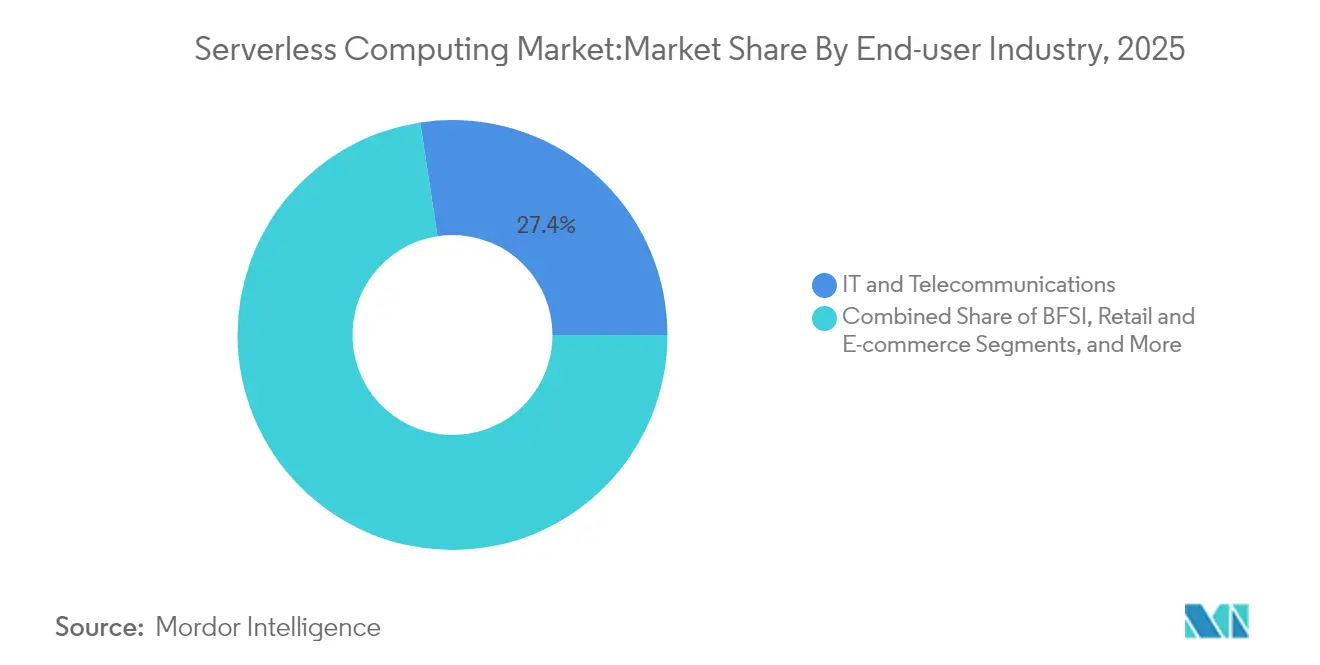
- By end-user industry, IT and Telecommunications commanded 27.40% of the serverless computing market share in 2025; Healthcare and Life Sciences is forecast to advance at a 23.20% CAGR by 2031.
- By geography, North America captured 37.60% revenue share in 2025; Asia Pacific is tracking the highest regional CAGR at 19.05% between 2026 and 2031.
Note: Market size and forecast figures in this report are generated using Mordor Intelligence’s proprietary estimation framework, updated with the latest available data and insights as of 2026.
Global Serverless Computing Market Trends and Insights
Drivers Impact Analysis*
| Driver | (~) % Impact on CAGR Forecast | Geographic Relevance | Impact Timeline |
|---|---|---|---|
| Accelerating shift to event-driven microservices in North American BFSI modernization | +5.2% | North America, spillover to Europe | Medium term (2–4 years) |
| Surging demand for DevSecOps-ready multi-cloud pipelines across European retail and e-commerce | +4.8% | Europe, North America | Medium term (2–4 years) |
| Roll-out of edge-native 5G MEC driving serverless adoption among Asia telecom operators | +6.3% | Asia, spillover to North America | Long term (≥ 4 years) |
| Real-time AI/ML inference workloads propelling Function-as-a-Service uptake in healthcare | +5.7% | Global, early adoption in North America | Medium term (2–4 years) |
| Government Zero-Trust mandates boosting serverless security toolchains in US federal IT | +3.90% | North America, with spillover to Europe | Short term (≤ 2 years) |
| Rapid expansion of API monetisation platforms in LATAM fintech ecosystems | +4.10% | South America, with spillover to North America | Medium term (2-4 years) |
| Source: Mordor Intelligence | |||
Accelerating Shift to Event-Driven Microservices in North American BFSI Modernization
Banks and insurers are replacing monoliths with granular services that react to card swipes, loan quotes and fraud signals in near real time. Using serverless functions, leading North American institutions trimmed development cycles by 35-40% and shaved 28.3% off infrastructure spend, freeing budget for new digital features.[1]Capital One, “Serverless Architecture at Scale,” capitalone.com The model’s pay-per-execute billing fits irregular transaction volumes common in payments and wealth platforms. API-first designs also simplify regulatory audits because each function can log, encrypt and version individually. As zero-trust rules tighten, BFSI teams prefer ephemeral compute that reduces attack surface while meeting stringent audit trails.
Surging Demand for DevSecOps-Ready Multi-Cloud Pipelines Across European Retail and E-commerce
European retailers race to match instant checkout and personalized offers while obeying GDPR. Eighty-nine percent now distribute serverless workloads across at least two clouds to avoid lock-in and maintain regional data residency.[2]Microsoft, “Multi-Cloud DevSecOps in Retail,” learn.microsoft.com Built-in policy engines scan code on every commit, integrate security tests into CI/CD and auto-encrypt secrets, shrinking vulnerability windows. By shifting security left, teams cut remediation time and push features faster during seasonal peaks such as Singles’ Day and Black Friday.
Roll-out of Edge-Native 5G MEC Driving Serverless Adoption Among Asia Telecom Operators
Asian carriers attach lightweight serverless runtimes to base-station MEC nodes, processing packets near users and reducing latency to double-digit milliseconds for cloud gaming and AR overlays.[3]NTT DOCOMO, “5G MEC and Edge Computing,” nttdocomo.co.jp Functions spin up per connection, enabling dynamic network slicing that matches throughput and quality-of-service on demand. The pay-as-invoked approach keeps CAPEX low even as device counts surge, a key factor for operators serving dense megacities such as Tokyo, Seoul and Mumbai.
Real-Time AI/ML Inference Workloads Propelling Function-as-a-Service Uptake in Healthcare
Hospitals deploy serverless APIs to run image segmentation, anomaly detection, and triage models that must answer within seconds at bedside monitors.[4]Philips, “AI in Critical Care,” philips.com Because inference traffic spikes during rounds and emergencies, serverless elasticity prevents GPU over-provisioning and has reduced compute costs by 63.8% versus fixed clusters. HIPAA-compliant encryption, automated patching, and region-pinning ease CIO concerns about protected health information.
Restraints Impact Analysis*
| Restraint | (~) % Impact on CAGR Forecast | Geographic Relevance | Impact Timeline |
|---|---|---|---|
| Debugging and observability gaps in highly distributed micro-functions | −3.2% | Global, higher impact in North America | Medium term (2–4 years) |
| Vendor lock-in risk amplified by proprietary event orchestration engines | −2.8% | Global, higher impact in Europe | Long term (≥ 4 years) |
| Data residency compliance hurdles for multi-region serverless data stores | -2.1% | Europe, Asia-Pacific | Medium term (2-4 years) |
| Cold-start latency constraints in high-frequency trading and gaming workloads | -1.9% | Global | Short term (≤ 2 years) |
| Source: Mordor Intelligence | |||
Debugging and Observability Gaps in Highly Distributed Micro-Functions
Traditional APM agents cannot trace ephemeral functions that live for milliseconds, leaving blind spots during root-cause analysis. Enterprises report troubleshooting serverless apps takes 2.4 times longer than monoliths because logs scatter across services and cold-starts mask latency outliers. Emerging solutions now inject lightweight span IDs and export them to open-standard back ends, yet maturity lags mainstream tooling. Until traces, metrics and logs consolidate seamlessly, risk-averse sectors will hesitate to migrate mission-critical systems.
Vendor Lock-In Risk Amplified by Proprietary Event Orchestration Engines
Every major cloud offers unique state machines, event buses and queue semantics that accelerate development but hinder portability. Rewriting orchestration logic for another provider can exceed original project effort. Enterprises therefore balance deep integration benefits against strategic flexibility, often adopting abstraction frameworks that normalize triggers but add latency and cost. Open-source community projects such as Knative and Bebop aim to standardize interfaces, yet production adoption remains limited relative to native services.
*Our forecasts treat driver/restraint impacts as directional, not additive. The impact forecasts reflect baseline growth, mix effects, and variable interactions.
Segment Analysis
By Service Model: Professional Services Driving Enterprise Adoption
Managed Services held 61.20% of 2025 revenue as organizations prioritized turnkey operations, but Professional Services is expanding at an 17.65% CAGR to 2031 as firms tackle complex modernization programs. Many regulated enterprises hire consulting partners to redesign event schemas, refactor monoliths and validate compliance before going live. Advisory teams integrate serverless security patterns, policy-as-code and FinOps dashboards to maximize business value.Professional Services also support culture change, training product squads on asynchronous design and observability best practices. As serverless footprints widen to analytics, AI and edge, continuous governance and platform engineering join development assistance in bundled engagements. This evolution sustains high-margin growth for integrators while improving enterprise time-to-value.


By Service Type: Backend-as-a-Service Expanding Developer Productivity
Function-as-a-Service captured 57.30% of spending in 2025 and will keep anchoring the serverless computing market through 2031. Yet Backend-as-a-Service is the star growth segment at 24.32% CAGR as teams seek higher-level constructs that collapse authentication, storage and real-time sync into API calls. Mobile developers in particular appreciate one-line integration for login and push notifications, cutting launch cycles from weeks to hours.BaaS complements FaaS by offloading boilerplate tasks, letting functions focus on differentiated logic. Unified API gateways route traffic uniformly across both paradigms, while serverless containers fill performance gaps that demand longer-lived processes. The spectrum of abstractions allows architects to mix and match for cost, latency and compliance needs.
By Deployment Model: Multi-Cloud Strategies Gaining Momentum
Public cloud supplied 70.10% of serverless revenue in 2025 owing to breadth of services and global PoPs. However, multi-cloud adoption is compounding at 23.15% CAGR as enterprises distribute workloads for resilience, data residency and best-fit services. Toolchains now package infrastructure-as-code templates that parameterize provider targets, easing deployment across AWS, Azure and Google Cloud from the same pipeline.Multi-cloud drives innovation but raises integration complexity. Teams standardize observability, security posture management and policy engines across footprints to mitigate sprawl. Hybrid journeys remain relevant for firms with latency-sensitive on-prem datasets, and sovereign-cloud offerings gain traction where regulation dictates in-country processing.
By End-User Industry: Healthcare Accelerating Digital Transformation
IT and Telecommunications controlled 27.40% of 2025 spending thanks to API-centric product rollouts, but Healthcare and Life Sciences will post a 23.20% CAGR through 2031. Hospitals want predictive analytics during care pathways without standing up heavy clusters, and serverless seamlessly scales under variable patient loads. Clinical imaging, genomic analysis and remote monitoring pipelines benefit from millisecond spin-up and event billing.Financial institutions adopt serverless for instant fraud checks and account aggregation, while retailers use it for flash-sale elasticity and personalized promotions. Public sector agencies embrace serverless to satisfy zero-trust mandates with least-privilege execution. Manufacturing plants harness it for batch-to-real-time IoT telemetry, and media houses stream targeted ads via edge functions.
By Application: Real-Time Processing Driving Innovation
Data processing and ETL remain widespread, with services such as AWS Glue orchestrating extract-transform-load tasks that run on demand then shut down automatically. Real-time file and stream analytics surged as connected devices flooded enterprises with telemetry needing sub-second insights. Streaming functions cleanse, enrich and fan-out events to ML endpoints, accelerating customer-facing dashboards.Web and mobile back ends benefit from stateless functions that auto-scale for viral traffic without cold-standby fleets. IoT back-end services use serverless to ingest sensor bursts and trigger alerts, avoiding idle compute when devices sleep. Big-data workloads now adopt serverless query engines to scan petabytes without provisioning clusters, highlighting the model’s versatility across batch and interactive analytics.
Geography Analysis
North America drove 37.60% of 2025 serverless revenue, supported by abundant cloud talent, aggressive digital banking roadmaps, and U.S. federal zero-trust directives that favor ephemeral compute for reduced attack surface. Enterprises leverage serverless to modernize legacy stacks, employ event streams for customer personalization, and run compliance-ready logging pipelines. Canada mirrors these patterns, especially among telcos integrating 5G edge functions, while Mexico’s fintech startups adopt serverless to scale payment APIs securely.
Asia Pacific is the fastest-growing region, projected at 19.05% CAGR to 2031. China’s internet majors invest in native serverless AI services, and India’s booming SaaS sector embraces the pay-as-you-go model to manage unpredictable global demand. Japanese and South Korean manufacturers integrate edge functions for predictive maintenance, whereas ASEAN fintech and e-commerce players deploy multi-cloud serverless stacks to reach regional customers with low latency. The confluence of 5G MEC, affordable cloud spots and developer upskilling accelerates uptake across the region.
Europe maintains a strong position as organizations adopt multi-cloud to satisfy GDPR and state sovereignty rules. The United Kingdom, Germany and France lead with retail, banking and public-sector pilots that share common blueprints for encryption, audit and residency. Nordic countries push boundaries with green data-center integrations and event-driven energy grids. Vendors respond with localized zones and portable runtimes, reinforcing growth despite stricter compliance landscapes.

Regulatory Landscape
Regulation affecting serverless deployments is increasingly framed through cloud security, software assurance, and critical-entity risk management requirements that translate into technical controls for API gateways, identity, logging, and runtime monitoring. In the European Union, NIS2 brings cloud computing service providers into scope for defined cybersecurity risk management measures (implemented via Regulation 2024/2690 in October 2024), while ENISA published its technical implementation guidance (v1.0) in June 2025 to help operationalize those measures across cloud-native stacks.
2025-2026 also added more serverless-specific anchors that shape provider roadmaps and enterprise procurement. ITU-T Recommendation X.1650 (May 2025) introduced dedicated security guidance for serverless computing across the lifecycle, and Germanys BSI C5:2026 catalog updated the cloud compliance baseline used in regulated procurement, aligning with EUCS Substantial level requirements. On the product security side, ENISAs Secure by Design and Default Playbook (v0.4 draft, March 2026) aligns development practices with EU Cyber Resilience Act expectations, and NIST published draft SP 800-228A (May 2026) on secure deployment of RESTful web APIs, which is directly relevant to serverless architectures built around API-first exposure.
Value Chain Analysis
The serverless computing value chain begins with hyperscale data-center infrastructure (compute, storage, networking) and the platform layer that provides multi-tenant isolation and runtime management, then extends to developer-facing services such as API gateways, event buses, FaaS/BaaS runtimes, and managed observability and security. Major cloud providers (AWS, Microsoft, Google, Alibaba, IBM) combine hardware supply, virtualization and sandboxing technologies (including microVM and container isolation), billing and metering, and global delivery into bundled serverless platforms, while ISVs and open-source projects add portability, policy-as-code, CI/CD integration, and specialized monitoring for ephemeral functions.
Downstream, systems integrators and managed service providers run migration and governance programs, including application refactoring to event-driven microservices, compliance validation, and FinOps optimization. Bottlenecks concentrate around specialized capacity and data movement for AI and real-time processing, including constrained availability of GPU instances for serverless-adjacent AI workloads and bandwidth and latency considerations for high-throughput event streaming. Platform engineering is also moving further into the value chain as enterprises standardize multi-cloud pipelines and common telemetry, reinforced by provider updates such as AWS Lambda MicroVMs (June 2026), which add VM-level isolation and near-instant startup characteristics that affect how providers package security and performance as part of the managed runtime.
Competitive Landscape
The serverless computing market remains concentrated: AWS Lambda, Microsoft Azure Functions and Google Cloud Functions collectively account for more than 60% of 2024 spend. AWS builds advantage from early-mover status and hundreds of integrations, while Microsoft exploits enterprise relationships and hybrid tooling to win regulated workloads. Google differentiates through AI hardware accelerators and open-source alignment.
Specialized challengers carve niches. Vercel and Netlify focus on front-end developers with zero-config deployment tied to git workflows, gaining loyalty among web studios. Cloudflare Workers and Fastly Compute@Edge leverage globally distributed PoPs to execute logic metres from users, attracting media and gaming workloads that cherish latency.
M&A and ecosystem investments centre on observability, security, and portability. Hyperscalers acquire start-ups for multi-runtime debugging and policy-as-code automation, while independent vendors release cross-provider orchestration frameworks. Edge clouds partner with chipmakers to host GPU inference close to devices, hinting at a blended serverless-edge future.
Serverless Computing Industry Leaders
Amazon Web Services Inc.
Microsoft Corp.
Google LLC
Alibaba Group Holding Limited
IBM Corp.
- *Disclaimer: Major Players sorted in no particular order

Market Opportunities and Future Outlook
Data sovereignty and compliance automation create whitespace for multi-cloud and region-pinned serverless architectures that can show consistent controls across providers. The European Commissions proposed Cloud and AI Development Act (June 2026) introduces a four-tier cloud sovereignty assurance concept and calls for national cloud strategies that support open-source software, which increases demand for policy-as-code guardrails, auditable event routing, and portable runtime patterns that reduce reliance on proprietary orchestration engines. Standards and guidance are also becoming more serverless-specific (for example, ITU-T X.1650, May 2025), supporting opportunities for vendors in security, observability, and developer tooling to map lifecycle controls to ephemeral execution.
AI and data platforms are also productizing serverless execution as a default consumption model, broadening the addressable workload set beyond web back ends and ETL into agentic and inference-driven use cases that scale irregularly. CNCF reporting (Q1 2026) shows measurable serverless adoption among backend developers, often alongside containerized AI/ML workflows, which suggests room for integrated offerings that coordinate functions, containers, and event streams under a single governance model. Provider and ecosystem investment in capacity and adjacent AI infrastructure, including AWS scaling planned Mississippi data center investment to USD 25 billion (July 2026) and a strategic partnership with OpenAI announced in February 2026, reinforces near-term opportunities for serverless platforms to integrate stateful orchestration, serverless GPU pathways, and stronger isolation mechanisms for regulated and AI-heavy workloads.
Recent Industry Developments
- June 2026: Databricks announced its Software-Defined Storage (SDS) Ecosystem, enabling storage partners to expose enterprise data estates to Databricks Serverless Compute. The move broadens the set of storage integrations that can be consumed through serverless execution, strengthening the platform model where data access, governance, and compute scale are packaged together.
- May 2026: Temporal introduced a serverless option for its Durable Execution platform, allowing standard Temporal Workers to run on serverless compute such as AWS Lambda. This lowers operational overhead for workflow orchestration and makes durable, event-driven application patterns more accessible to teams standardizing on function-based runtimes.
- December 2024: Microsoft Azure added serverless GPU support in Azure Container Apps using NVIDIA A100 and T4 GPUs for AI inferencing. This expanded the addressable workload set for serverless-style deployments by bringing on-demand acceleration into managed, event-driven application stacks.


Research Methodology Framework and Report Scope
Market Definition and Coverage
For this study, the serverless computing market is defined as spending on serverless application development and runtime services where the cloud provider handles provisioning, scaling, and infrastructure operations, and customers pay mainly based on usage.
Scope exclusions: This sizing excludes non-serverless cloud services (such as standard VM hosting and traditional managed infrastructure) when they are not delivered through a serverless execution and management model.
Segmentation Overview
- By Service Model
- Professional Services
- Managed Services
- By Service Type
- Function-as-a-Service (FaaS)
- Backend-as-a-Service (BaaS)
- API Gateway
- Container-as-a-Service (CaaS)
- By Deployment Model
- Public Cloud
- Private Cloud
- Hybrid Cloud
- Multi-Cloud
- By End-user Industry
- IT and Telecommunications
- BFSI
- Retail and E-commerce
- Government and Public Sector
- Healthcare and Life Sciences
- Industrial and Manufacturing
- Media and Entertainment
- Others
- By Geography
- North America
- United States
- Canada
- Mexico
- South America
- Brazil
- Argentina
- Rest of South America
- Europe
- United Kingdom
- Germany
- France
- Italy
- Spain
- Rest of Europe
- Nordics
- Sweden
- Norway
- Denmark
- Finland
- Middle East
- Saudi Arabia
- United Arab Emirates
- Turkey
- Rest of Middle East
- Africa
- South Africa
- Nigeria
- Egypt
- Rest of Africa
- Asia Pacific
- China
- India
- Japan
- South Korea
- ASEAN
- Rest of Asia Pacific
- North America
Data Sources, Market Sizing, and Validation
Desk Research
Desk research was used to set the scope boundaries for serverless definitions and to build the first draft of regional demand patterns. We referenced public sources such as the US Bureau of Labor Statistics (software and cloud-related employment and wage trends), the US Census Bureau and OECD digital economy indicators, and ITU connectivity statistics to understand the direction of cloud adoption and changes in usage intensity.
To keep assumptions realistic, we also reviewed company annual reports, earnings call transcripts, investor presentations, and product documentation that describe how serverless services are packaged and billed. Patent databases were used selectively to spot where new serverless capabilities and automation features were being developed. A paid subscription database for company financials and another for news and filings were used for faster cross-checking, but the sizing logic did not depend on any single source. These examples are illustrative only, since many other public sources were also consulted for data collection, validation, and research clarification.
Primary Interviews and Surveys
Primary work focused on interviews and structured surveys with cloud architects, DevOps and platform leaders, application owners, and budgeting stakeholders who manage cloud spend. Inputs were gathered across APAC, EMEA, and the Americas so we could confirm adoption speed, typical workload triggers (event-driven apps, APIs, data processing), and how multi-cloud and hybrid choices affect the split of spend over time.
Distribution of primary research fieldwork respondents
| Company type | Respondent position | Region |
|---|---|---|
| Top tier: 29% | CXOs: 14% | APAC: 49% |
| Mid tier: 50% | Functional/Unit leaders: 32% | EMEA: 30% |
| Smaller Players: 21% | Managers: 54% | Americas: 21% |
Market-Sizing & Forecasting
The model starts with a top-down build where cloud adoption signals and workload demand are converted into an addressable serverless spend pool by region and major end-use. In practice, we used a penetration-rate based demand pool assessment that links overall cloud application activity to the share that is realistically executed through serverless runtimes, followed by pricing logic that reflects usage-based billing.
To keep totals grounded, results are then corroborated with selective bottom-up approximations, such as sampled pricing per request or per execution time multiplied by estimated workload volumes, and channel checks on typical enterprise spend bands for serverless services. When data is patchy for smaller countries or niche verticals, gaps are handled through proxy indicators like developer hiring trends, cloud migration pace, and enterprise IT spending direction, and then adjusted after expert feedback.
Key inputs used in the model include the pace of cloud-native application development, multi-cloud adoption levels, intensity of API and event-driven workloads, security and compliance requirements that influence deployment choices, and observed pricing movement for common serverless consumption units. Forecasting was carried out using scenario analysis supported by short time-series smoothing, with assumptions reviewed against what practitioners expect for workload growth, optimization efforts, and macro IT budget cycles.
Data Validation & Update Cycle
Validation is done through a few repeatable checks, and we keep notes on every adjustment so it can be traced back later. Model outputs are compared against independent signals like cloud spending direction, developer activity trends, and regional enterprise digitization indicators, and then the biggest variances are reviewed again before sign-off.
If an assumption creates an unusual step change, the data trail is re-checked and relevant experts are re-contacted to confirm whether the change is real or just a modeling artifact. The report is refreshed annually, and interim updates are made when material events shift pricing, adoption, or regulation. Before delivery, a final pass is completed so clients receive an updated view with the latest available inputs.
Mordor Intelligence's Serverless Computing Market Estimate Compared With Other Published Estimates
It is common to see different market values for serverless computing because publishers do not always count the same spending lines, and they may choose different base years and currency timing. The way usage-based pricing is treated also matters, since small changes in assumed workload volumes can move the total quickly.
By tracking usage-linked pricing cues and refreshing inclusion rules for what qualifies as serverless runtime and service revenue, Mordor Intelligence keeps the total tied to measurable execution and management consumption, rather than folding in broader cloud platform spending that is not priced or delivered in a serverless way.
Benchmark comparison
| Source | Market Size | Gaps in Research Methodology |
|---|---|---|
| Mordor Intelligence | USD 32.59 B (2026) | |
| Global Consultancy A | USD 31.56 B (2026) | A longer forecast horizon can smooth near-term growth, and the scope is presented as a broad product taxonomy, which can shift what is counted as market revenue in the base year. |
| Industry Publisher B | USD 24.51 B (2024) | Uses an earlier base year and may treat multi-cloud and hybrid spending differently, which can reduce the counted addressable pool when serverless is tied to a narrower set of deployments and buyer cohorts. |
The spread across publishers is mostly explained by base-year selection and whether adjacent cloud services are included in the revenue bucket. When scope boundaries, pricing progression, and regional adoption checks are stated clearly, the output becomes easier to replicate and easier to reconcile with observed demand signals.


Key Questions Answered in the Report
What is the growth outlook for the serverless computing market to 2031?
The serverless computing market is expected to rise from USD 32.59 billion in 2026 to USD 91.56 billion by 2031, registering a 22.94% CAGR.
Which service type is expanding fastest?
Backend-as-a-Service is projected to grow at a 24.32% CAGR as developers seek higher-level abstractions that accelerate application delivery.
Why are enterprises embracing multi-cloud serverless strategies?
Multi-cloud adoption, forecast at 23.15% CAGR, helps firms avoid vendor lock-in, satisfy data-residency rules and mix best-of-breed cloud features.
Which industry vertical will lead future serverless adoption?
Healthcare & Life Sciences shows the highest CAGR at 23.20% through 2031, driven by real-time AI/ML inference and variable patient data loads.
What are the main hurdles to wider serverless adoption?
Key barriers include debugging and observability gaps in micro-functions and vendor lock-in linked to proprietary orchestration engines.
Who are the dominant vendors in the serverless computing space?
AWS, Microsoft Azure and Google Cloud together hold more than 60% market share, with niche challengers such as Vercel, Cloudflare and Fastly growing in specialized areas.
Page last updated on:


