Hyperscale Data Center Market Size and Share
Market Overview
| Study Period | 2020 - 2031 |
|---|---|
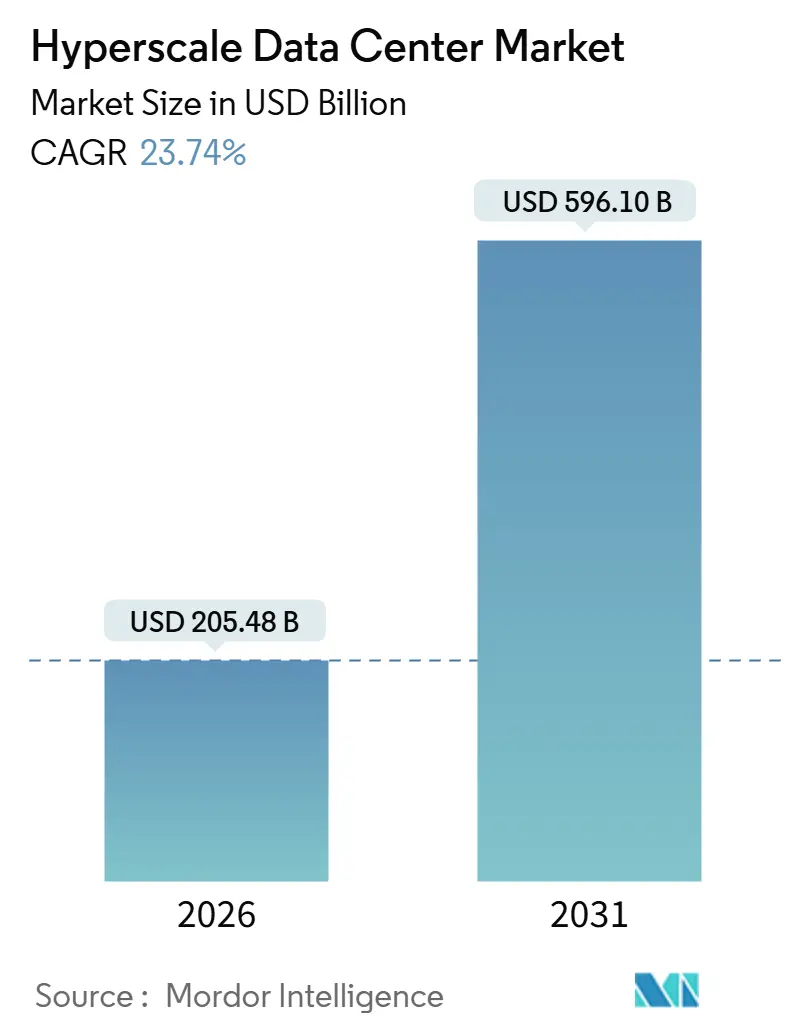
| Market Size (2026) | USD 205.48 Billion |
| Market Size (2031) | USD 596.10 Billion |
| Growth Rate (2026 - 2031) | 23.74% CAGR |
| Fastest Growing Market | Asia Pacific |
| Largest Market | North America |
| Market Concentration | Medium |
Major Players.webp) *Disclaimer: Major Players sorted in no particular order Image © Mordor Intelligence. Reuse requires attribution under CC BY 4.0. | |
Hyperscale Data Center Market Analysis by Mordor Intelligence
The hyperscale data center market size stands at USD 205.48 billion in 2026 and is projected to reach USD 596.10 billion by 2031, reflecting a 23.74% CAGR. Rapid adoption of generative AI training clusters is pushing rack densities beyond 50 kilowatts, which in turn is driving wholesale retrofits of power and cooling systems to accommodate liquid-cooled, GPU-rich architectures. Capital commitments by cloud majors, exemplified by Alibaba Group’s USD 53 billion three-year plan, signal a structural reallocation of spending toward purpose-built AI infrastructure, while sovereign-cloud mandates in Europe and real-time payment requirements in Asia are fragmenting capacity deployment models. Operators are recalibrating site-selection criteria to secure renewable energy, low-latency fiber routes, and water-constrained cooling technologies, even as private-equity platforms pre-fund multi-gigawatt land banks to capture long-term hyperscale leases. Competitive intensity is therefore stratifying, hyperscalers self-build for proprietary workloads, private-equity-backed developers chase mega-campus leases, and legacy colocation specialists pivot to enterprise edge and regulatory-compliant niches, all of which reinforce steady expansion of the hyperscale data center market.
Key Report Takeaways
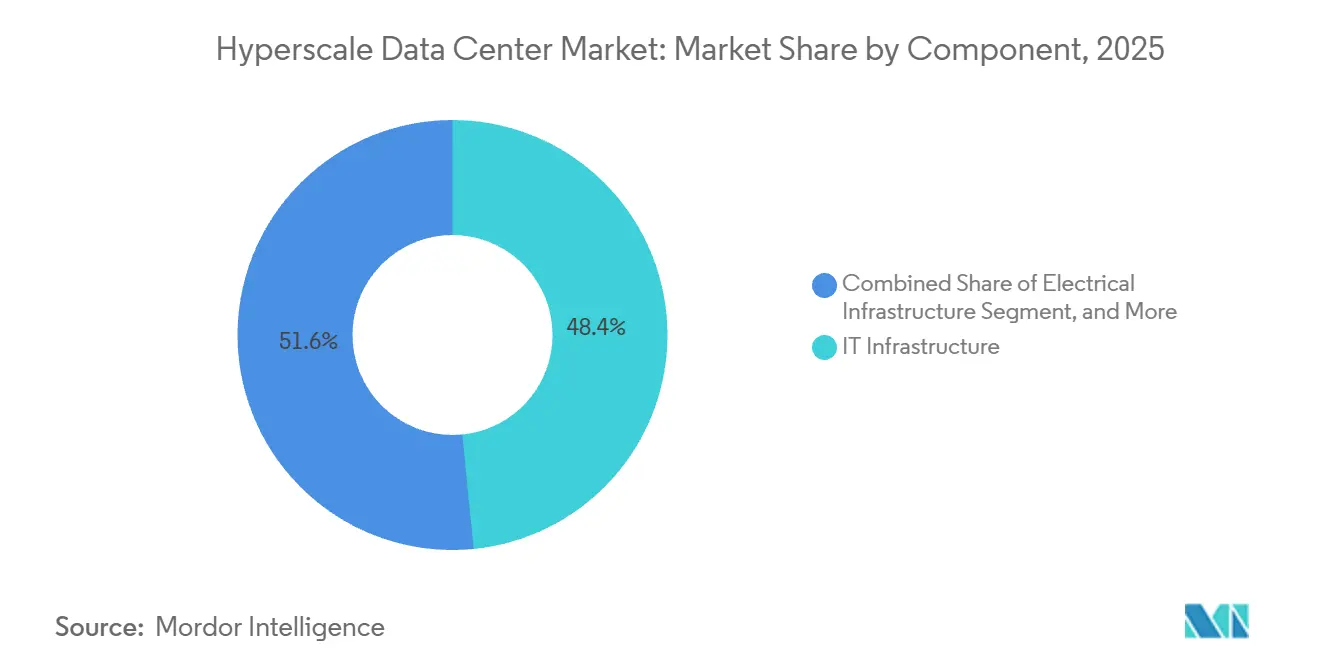
- By component, IT infrastructure led with 48.43% revenue share in 2025, while electrical infrastructure is forecast to expand at a 24.65% CAGR through 2031.
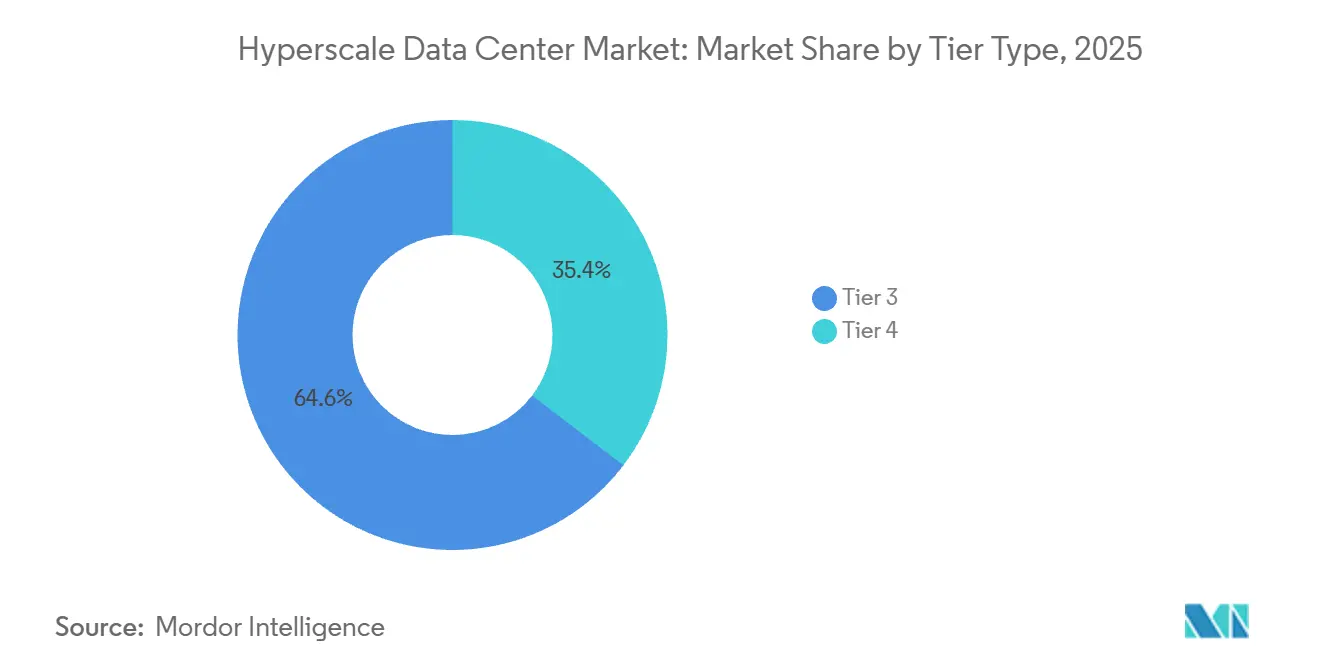
- By tier type, tier 3 facilities accounted for 64.64% of the hyperscale data center market share in 2025, whereas tier 4 is the fastest-growing tier at 24.84% CAGR to 2031.
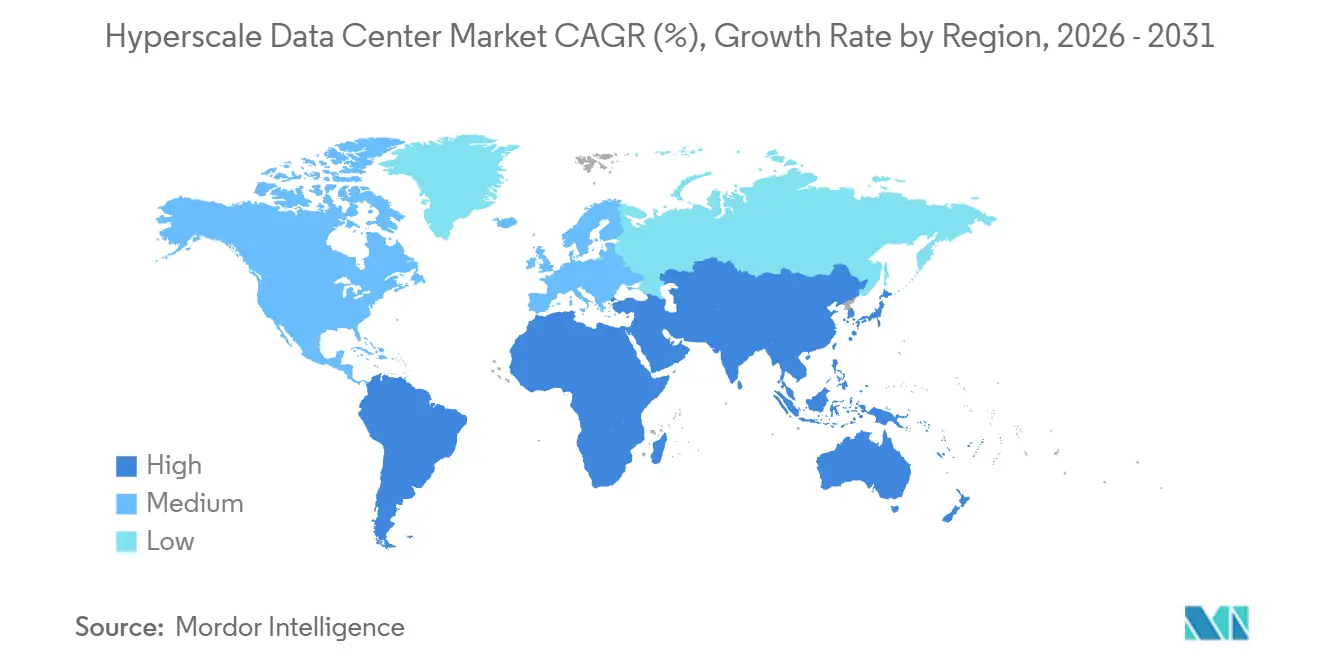
- By geography, North America held 40.43% of the hyperscale data center market in 2025, yet Asia-Pacific is projected to record the highest 24.57% CAGR through 2031.
Note: Market size and forecast figures in this report are generated using Mordor Intelligence’s proprietary estimation framework, updated with the latest available data and insights as of January 2026.
Market Trends and Insights
Drivers Impact Analysis of Hyperscale Data Center Market*
| Driver | (~) % Impact on CAGR Forecast | Geographic Relevance | Impact Timeline |
|---|---|---|---|
| Exploding GPU-Centric AI and ML Workloads Requiring Greater Than 50 Kilowatt Racks in the United States and China | +6.2% | United States, China, with secondary adoption in Europe and Asia-Pacific hyperscale hubs | Medium term (2-4 years) |
| Hyperscale Cloud Providers' Sovereign Cloud Roll-outs in Europe | +4.8% | Europe (Germany, France, Netherlands, Ireland), with spillover to Middle East and Asia-Pacific markets enforcing data residency | Medium term (2-4 years) |
| FinTech Real-Time Payment Mandates Accelerating Tier 4 Demand in Singapore and India | +3.5% | Singapore, India, with emerging traction in Brazil, Indonesia, and Middle East fintech corridors | Short term (≤ 2 years) |
| 5G Edge-Core Consolidation Creating Regional Hub Requirements in the Nordics and Oceania | +2.9% | Nordic countries (Sweden, Norway, Denmark), Oceania (Australia, New Zealand), with replication in Southeast Asia | Long term (≥ 4 years) |
| Liquid-Cooled Modular Skids Enabling Brownfield Retrofits in India | +2.4% | India (Delhi-NCR, Mumbai, Bengaluru, Hyderabad), with applicability to Southeast Asia and Latin America brownfield sites | Medium term (2-4 years) |
| Tax Incentives for Hyperscale Campuses in Saudi Arabia's NEOM Digital Valley | +1.8% | Saudi Arabia (NEOM, Riyadh), United Arab Emirates, with potential extension to other Gulf Cooperation Council states | Long term (≥ 4 years) |
| Source: Mordor Intelligence | |||
Exploding GPU-Centric AI and ML Workloads Requiring Greater Than 50 Kilowatt Racks
Training large language models is pushing per-rack loads well past 50 kilowatts, a level at which air cooling becomes economically untenable. Alibaba Cloud logged triple-digit AI product revenue growth for nine consecutive quarters in 2025, underscoring sustained appetite for GPU-dense capacity. [1]Alibaba Group, “Alibaba’s Investments in AI and Comprehensive Consumption Underpin Solid Q2 Results,” alibabagroup.com U.S. hyperscalers are deploying direct-to-chip liquid cooling and rear-door heat exchangers that support 100-kilowatt cabinets, compressing the payback period on liquid infrastructure investments. These deployments shrink stranded capacity and improve power-usage efficiency, shifting competitive advantage toward operators that master liquid-cooling supply chains. Facilities that cannot retrofit quickly are losing bids for AI training workloads, eroding their share of the hyperscale data center market.
Hyperscale Cloud Providers’ Sovereign-Cloud Roll-outs in Europe
European governments now require nationally domiciled entities to control sensitive data, prompting Amazon Web Services, Microsoft Azure, and Google Cloud to build sovereign environments in Germany, France, and the Netherlands. Compliance with GDPR, Germany’s BSI C5, and France’s SecNumCloud frameworks is inflating construction costs and extending timelines, but it also commands premium pricing from regulated tenants. Blackstone’s USD 7 billion joint venture with Digital Realty to erect campuses in Frankfurt and Paris exemplifies the scale of capital redirected to meet these mandates. Operators adept at local permitting and grid negotiations are capturing higher-margin sovereign leases, lifting overall growth in the hyperscale data center market.
FinTech Real-Time Payment Mandates Accelerating Tier 4 Demand
Singapore’s Monetary Authority and India’s National Payments Corporation both require sub-second settlement, which translates to 99.995% uptime and fully fault-tolerant facilities. India’s Unified Payments Interface processed 16 billion transactions in December 2025, compelling geographically dispersed Tier 4 builds to keep latency under 100 milliseconds. Colocation providers offering certified Tier 4 space now command meaningful pricing upside, while operators lacking ISO 27001 and PCI-DSS credentials see payment-sector tenants migrate elsewhere. The result is outsized investment in Tier 4 power and cooling redundancy, boosting the hyperscale data center market in high-growth Asian metros.
5G Edge-Core Consolidation Creating Regional Hub Requirements
Standalone 5G networks are converging edge compute with core cloud, concentrating workloads into regional hubs across the Nordics and Oceania. Dense fiber backbones, abundant hydroelectric power, and cool ambient temperatures make Sweden and Norway preferred landing zones for multi-tenant hyperscale clusters. Australian and New Zealand carriers are replicating the model to lower backbone latency and monetize spectrum auctions, advancing new regional footprints in the hyperscale data center market. The timeline is long-term as operators harmonize spectrum policy, but land banking is already underway.
Restraints Impact Analysis of Hyperscale Data Center Market*
| Restraint | (~) % Impact on CAGR Forecast | Geographic Relevance | Impact Timeline |
|---|---|---|---|
| Water-Usage Restrictions for Evaporative Cooling in the Western United States and Spain | -3.1% | Western United States (California, Arizona, Nevada), Spain, with emerging constraints in Australia and South Africa | Short term (≤ 2 years) |
| GPU Supply-Chain Bottlenecks Limiting Rack-Level Density Expansion | -2.7% | Global, with acute impact in United States, China, and Europe where AI-training demand is concentrated | Short term (≤ 2 years) |
| Rising Heat-Tax and Carbon Levies in the Netherlands, Singapore, and Germany | -1.9% | Netherlands, Singapore, Germany, with potential adoption in United Kingdom and Nordics | Medium term (2-4 years) |
| Mandatory On-site Renewable Quotas in Japan's New Green Energy Act | -1.5% | Japan (Tokyo, Osaka), with similar frameworks under consideration in South Korea and Taiwan | Medium term (2-4 years) |
| Source: Mordor Intelligence | |||
Water-Usage Restrictions for Evaporative Cooling in Arid Regions
Severe drought in California, Arizona, and Nevada has forced water authorities to impose volumetric caps on industrial consumption. Spain’s Ebro River basin adopted similar limits after record-low flow rates in 2024, compelling data centers to transition to closed-loop liquid systems that cost more to install and run. Sites without long-term reclaimed-water contracts risk curtailment orders during summer peaks, threatening service-level agreements. New projects, therefore, prioritize recycled water, coastal desalination, or air-cooled chillers, raising the capital cost of entry and moderating growth in the hyperscale data center market.
GPU supply-chain bottlenecks limiting rack-level density expansion
NVIDIA’s difficulty ramping Blackwell GPU production due to advanced packaging constraints at TSMC has stretched server lead times from 12 to 26 weeks. Hyperscale tenants are deferring move-ins, idling completed white space, and renegotiating leases when compute arrives late. China’s USD 6.1 billion state-led investment in domestic compute capacity highlights geopolitical urgency to localize supply chains. The mismatch between data center build cycles and semiconductor production timelines injects near-term volatility into the hyperscale data center market, penalizing operators lacking multi-year GPU allocation contracts.
*Our forecasts treat driver/restraint impacts as directional, not additive. The impact forecasts reflect baseline growth, mix effects, and variable interactions.
Hyperscale Data Center Market Segment Analysis
By Component:
Electrical Infrastructure Captures AI-Driven Retrofit SpendElectrical Infrastructure is on track to grow at a 24.65% CAGR from 2026 to 2031, eclipsing overall hyperscale data center market growth as operators overhaul power distribution to support 50-100 kilowatt racks. The hyperscale data center market size devoted to Electrical Infrastructure is projected to rise sharply as uninterruptible power supply systems, lithium-ion battery strings, and modular switchgear become mandatory for GPU clusters. Eaton’s 9395XC UPS, rated at 2,250 kilowatts and scalable to 3 megawatts, typifies equipment that aligns with hyperscaler demand for high-density, low-maintenance backup power. [2]Eaton, “Eaton 9395XC UPS,” eaton.com IT Infrastructure, despite accounting for 48.43% of revenue in 2025, is experiencing longer server refresh cycles to amortize accelerator costs, which tempers its relative momentum. Mechanical Infrastructure is pivoting toward direct-to-chip cooling, increasing upfront capital but lowering long-term operating expense via reduced power-usage effectiveness. General Construction margins remain under pressure from steel-price volatility and skilled-labor shortages, while data center information management software gains share by unlocking stranded capacity.
Operators see a strategic imperative to pre-order electrical gear with 18-24-month lead times, locking in pricing before copper and semiconductor inputs inflate further. Vendors offering factory-integrated power skids and on-site commissioning teams command premium margins. Meanwhile, hyperscalers are crowd-sourcing open specifications for busways and battery chemistries to avoid vendor lock-in, which compresses margins for commodity components. Consequently, Electrical Infrastructure suppliers with strong service portfolios and rapid-deployment modules are positioned to gain hyperscale data center market share over the forecast period.


By Tier Type:
Tier 4 Gains as Financial Services Demand Fault ToleranceTier 3 facilities dominated in 2025 with 64.64% of deployments, yet Tier 4 capacity is slated for a 24.84% CAGR to 2031, narrowing the historical gap. The hyperscale data center market for Tier 4 is growing rapidly because real-time banking and payment platforms cannot tolerate more than 26 minutes of annual downtime. Singapore and India now require Tier 4 certification for systemically important payment workloads, significantly boosting demand in those locations. [3]Flexential, “Flexential Acquires Prime Property in Hillsboro,” flexential.com The capital cost delta, at USD 15-20 million per megawatt for Tier 4 versus USD 8-12 million for Tier 3, is offset by lease-rate premiums tied to uptime guarantees.
Hyperscalers' split strategy is to self-build Tier 3 campuses for AI training, where orchestration can absorb short interruptions, and to colocate Tier 4 workloads, such as customer-facing portals and billing. Operators able to deliver mixed-tier campuses on contiguous parcels capture both spend categories and benefit from shared electrical and network backbones. As regulators worldwide tighten resilience standards, notably in Brazil and Saudi Arabia, Tier 4 adoption is expected to rise beyond financial services into healthcare and public-sector workloads, steadily expanding its hyperscale data center market share.
Geography Analysis
North America Hyperscale Data Center Market
North America retained 40.43% of the hyperscale data center market in 2025, underpinned by Northern Virginia’s unprecedented fiber density and robust grid interconnects. Continued mega-campus launches by Amazon Web Services, Microsoft, and Google, coupled with Blackstone’s USD 25 billion development pipeline, reinforce the region’s global preeminence. Cooling-water restrictions in the Southwest and heat-related permitting delays in California, however, are shifting incremental builds toward the Pacific Northwest and Texas, where abundant hydropower and deregulated electricity markets lower levelized costs. Leasing dynamics show hyperscalers pre-committing to entire 100-megawatt phases, crowding out retail colocation demand and locking in power-purchase agreements for renewable energy.
APAC Hyperscale Data Center Market
Asia-Pacific is forecast to post a 24.57% CAGR through 2031, driven by China’s AI infrastructure surge, India’s digital-payments boom, and Singapore’s sovereign-cloud requirements. Alibaba’s pledge to invest RMB 380 billion (USD 53 billion) over three years underscores China’s focus on domestic compute scale. Land scarcity and heat taxes are limiting fresh supply in Singapore, pushing overflow demand to Johor and Batam. India’s data-localization rules and state-level incentives are facilitating Tier 4 greenfield and brownfield builds in Mumbai and Bengaluru. Meanwhile, Japan’s on-site renewable quotas lengthen project timelines in Tokyo and Osaka, steering growth to power-rich Hokkaido and Kyushu. Overall, operators capable of securing multi-megawatt power blocks and navigating heterogeneous permitting regimes will capture the expanding hyperscale data center market.
EMEA and South America Hyperscale Data Center Market
Europe, the Middle East, and Africa display divergent trajectories. European sovereign-cloud policies fragment demand across Germany, France, the Netherlands, and Ireland, inflating investment requirements but enabling premium pricing. Blackstone and Digital Realty’s USD 7 billion joint venture illustrates the concentration of capital into compliant campuses. In the Middle East, Saudi Arabia’s NEOM Digital Valley and the UAE’s Abu Dhabi clusters use tax holidays and rapid permitting to lure hyperscale tenants, positioning the region as an intercontinental traffic bridge. South America is led by Brazil, where abundant wind and solar resources align with carbon-neutral mandates, though currency volatility remains a hurdle. Africa’s nascent demand centers on South Africa and Nigeria; expansion depends on grid upgrades and subsea cable landings. Collectively, these dynamics create a multi-polar hyperscale data center market with region-specific opportunities and risks.
Mordor Intelligence provides coverage of the hyperscale data center market across other key regional markets, including North America, Middle East, Africa, South America, Asia, and Europe, each with their regulatory frameworks and demand patterns. Detailed country-level analysis extends to United States, Israel, South Africa, and Brazil incorporating local coverage and market participation, as required.

Regulatory Landscape
Regulation affecting hyperscale data centers is tightening around energy, water, and resilience reporting, with particular emphasis on high-load sites. In the European Union, the Energy Efficiency Directive (Directive 2023/1791) requires data centers with installed IT power demand of at least 500 kW to monitor and report sustainability indicators to a European database, which elevates metering, DCIM, and auditable energy and water KPIs from procurement preferences into compliance items. In March 2026, the European Commission launched a call for feedback on an EU data center sustainability rating scheme, pointing toward more standardized, comparable performance disclosure that can influence permitting, tenant selection, and financing terms.
Policy pressure is also extending to investment screening and infrastructure classification. In the United States, the Department of the Treasury issued final rules in November 2024 expanding CFIUS authority to review certain investments in real estate and infrastructure, which increases regulatory diligence for data center land acquisition and joint ventures near sensitive locations. Separately, H.R. 9372 was introduced in the US Congress to direct NIST to develop best practices for measuring energy and water use in data centers, explicitly including AI workloads, reinforcing the need for standardized measurement frameworks alongside local grid-load and water-use constraints as deployments move to >50 kW racks.
Competitive Landscape
The hyperscale data center market exhibits moderate concentration. Blackstone’s USD 16 billion acquisition of AirTrunk in 2024 instantly vaulted the firm into the Asia-Pacific top tier, while KKR’s December 2025 investment in Compass Data Centers underscores sustained private-equity appetite. Hyperscalers simultaneously expand self-build programs to avoid colocation premiums, creating a bifurcation in which public REITs cater mainly to enterprise and edge workloads. Private-equity-backed developers leverage flexible capital to pre-fund multi-year power reservations, a structural edge over listed peers tied to dividend payouts.
Technology differentiation is shifting toward liquid-cooling expertise, modular construction, and predictive analytics for energy optimization. Vertiv’s CoolLoop Trim Cooler supports inlet-water temperatures up to 40 °C, aligning with operators that must comply with European F-Gas regulations. Smaller challengers such as STACK Infrastructure and Vantage Data Centers win share by offering build-to-suit campuses with 12-month delivery promises, while legacy incumbents face balance-sheet constraints. Sustainability certifications like ISO 50001 and ISO 14001 are now bid table stakes, with tenants specifying renewable-energy mix and water-consumption intensity in request-for-proposal documents. As a result, operators able to bundle green power, liquid-cooling readiness, and rapid construction enjoy pricing power, reinforcing a tiered competitive hierarchy within the hyperscale data center market.
Strategic partnerships are multiplying. Power-purchase agreements with utility-scale solar farms in Texas and Spain, joint ventures with transmission-grid operators in the Nordics, and land-swap deals with industrial landlords in India all illustrate creative approaches to securing scarce resources. The hyperscale data center industry’s consolidation trend is expected to continue through 2031 as smaller firms unable to finance multi-gigawatt pipelines become acquisition targets.
Hyperscale Data Center Industry Leaders
Digital Realty Trust, Inc.
Equinix, Inc.
Amazon Web Services, Inc.
NTT Ltd.
CyrusOne Inc.
- *Disclaimer: Major Players sorted in no particular order
Hyperscale Data Center Market Companies Covered in this Report
- Digital Realty Trust, Inc.
- Equinix, Inc.
- Amazon Web Services, Inc.
- NTT Ltd.
- CyrusOne Inc.
- Quality Technology Services (QTS)
- Vantage Data Centers LLC
- Microsoft Corporation
- Alphabet Inc. (Google)
- Meta Platforms, Inc.
- Alibaba Group Holding Ltd.
- Tencent Holdings Ltd.
- Baidu, Inc.
- Oracle Corporation
- International Business Machines Corporation
- Switch, Inc.
- STACK Infrastructure
- Flexential Corp.
- Iron Mountain Data Centers
- OVHcloud

Market Opportunities and Future Outlook
A near-term opportunity is emerging around multi-gigawatt, AI-oriented hyperscale campuses that bundle land, power procurement, and high-density cooling as integrated offerings. Large disclosed projects are creating visible whitespace for developers, utilities, and equipment vendors. In July 2026, Meta announced an expansion of its Hyperion campus in Richland Parish, Louisiana to 5 GW of capacity with a total investment reaching USD 50 billion, while Oracle and OpenAI started construction on the Stargate campus in Saline Township, Michigan designed to reach 1 GW with an estimated USD 10 billion development cost. These projects reinforce demand for rapid-to-power site development, factory-integrated electrical skids, and liquid-cooling-ready mechanical designs aligned to GPU-rich architectures.
A second opportunity is tied to compliance-led design and sustainability retrofits that convert regulatory constraints into differentiated capacity, especially in Europe and water-stressed markets. The EU move toward comparable energy-performance disclosure, alongside documented low heat-reuse penetration in EU data centers (European Commission reporting in 2025), supports waste-heat recovery and district-heating integration, illustrated by Equinix partnering with A2A in July 2026 in Milan to connect data center waste heat to a city district heating network with a stated 225 GWh annual thermal energy recovery target. Separately, projects that operationalize recycled-water cooling and metered water-use reporting can improve permitting outcomes and tenant traction in constrained metros, evidenced by AWS highlighting Hong Kong recycled-water cooling initiatives in July 2026 as part of its data center sustainability program.
Recent Industry Developments in Hyperscale Data Center Market
- July 2026: Equinix partnered with A2A in Milan to integrate data center waste heat into the city district heating network, with a stated target of 225 GWh of annual thermal energy recovery. The move strengthens Equinixs positioning in markets where heat-reuse, energy reporting, and decarbonization requirements increasingly influence permitting and enterprise procurement.
- December 2025: KKR agreed to invest several billion USD in a portion of Compass Data Centers operating assets, with proceeds earmarked for hyperscale campus expansion. The transaction highlights continued private-equity capacity to fund multi-site, power-secured hyperscale buildouts even as grid access and equipment lead times become critical constraints.
- September 2024: Blackstone announced the USD 16 billion acquisition of AirTrunk, expanding its data center footprint across Asia-Pacific. The deal accelerated consolidation among hyperscale-focused platforms and increased competitive pressure on developers to secure land banks and multi-megawatt power reservations in key APAC hubs.


Hyperscale Data Center Market Report Scope and Research Methodology
Market Definition and Coverage
This market covers revenue tied to hyperscale data center facilities that support large cloud and high-throughput computing workloads. These sites are typically built and run at campus scale, with high power availability and higher server density.
Scope exclusions: Edge sites below 10 MW, legacy carrier hotels, and containerized micro-sites located inside enterprise campuses are excluded from this sizing.
Segments Covered in This Report
- By Component
- IT Infrastructure
- Server Infrastructure
- Storage Infrastructure
- Network Infrastructure
- Electrical Infrastructure
- Power Distribution Units
- Transfer Switches and Switchgears
- UPS Systems
- Generators
- Other Electrical Infrastructure
- Mechanical Infrastructure
- Cooling Systems
- Racks
- Other Mechanical Infrastructure
- General Construction
- Core and Shell Development
- Installation and Commisioning Services
- Design Engineering
- Fire Detection, Suppression and Physical Security
- DCIM/BMS Solutions
- IT Infrastructure
- By Tier Type
- Tier 3
- Tier 4
- By Geography
- North America
- United States
- Canada
- Mexico
- Europe
- United Kingdom
- Germany
- Netherlands
- France
- Ireland
- Rest of Europe
- Asia-Pacific
- China
- India
- Singapore
- Japan
- Australia
- Indonesia
- Rest of Asia-Pacific
- South America
- Brazil
- Chile
- Rest of South America
- Middle East and Africa
- Middle East
- United Arab Emirates
- Saudi Arabia
- Turkey
- Rest of Middle East
- Africa
- South Africa
- Nigeria
- Rest of Africa
- Middle East
- North America
Data Sources, Market Sizing, and Validation
Desk Research
Desk work starts with public baselines that anchor the demand pool and the pace of buildouts, and then we layer in operator and supply chain signals to reduce guesswork. For hyperscale data centers, we typically review sources such as Uptime Institute publications, IEA electricity and energy efficiency releases, ITU connectivity indicators, and U.S. DOE efficiency materials to understand power, reliability, and utilization context.
To keep the model grounded in real builds, we also use public filings and investor presentations, data center and utility interconnection announcements, and reputed press coverage of new campus awards and expansions. When needed, approved paid subscriptions are used for company financials and intelligence, patent lookups, and shipment-level import-export checks for large electrical and mechanical equipment. These examples are not exhaustive, and many other public sources were also used for data collection, validation, and clarification during the study.
Primary Interviews and Surveys
Primary inputs were gathered from data center developers, hyperscale operators, colocation providers, EPC and design experts, and critical equipment suppliers, so assumptions could be tested against what is being built and contracted. Because this is a global market, we also made sure the respondent views were balanced across APAC, EMEA, and the Americas to confirm differences in build velocity, rack density, and power availability.
Distribution of primary research fieldwork respondents
| Company type | Respondent position | Region |
|---|---|---|
| Top tier: 38% | CXOs: 18% | APAC: 45% |
| Mid tier: 41% | Functional/Unit leaders: 23% | EMEA: 30% |
| Smaller Players: 21% | Managers: 59% | Americas: 25% |
Market-Sizing & Forecasting
Sizing is built using top-down reconstruction based on hyperscale capacity signals, where the installed and planned critical IT load, server scale thresholds, and build pipeline are translated into yearly spend and operating revenue. Once the totals are formed, they are checked using selective bottom-up approximations, such as sampled campus count rollups by region and a reasonableness pass of spend per MW and refresh intensity. Totals are then adjusted only when the checks remain consistent.
Several practical inputs are tracked because they move the market in visible ways. These include added MW by geography, average rack density and the direction of AI-driven density changes, construction lead times and fit-out phasing, power pricing and grid availability constraints, and hardware refresh cycles that affect run-rate spending. Forecasts are created using scenario analysis, where base, slower, and faster build cases are set around permitting and power delivery timelines. The final trajectory is then selected after reconfirming the assumptions with interview feedback.
Where bottom-up views are incomplete for smaller markets or private projects, gaps are filled using proxy indicators like announced capacity ranges, typical MW-to-floor space ratios, and peer project cost bands. These are then cross-checked against the top-line capacity model to avoid overstating local ramps.
Data Validation & Update Cycle
Validation is done through repeated cross-checks between the model output and independent signals, and any large variance triggers a deeper review before numbers are finalized. We compare results against capacity additions, regional power delivery constraints, and publicly visible build activity. We then re-check the implied spend per MW so the totals remain realistic.
Before sign-off, outputs go through multi-step internal reviews where assumptions, conversion factors, and year alignment are re-verified. Any outlier growth step is reworked until it can be explained clearly. The report is refreshed annually, and interim updates are made when major events happen, such as large campus announcements, policy shifts, or power market disruptions. Right before delivery, a fresh pass is completed so clients receive the most current view we can support.
Mordor Intelligence's Hyperscale Datacenter Market Size Compared With Other Published Estimates
Published market sizes for hyperscale data centers can look far apart because different studies do not always count the same revenue pool, and they also handle timing and currency conversions differently. Variations often come from how construction spend, hardware refresh, and managed operations are treated, and whether smaller edge-style facilities are mixed into the same total.
Evidence from announced campus power additions, reported server scale thresholds, and regional pipeline checks helps tie the sizing to a measurable capacity buildout. This is then translated into the USD 205.48 B (2026) estimate in Mordor Intelligence's model. Some publishers also report an investment view that folds in adjacent site types or longer retrofit tails, and a few apply smoother growth curves that do not reflect permitting and power delivery bottlenecks that show up in interviews and public project trackers.
Benchmark comparison
| Source | Market Size | Gaps in Research Methodology |
|---|---|---|
| Mordor Intelligence | USD 205.48 B (2026) | |
| Industry Research Publisher A | USD 167.02 B (2025) | Uses an earlier base year and may apply a different boundary for what is counted as hyperscale, which can shift totals when edge-adjacent facilities and service revenue are treated differently. |
| Global Advisory Publisher B | USD 336.85 B (2024) | Presented as an investment number for 2024, which can include broader capital outlays and adjacent facility activity that is not always limited to hyperscale thresholds, making it larger than a revenue-led scope. |
Looking across the three figures, the spread is mainly explained by what is counted (revenue versus investment-style totals), the hyperscale threshold applied, and the year used for currency and project timing. By keeping the inputs traceable to capacity signals and then stress-testing spend intensity with interview feedback, our estimate stays practical to reproduce and easier to reconcile with what is being built on the ground.


Key Questions Answered in the Report
What is the projected value of the hyperscale data center market in 2031?
The market is expected to reach USD 596.10 billion by 2031, reflecting a 23.74% CAGR.
Which component category is expanding fastest in hyperscale facilities?
Electrical Infrastructure is forecast to grow at a 24.65% CAGR as operators upgrade power systems for 50-100 kilowatt GPU racks.
Which region is projected to record the highest growth through 2031?
Asia-Pacific is projected to expand at a 24.57% CAGR, driven by AI investments in China, India’s digital-payments boom, and sovereign-cloud demand in Singapore.
Why is Tier 4 capacity accelerating in Asia?
Real-time payment regulations in Singapore and India require 99.995% uptime, prompting a surge in Tier 4 builds with fully redundant power and cooling.
Page last updated on:


