North America Hyperscale Data Center Market Size and Share
Market Overview
| Study Period | 2019 - 2031 |
|---|---|
| Forecast Data Period | 2025 - 2031 |
| Historical Data Period | 2019 - 2023 |
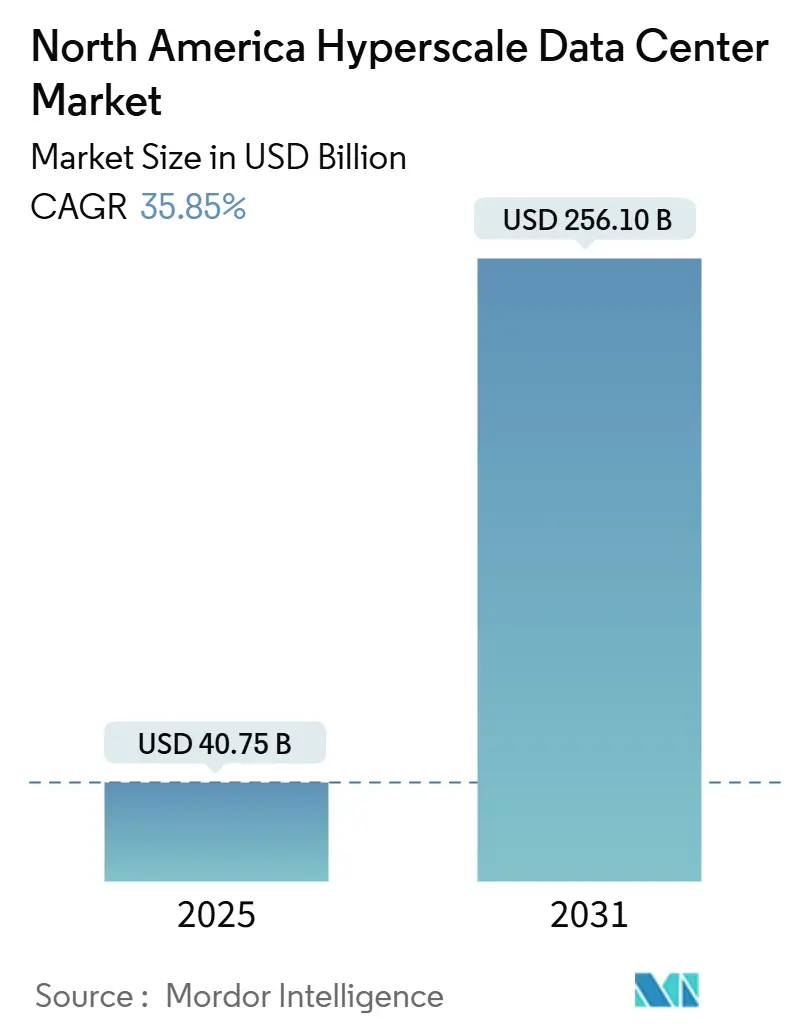
| Market Size (2025) | USD 40.75 Billion |
| Market Size (2031) | USD 256.10 Billion |
| Growth Rate (2025 - 2031) | 35.85% CAGR |
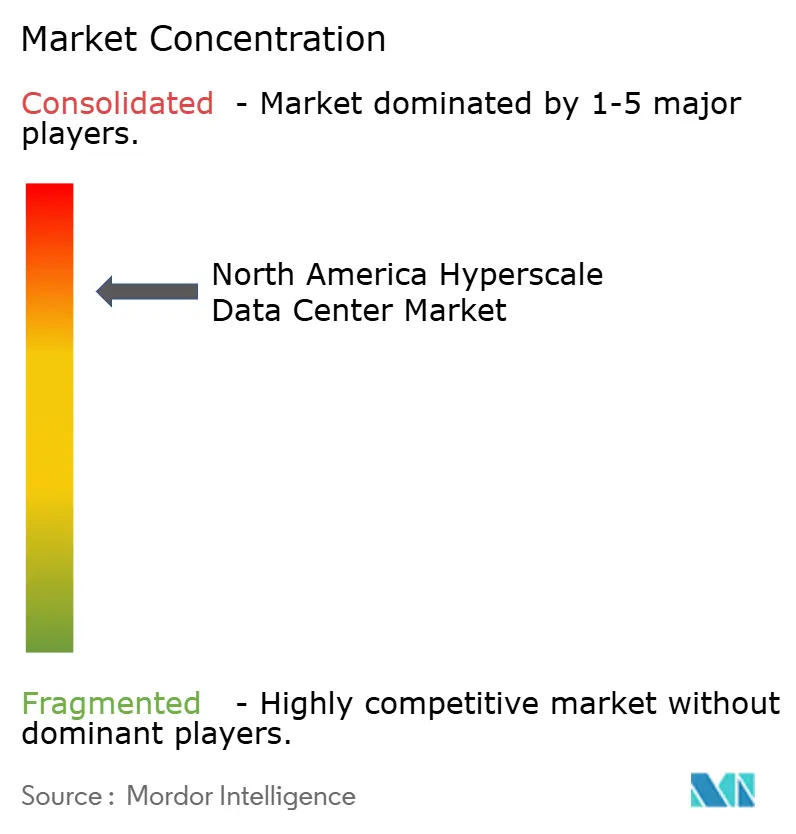
| Market Concentration | High |
Major Players *Disclaimer: Major Players sorted in no particular order Image © Mordor Intelligence. Reuse requires attribution under CC BY 4.0. | |
North America Hyperscale Data Center Market Analysis by Mordor Intelligence
The North America hyperscale data center market size stands at USD 40,748.92 million in 2025 and is projected to reach USD 256,096.52 million by 2031, advancing at a 35.85% CAGR. The volume of installed IT capacity climbs from 36,307.04 MW to 77,457.07 MW during the same period, signaling a 13.46% CAGR in power demand. The expansion reflects a rapid pivot toward AI-centric workloads that push rack densities far beyond legacy thresholds, stimulate heavy investment in liquid-based thermal systems, and elevate the cost of power delivery infrastructure. Spending priorities have also shifted: network gear absorbs 32.0% of outlays because high-bandwidth links are essential for distributed model training, while mechanical systems for liquid and immersion cooling now represent the fastest-growing cost item. Competitive pressure is moderate; hyperscalers continue to self-build 65.0% of new capacity, yet colocation specialists defend share by rolling out AI-ready suites in tax-incentivized corridors.
Key Report Takeaways
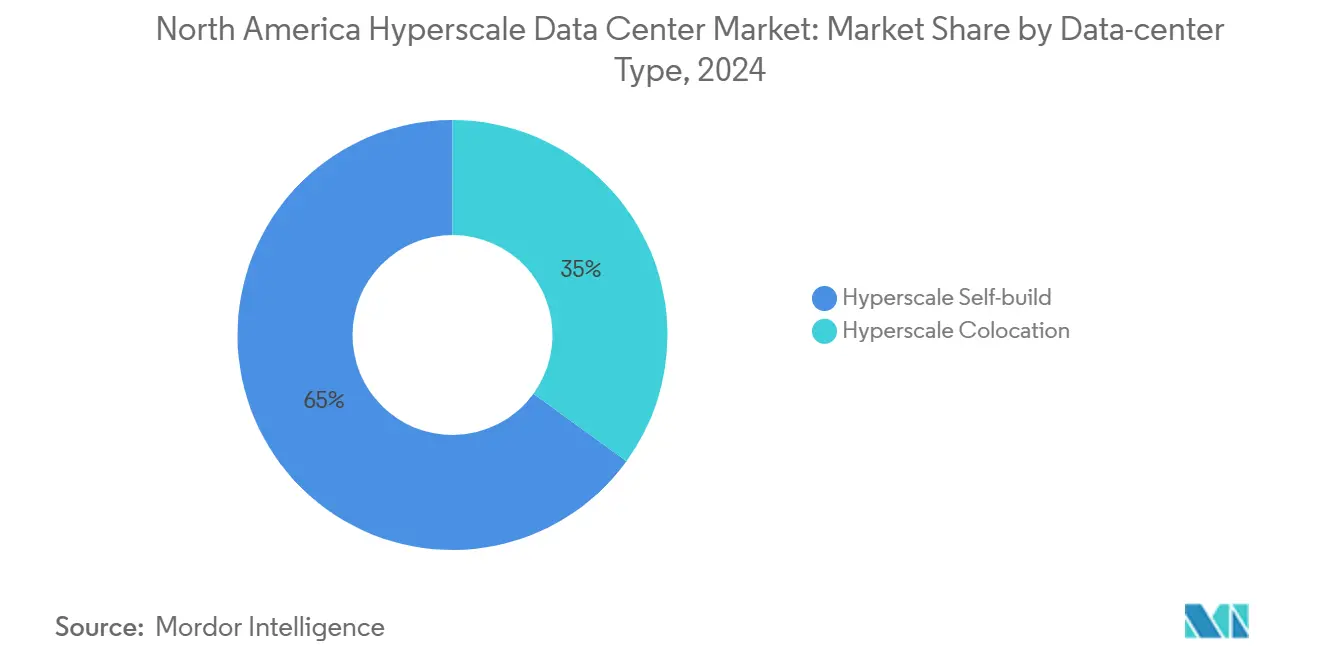
- By data center type, hyperscaler self-builds held 65.0% of the North America hyperscale data center market share in 2024.
- By component, network infrastructure led with 32.0% share of the North America hyperscale data center market size in 2024.
- By tier standard, Tier IV deployments are forecast to expand at an 11.7% CAGR through 2030.
- By end-user industry, AI/ML cloud services within the cloud and IT group are growing at a 13.90% CAGR.
- By data center size, mega (>60 MW) data center are growing at a 14.50% CAGR.
- By country, Mexico is projected to outpace peers with a 17.20% CAGR to 2031.
Figures recorded within North america feed into a worldwide estimate while studying the global industry. Mordor Intelligence's hyperscale data center market size captures this aggregation.
North America Hyperscale Data Center Market Trends and Insights
Drivers Impact Analysis Table*
| Driver | (~) % Impact on CAGR Forecast | Geographic Relevance | Impact Timeline |
|---|---|---|---|
| AI/ML rack power-density explosion | +8.20% | United States, Canada | Short term (≤2 years) |
| Public-sector sovereign-cloud zones | +4.10% | United States federal regions | Medium term (2-4 years) |
| 5G edge–core convergence | +3.80% | Secondary North American metros | Medium term (2-4 years) |
| GenAI inference clusters | +6.50% | Primary US metros, Canada | Short term (≤2 years) |
| SMR-backed green PPAs | +2.90% | Select US & Canadian provinces | Long term (≥4 years) |
| Tax-incentive fast-track corridors | +3.70% | Texas, Georgia, Ohio | Medium term (2-4 years) |
| Source: Mordor Intelligence | |||
AI/ML Rack Power-Density Explosion
Rack densities now reach 300 kW for AI training arrays, demanding direct-to-chip or immersion cooling that can account for up to 60% of facility capital cost [1].Stack Infrastructure, “Hyperscale & Enterprise Data Center Case Studies,” stackinfra.com Liquid methods drive PUE below 1.1 and require new high-amperage busways, shaping a premium tier where AI-optimized halls command higher lease rates. Microsoft’s Mexican build includes factory-installed liquid loops to host next-generation accelerators. Dense power draws also reshape electrical topologies, enforcing wider use of redundant feeds to prevent training interruptions.
Public-Sector Sovereign-Cloud Zones
JWCC and FedRAMP High projects demand air-gapped halls, electromagnetic shielding, and biometric controls that raise construction cost 30-50% over commercial designs [2].U.S. Department of Defense, “Joint Warfighting Cloud Capability,” defense.gov State and municipal agencies mirror these residency rules, carving out regionally isolated clusters. Long procurement cycles provide stable revenue once awarded, but bidders must invest upfront in secure land, hardened shells, and specialized staffing.
GenAI Inference Clusters Demanding Campus-Scale Liquid Cooling
Continuous inference loads favor centralized cooling plants that supply multiple buildings, lowering per-MW cooling expense 25–35% compared with distributed air coils. Site selection now weighs water availability and mild temperatures for thermal efficiency. Meta’s Prometheus campus shows how aggregated liquid loops permit tighter server spacing within current footprints, though the approach intensifies demand for talent skilled in fluid-system upkeep
SMR-Backed Green PPAs Lowering Lifetime PUE
Small modular reactors promise 24/7 carbon-free electricity and PUE figures below 1.05 via waste-heat capture. The modular design aligns with phased expansion plans, but the 5-7-year licensing horizon demands early capital commitment. Amazon’s involvement signals hyperscalers’ appetite for nuclear-enabled resilience
Restraints Impact Analysis*
| Restraint | (~) % Impact on CAGR Forecast | Geographic Relevance | Impact Timeline |
|---|---|---|---|
| Water-use limits on evaporative cooling | –2.8% | California, Oregon, Washington | Short term (≤2 years) |
| GPU/optic supply bottlenecks | –4.2% | North America-wide | Short term (≤2 years) |
| Heat- and carbon-levies | –1.9% | New York, California metros | Medium term (2-4 years) |
| Local-grid curtailment rules | –3.1% | Primary US metros | Medium term (2-4 years) |
| Source: Mordor Intelligence | |||
Water-Use Limits on Evaporative Cooling
Emergency drought measures in California curb evaporative towers that consume 1.5–2.0 gallons per kWh, compelling operators to adopt closed-loop liquid systems that cost 40–60% more to install [3]. Oregon and Washington follow suit, affecting nearly one-third of West Coast capacity. Although capital outlay rises, ongoing water fees fall and compliance risk drops, supporting long-term economics.
GPU/Optic Supply Bottlenecks
CoWoS packaging and HBM shortages lengthen delivery cycles for AI GPUs to 12–18 months, while 400G/800G optics now post 40-week lead times. Hyperscalers lock in multiyear supply deals that raise inventory costs and may force sub-optimal hall designs, trimming operational efficiency by up to 25%. Delays also spill over to switchgear and pump assemblies, extending build schedules as much as a year.
*Our forecasts treat driver/restraint impacts as directional, not additive. The impact forecasts reflect baseline growth, mix effects, and variable interactions.
Segment Analysis
By Data Center Type: Self-Build Dominance Accelerates
Self-build projects captured 65.0% of North America hyperscale data center market share in 2024 and are growing at 12.8% CAGR as cloud leaders tailor halls for AI density. The colocation slice, at 35.0%, seeks relevance through AI-ready modules but faces shrinking margins as hyperscalers prefer direct control. Google’s Querétaro campus illustrates self-build customization with proprietary cooling and silicon for inference. Colocation firms answer by offering liquid-equipped suites yet must raise capital to match.


By Component: Network Infrastructure Leads Investment
Network gear absorbed 32.0% of 2024 spending in the North America hyperscale data center market, mirroring the bandwidth thirst of distributed training clusters. Liquid and immersion cooling, the fastest-rising component at 15.4% CAGR, follows AI density. Crown Castle’s 400G upgrades typify demand for high-throughput routing. Electrical systems trend toward busways capable of 50 kW racks, while general construction budgets stretch to house chillers, pumps, and reinforced floors.
By Tier Standard: Tier IV Adoption Accelerates
Tier III remains dominant at 60.0% share. Yet Tier IV is expanding 11.7% annually because continuous AI training cannot tolerate downtime. Financial houses adopt Tier IV to shield algorithmic trading engines from interruptions. Added redundancy—dual liquid loops, twin utility feeds—raises build cost but supports higher-price SLAs.
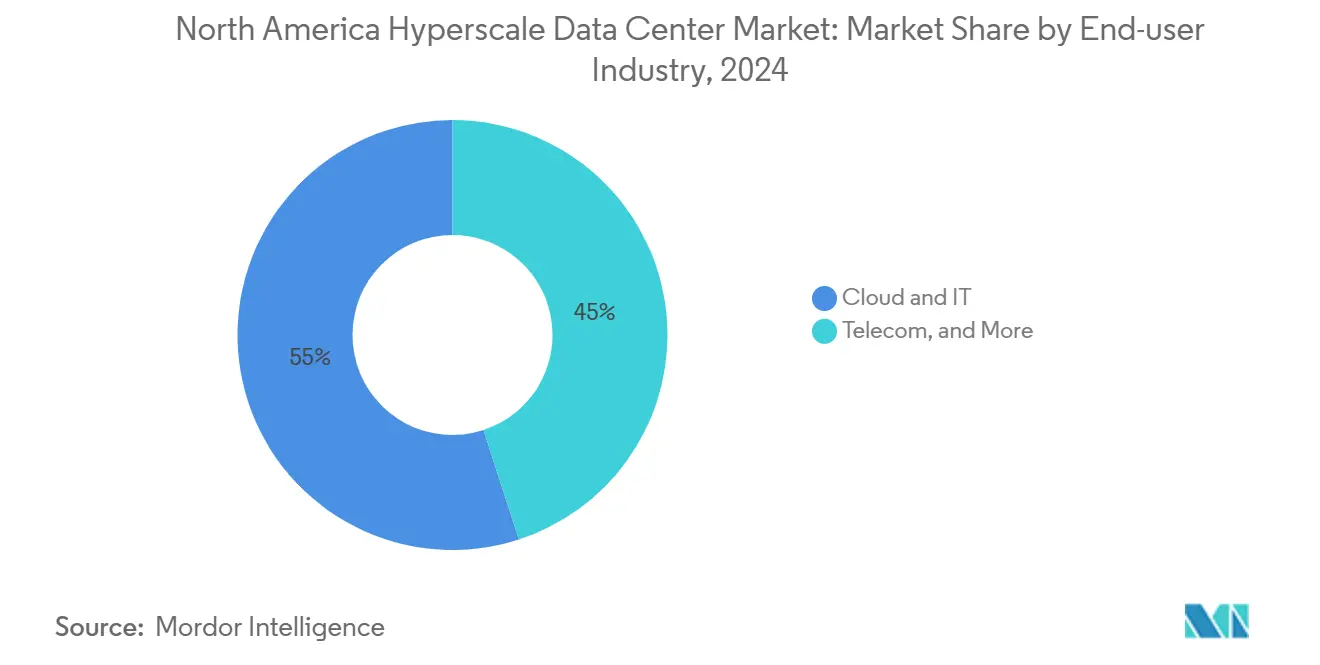
By End-User Industry: AI/ML Cloud Services Drive Growth
Cloud and IT accounts for 55.0% of demand, with AI/ML cloud services advancing 13.90% CAGR. Governments pursue sovereign instances, banks migrate risk models, manufacturers connect Industrial IoT, and telecoms prepare the 5G edge. Verizon’s low-latency edge rollouts show why carriers tie hyperscale core and edge nodes
By Data Center Size: Mega-Scale Facilities Accelerate
Large halls up to 25 MW still represent 42.0% of deployments. Mega campuses above 60 MW are the fastest-growing slice at 14.50% CAGR, exploiting shared cooling and power to lower per-MW cost. Meta’s Prometheus complex exemplifies multi-gigawatt ambition and rising liquid cooling sophistication.
Geography Analysis
The United States holds 90.0% share of the North America hyperscale data center market, supported by mature metros such as Northern Virginia, Dallas–Fort Worth, and Silicon Valley. Electricity constraints inside big hubs shift incremental builds to tax-supported corridors in Texas, Georgia, and Ohio, illustrated by AEP’s tariff proposal for Ohio cloud clusters.
Canada offers renewable power, cool climates, and data sovereignty advantages that cut PUE and attract backup copies of US workloads, though higher land and labor expenses temper capacity scale.
Mexico is the bright spot, expanding 17.20% annually. Google, Microsoft, and Amazon have all announced billion-dollar builds, leveraging proximity to US consumers and lower construction cost.
Mordor Intelligence evaluates the hyperscale data center market across all key regional markets, including Asia, Europe, and Middle East, with deeper country-level insights covering United States, Canada, Australia, Taiwan, Italy, and Saudi Arabia.
Competitive Landscape
Cloud Service Providers leading the majority of hyperscale demand in North America
Market structure is highly concentrated: AWS, Microsoft Azure, and Google Cloud together hold more than 60% of infrastructure share, validating a scale-tilted model in which purchasing power and proprietary silicon development set high entry barriers. Vertical integration secures supply chains from power to server chip, and custom photonics interconnects cut latency across multi-rack AI clusters. Specialised colocation operators such as STACK Infrastructure, Digital Realty, and QTS occupy the next tier, focusing on build-to-suit campuses and standardised contract shells that appeal to fast-growing SaaS tenants.
AI workloads are re-ranking supplier preferences. Operators that offer liquid-ready manifolds, rear-door heat exchangers, and 400 V DC bus bars gain the inside track on new bids. CoreWeave, an AI-focused host, illustrates how niche capability—GPUs on demand—can draw equity injections and Fortune 500 contracts, even in a consolidated arena. Colocation builders differentiate further through rapid modular construction that compresses shell delivery below nine months, insulating customers from transformer lead-time disruptions.
North America Hyperscale Data Center Industry Leaders
Amazon Web Services
Microsoft Corporation
Google LLC
Meta Platforms Inc.
Oracle Corporation
- *Disclaimer: Major Players sorted in no particular order

Recent Industry Developments
- January 2025: Microsoft announced a USD 80 billion buildout in the United States focused on AI-optimised data centers.
- March 2025: ODATA energised 200 MW at its DC QR03 campus in Querétaro, Mexico, as part of a USD 3.3 billion investment.
- May 2025: STACK Infrastructure secured USD 6 billion in green financing covering new campuses in Virginia, Oregon, and Ontario.
- March 2025: Stream Data Centers broke ground on a 200 MW campus in San Antonio, adding momentum to Texas’s diversified energy strategy.
- April 2025: Compass Datacenters began converting the former Sears headquarters in Illinois into a USD 10 billion hyperscale park; phase-one shell completion will accelerate Chicago-area capacity.
- May 2025: ODATA launched a 300 MW hyperscale facility in Mexico, the country’s largest to date.
- February 2025: Digital Realty announced a USD 10 billion U.S. Hyperscale Data Center Fund focused on AI halls.


Research Methodology Framework and Report Scope
Market Definitions and Key Coverage
Our study defines the North American hyperscale data center market as all self-built or colocation facilities in the United States, Canada, and Mexico designed for workloads that regularly exceed 4 MW per tenant and house thousands of servers supported by dedicated power, cooling, and high-speed network fabrics.
Scope Exclusion: edge micro-sites below 4 MW and traditional enterprise server rooms are not counted in this analysis.
Segmentation Overview
- By Data Center Type
- Hyperscale Self-build
- Hyperscale Colocation
- By Component
- IT Infrastructure
- Server Infrastructure
- Storage Infrastructure
- Network Infrastructure
- Electrical Infrastructure
- Power Distribution Unit
- Transfer Switches and Switchgears
- UPS Systems
- Generators
- Other Electrical Infrastructure
- Mechanical Infrastructure
- Cooling Systems
- Racks
- Other Mechanical Infrastructure
- General Construction
- Core and Shell Development
- Installation and Commissioning
- Design Engineering
- Fire, Security and Safety Systems
- DCIM/BMS Solutions
- IT Infrastructure
- By Tier Standard
- Tier III
- Tier IV
- By End-user Industry
- Cloud and IT
- Telecom
- Media and Entertainment
- Government
- BFSI
- Manufacturing
- E-Commerce
- Other End Users
- By Data Center Size
- Large (Less than equal to 25 MW)
- Massive (Greater than 25 MW and less than equal to 60 MW)
- Mega ( Greater than 60 MW)
- By Geography
- United States
- Canada
- Mexico
Detailed Research Methodology and Data Validation
Primary Research
Mordor analysts interviewed hyperscale design engineers, colocation sales leaders, and power-utility planners across the US Sunbelt, Ontario, and Queretaro. These conversations tested server-density assumptions, lead-time shifts for 34.5 kV feeders, and liquid-cooling adoption rates, allowing us to tighten vacancy and ASP ranges suggested by desk work.
Desk Research
We began with energy-utility filings, Federal Energy Regulatory Commission load data, US Energy Information Administration electricity-price series, and customs import statistics for servers and switchgear. Trade groups such as the Uptime Institute and the Information Technology Industry Council supplied failure-rate and PUE benchmarks, while regional bodies like the Northern Virginia Technology Council offered hub-level build-out insights. Financial disclosures, Form 10-Ks, project tender logs, and news archives on Dow Jones Factiva rounded out the secondary stack. According to Mordor Intelligence's paid access to D&B Hoovers and Marklines, supplier revenue splits and shipment trends helped anchor capital-cost curves. The sources listed here illustrate the breadth of inputs; many additional datasets informed intermediate checks and clarifications.
Market-Sizing & Forecasting
We deploy a top-down model that reconstructs demand pools from installed IT load, utility connection queues, and announced campus pipelines, subsequently cross-checked with selective bottom-up snapshots such as sampled rack counts multiplied by averaged hardware bills. Key variables like average rack power draw, new MW added per $ billion of capex, regional PPA pricing, data-sovereignty mandates, and GPU attach rates drive the value conversion. A multivariate regression links these indicators to annual revenue, while ARIMA smoothing handles short-term volatility. Data gaps in supplier roll-ups are bridged using weighted averages from proximate projects confirmed during primary calls.
Data Validation & Update Cycle
Outputs pass three-layer reviews: automated variance scans, peer analyst audits, and a senior sign-off. We refresh every twelve months and trigger interim revisions after material events such as utility tariff hikes or federal subsidy changes. Before release, an analyst re-runs the latest quarter's inputs to keep figures current.
Credibility Anchor: Why Mordor's North America Hyperscale Data Center Baseline Commands Reliability
Published estimates often diverge because firms choose different facility thresholds, revenue-recognition points, and refresh cadences.
Key gap drivers include: some publishers fold enterprise cloud services into market value, others apply conservative 12-15 % CAGRs that ignore AI rack-density shocks, and many translate MW into dollars with static $/MW factors that lag real-time ASP inflation. Mordor's model updates density, pricing, and build-cost coefficients annually, and our scope isolates hyperscale-qualified plants only.
Benchmark comparison
| Market Size | Anonymized source | Primary gap driver |
|---|---|---|
| USD 40.75 B (2025) | Mordor Intelligence | - |
| USD 9.53 B (2024) | Regional Consultancy A | Uses 50 MW cut-off, excludes colocation self-build revenue, refreshes every two years |
| USD 138 B (2025) | Trade Journal B | Bundles wholesale colocation and large enterprise sites; applies fixed 22 % CAGR without density re-calibration |
These contrasts show that Mordor's disciplined scope filters and annually tuned variables deliver a balanced, transparent baseline that decision-makers can trace back to clear power, pricing, and capacity signals.


Key Questions Answered in the Report
What is the projected value of the North America hyperscale data center market by 2031?
The market is expected to reach USD 256,096.52 million by 2031.
Which segment is growing fastest within the end-user category?
AI/ML cloud services are advancing at a 13.90% CAGR.
Why are liquid cooling systems gaining traction?
AI workloads raise rack power density to as high as 300 kW, and liquid cooling is more efficient at handling that heat while keeping PUE near 1.1.
Which country offers the highest growth rate in the region?
Mexico leads with a forecast 17.20% CAGR due to nearshoring incentives and hyperscaler investment.
How significant are network infrastructure costs?
Network equipment accounts for 32.0% of component spending because high-bandwidth fabrics are vital for distributed AI processing.
What reliability level is becoming common for AI-critical halls?
Tier IV facilities are expanding 11.7% yearly as enterprises demand zero downtime for continuous AI training and inference.
Page last updated on:


