
Natural Honey Market Size and Share
Natural Honey Market Analysis by Mordor Intelligence
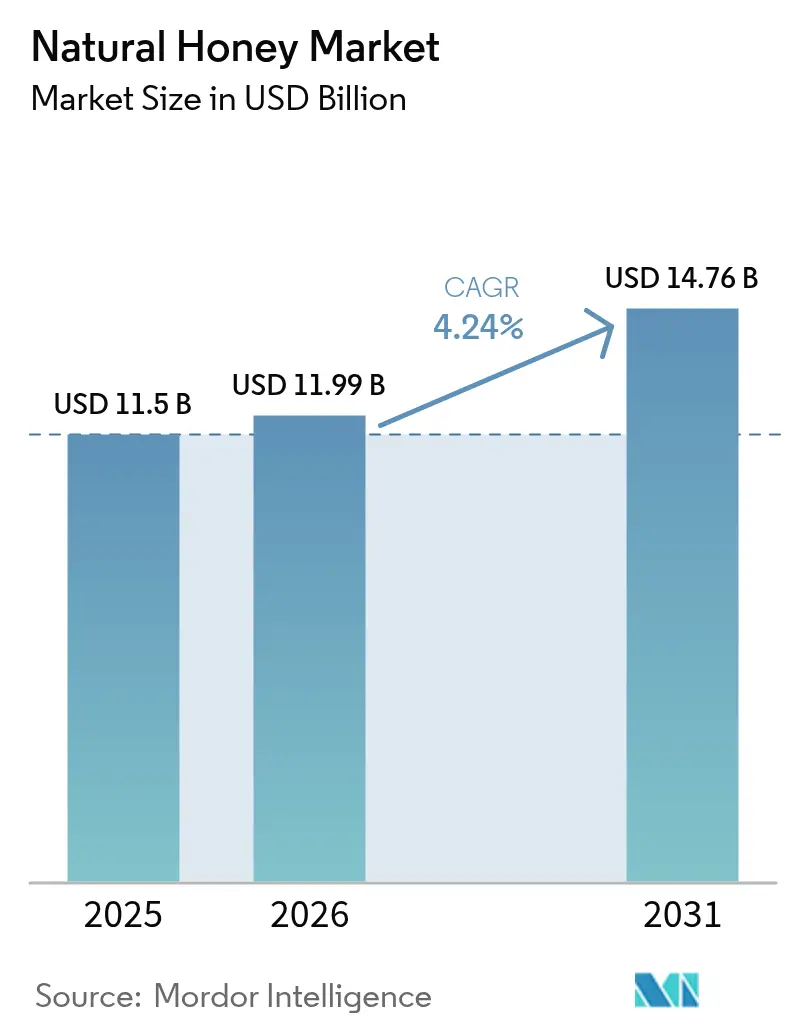
The natural honey market size was valued at USD 11.5 billion in 2025 and estimated to grow from USD 11.99 billion in 2026 to reach USD 14.76 billion by 2031, at a CAGR of 4.24% during the forecast period (2026-2031). Sustained demand for clean-label products, wider adoption of precision apiculture, and stricter origin-labeling rules are reshaping supply chains and lifting value capture across producing regions. Industrial buyers are replacing refined sugar with authenticated honey in beverages, baked goods, and sports nutrition, while healthcare providers are expanding medical-grade applications that command premium pricing. Asia-Pacific remains the consumption anchor, accounting for 46.0% of 2024 volume, aided by China’s dual role as top producer and fast-growing domestic market[1]Source: FAO Statistics Division, “Honey Statistics,” FAO, fao.org. Modern hive-monitoring systems are lowering mortality rates, yet climate-driven nectar flow volatility and Varroa infestations still threaten 55% of colonies each year, pushing producers toward IoT-enabled early-warning solutions. On the trade front, the European Union’s 2024/1438 regulation has made batch-level traceability a ticket-to-play, rewarding exporters that invest in blockchain authentication and penalizing low-cost suppliers that cannot verify origin[2]Source: Department of Agriculture, Fisheries and Forestry, “Honey: Updates to EU TRACES for Australian Honey Establishments,” agriculture.gov.au.
Key Report Takeaways
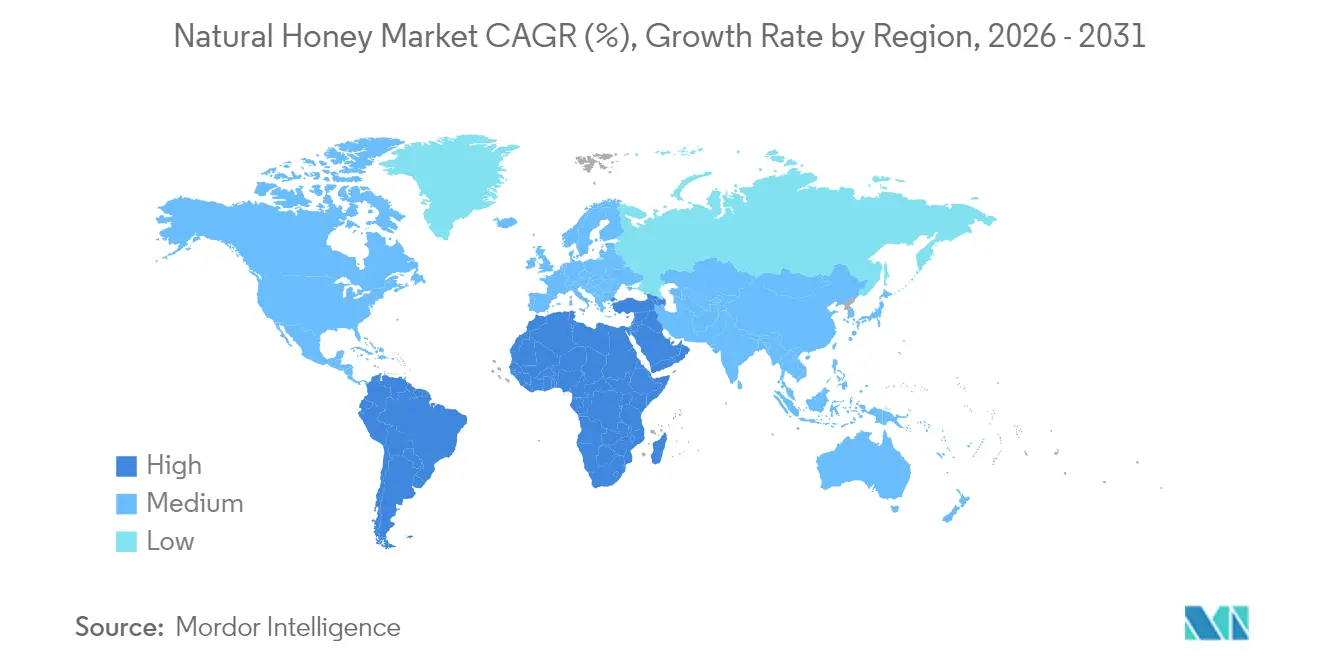
- By geography, Asia-Pacific dominated the natural honey market share with 45.30% consumption in 2025, and Africa is forecast to post the highest regional CAGR at 6.39% through 2031.
Note: Market size and forecast figures in this report are generated using Mordor Intelligence’s proprietary estimation framework, updated with the latest available data and insights as of 2026.
Global Natural Honey Market Trends and Insights
Drivers Impact Analysis*
| Driver | (~) % Impact on CAGR Forecast | Geographic Relevance | Impact Timeline |
|---|---|---|---|
| Rising demand for natural sweeteners in processed foods and beverages | +1.2% | North America and Europe | Medium term (2-4 years) |
| Growth of industrial-scale precision apiculture technologies | +0.8% | North America, Europe, Asia-Pacific | Long term (≥4 years) |
| Strengthening traceability rules in major import markets | +0.6% | Europe and North America | Medium term (2-4 years) |
| Expansion of functional and medical-grade honey applications | +0.5% | Developed markets worldwide | Long term (≥4 years) |
| Government-backed apiculture support programs in producer nations | +0.4% | Asia-Pacific, Middle East, Africa | Short term (≤2 years) |
| Blockchain-enabled transparency combating honey adulteration | +0.3% | Global premium segments | Long term (≥4 years) |
| Source: Mordor Intelligence | |||
Rising Demand for Natural Sweeteners in Processed Foods and Beverages
Food and beverage manufacturers are pivoting toward honey to satisfy clean-label and sugar-reduction mandates. In South Korea, 55% of shoppers ranked hot honey as their preferred spicy flavor in 2024, driving a surge of clover-honey-infused sports drinks and snack bars. Beverage formulators in the United States increasingly select wildflower honey to replace high-fructose corn syrup in ready-to-drink teas, creating incremental demand for bulk-grade supply. The Winter Fancy Food Show’s 2024 Trendspotter panel listed honey among the top three most versatile ingredients, signaling longevity for formulation pipelines. Industrial users, which already consume nearly 80% of U.S. honey imports, are now requesting tighter flavor-profile specs to ensure batch consistency across national rollouts[3]Source: USDA Economic Research Service, “Sugar and Sweeteners Yearbook Tables—Honey Data,” ers.usda.gov. This confluence of culinary creativity and health awareness strengthens the natural honey market’s volume outlook over the medium term.
Growth of Industrial-Scale Precision Apiculture Technologies
Commercial beekeepers are installing IoT sensors that monitor temperature, humidity, and acoustic signals inside hives, generating real-time alerts on colony stress. The University of California, Riverside’s Electronic Bee-Veterinarian platform costs under USD 50 per hive yet predicts heat stress days in advance, enabling interventions that curtail mortality and raise yield per colony. Open-source entrance cameras powered by Raspberry Pi hardware and AprilTag markers track foraging trips, giving producers data to optimize apiary placement during nectar flows. Machine-learning algorithms now distinguish bee castes and parasites, supporting early treatment schedules that align with veterinary guidelines. These technologies compress labor inputs and bolster export compliance by delivering digital audit trails that satisfy U.S. and EU traceability rules. Over time, precision apiculture lowers the cost curve and expands the addressable base of smallholders, energizing the natural honey market.
Strengthening Traceability Rules in Major Import Markets
Europe’s Delegated Regulation 2024/1438 mandates country-of-origin disclosure for every honey component, elevating authentication to a strategic imperative. Exporters are adopting blockchain platforms that issue tamper-proof certificates and link QR codes to laboratory analyses. Australia updated its EU TRACES listings in late 2024, demonstrating the extraterritorial influence of Brussels on third-country compliance. U.S. retailers such as Costco now require “True Source Certified” labeling, pushing Latin American suppliers toward third-party audits. These policies impose cost but reward compliant brands with shelf premiums that reach 15-20% above undifferentiated wildflower blends. Enhanced transparency thus elevates value per pound, lifting the natural honey market’s revenue growth.
Expansion of Functional and Medical-Grade Honey Applications
Clinical adoption of sterilized honey dressings is accelerating, spurred by FDA-cleared products such as Medihoney and CE-marked solutions like Revamil. Peer-reviewed trials list Manuka honey as effective against ESKAPE pathogens and chronic wound biofilms, giving hospitals an antimicrobial option that bypasses antibiotic resistance. Innovation has progressed toward honey-loaded hydrogels, nanoemulsions, and sprayable films for diabetic ulcers. The global chronic wound care sector is set to hit USD 19.5 billion by 2029, representing a gateway for pharmaceutical-grade honey manufacturers. Premium margins that exceed 300% of food-grade prices enhance the profitability of vertically integrated firms and stimulate research and development spending across the natural honey industry.
Restraints Impact Analysis*
| Restraint | (~) % Impact on CAGR Forecast | Geographic Relevance | Impact Timeline |
|---|---|---|---|
| Colony losses from Varroa, climate change, and pesticide exposure | -1.1% | North America and Europe | Short term (≤2 years) |
| Persistent global honey adulteration is depressing farm-gate prices | -0.7% | Asia-Pacific and developing markets | Medium term (2-4 years) |
| Rising compliance costs under the EU 2024/1438 origin-label regulation | -0.4% | Europe and exporting regions | Medium term (2-4 years) |
| Export-price volatility tied to El Niño-driven nectar flow shifts | -0.3% | South America and Africa | Short term (≤2 years) |
| Source: Mordor Intelligence | |||
Colony Losses from Varroa, Climate Change, and Pesticide Exposure
Annual colony mortality exceeding 55% jeopardizes global supply, with Varroa destructor outbreaks intensifying under warmer winters and longer flowering seasons. A 50-year Penn State study links honey yields to rising herbicide applications and weather anomalies, highlighting systemic exposure risks. California’s almond belt may lose up to 73% of its suitable area by 2100, compressing pollination windows and stressing migratory colonies. Producers face higher miticide costs and must rotate active ingredients to avoid resistance while investing in shade structures and supplemental feeding during droughts. Short-term supply squeezes elevate raw-honey prices, yet chronic losses erode beekeeper profitability and temper the natural honey market’s growth potential.
Persistent Global Honey Adulteration Depressing Farm-Gate Prices
Sugar-syrup dilution and transshipping continue to distort pricing. In 2024, the U.S. Department of Commerce levied final antidumping duties up to 154.47% on Vietnamese honey, lifting landed costs by USD 0.45 per pound[4]Source: Federal Register, “Raw Honey From the Socialist Republic of Vietnam: Final Results of Antidumping Review,” federalregister.gov. Such enforcement offers temporary relief for domestic producers but exposes retailers to cost inflation. Spectroscopy and DNA barcoding can detect adulterants at parts-per-thousand levels, yet equipment and skills remain out of reach for many small exporters. Until global enforcement harmonizes, the shadow supply constrains legitimate price discovery and weighs on the natural honey market.
*Our forecasts treat driver/restraint impacts as directional, not additive. The impact forecasts reflect baseline growth, mix effects, and variable interactions.
Geography Analysis
Asia-Pacific dominates the natural honey market with 45.30% consumption share in 2025. Anchored by China’s manufacturing scale and India’s rapid production expansion. Regional governments extend tax holidays and low-interest loans to modernize extraction lines, while technology start-ups deploy hive sensors that alert keepers to floral conditions. Climate variability still triggers yield swings, but adaptive forage planting and migratory beekeeping mitigate extremes. Japan and South Korea showcase flavor innovation that elevates retail prices, offsetting rising compliance costs tied to residue testing.
Europe holds a prominent consumption share and advances at a stable CAGR to 2031. The EU origin-labeling rule changed the competitive calculus, favoring exporters that deliver digital passports and punishing opaque supply chains. Germany’s role as an import gateway amplifies regulatory spillovers as downstream packers cascade compliance conditions to South American and African suppliers. Premiumization trends persist; organic and monofloral jars command shelf premiums above 45% versus blended imports, buffering demand against macroeconomic headwinds. Ongoing Ukrainian recovery and diversified Balkan sourcing strengthen intra-regional resilience.
North America accounts for prominent consumption and grows at a stable CAGR to 2031. U.S. antidumping duties elevate import prices but incentivize domestic producers to invest in queen-breeding programs and survival genetics that counter Varroa impact. Precision apiculture adoption is most advanced here, with commercial operators integrating sensor arrays that feed API-based dashboards guiding truck fleet movements for almond and blueberry pollination. Canadian policymakers fund biosecurity protocols to shield native bee populations, while Mexican cooperatives pursue USDA organic certification to access premium foodservice channels. The region’s appetite for functional honeys and medical-grade products keeps margins above global averages, reinforcing North America’s strategic weight in the natural honey market. Africa, though a smaller base, is the fastest-growing geography at a 6.39% CAGR through 2031 as urban consumers replace sugar spreads with local honey. Development grants for queen-rearing, cold-chain equipment, and export laboratories in Ethiopia, Tanzania, and Kenya are unlocking new supply streams for Middle Eastern and EU buyers.


Regulatory Landscape
Regulation is tightening around authenticity, origin disclosure, and import eligibility in key consuming regions, shaping how exporters document and move product. In the European Union, Directive (EU) 2024/1438 entered into force on 13 June 2024 and requires honey blends to list countries of origin in descending order by weight; products placed on the EU market before 14 June 2026 under the prior rules can continue to be marketed until stocks are exhausted. Alongside this, Regulation (EU) 2023/2652 requires establishments importing honey and other apiculture products into the EU to be registered in TRACES (in effect since 29 November 2024), making approved establishment listings and auditable paperwork a practical market-access gate.
Outside the EU, compliance frameworks continue to shape labeling and trade readiness across packaged and bulk channels. The U.S. FDA has highlighted EU import requirements for honey and apiculture products, including TRACES-related eligibility, and U.S. enforcement actions such as the 2024 final antidumping duties on Vietnamese honey underscore ongoing scrutiny of trade practices and supply integrity. In the Middle East, Saudi Arabia regulates honey production and marketing under Honey Bee Farming Regulations issued by Royal Decree No. (M/15) of 13/3/1431 AH, with the Saudi Food and Drug Authority (SFDA) overseeing marketed honey requirements, which reinforces the need for residue control, labeling discipline, and documentation for cross-border sales.
Value Chain Analysis
The natural honey value chain typically runs from input suppliers (hives, bee packages/queens, feed supplements, veterinary treatments, equipment) to beekeepers (often smallholders and commercial migratory operators), then to collectors and cooperatives that aggregate volumes. Processing and packing companies handle extraction, filtration, blending, moisture control, residue testing, and packaging before product moves through wholesalers, modern retail, e-commerce, and foodservice, with industrial buyers (foods, beverages, bakery, sports nutrition) sourcing bulk lots. Supporting actors include agricultural extension offices, research centers, financial institutions, trade promotion bodies, and NGOs that provide training, credit facilitation, and market linkage.
Value capture increasingly concentrates around verification and logistics, with batch-level traceability, lab testing, and digital documentation becoming core value-adding steps for regulated import access. Bottlenecks include colony health shocks (Varroa and climate-driven nectar variability), limited access to modern extraction and testing equipment, fragmented aggregation, constrained working capital, gaps in standardized laboratories and legal frameworks in some origins, and customs or port delays that can degrade delivery performance. New infrastructure initiatives that add testing and packaging capability, such as the DMCC Honey Centre workstream tied to a dedicated honey testing laboratory and optimized packaging operations, show how hubs can pull more downstream margin into authenticated export channels.
Market Opportunities and Future Outlook
Premium and regulated import channels create clear opportunities for suppliers that can operationalize origin disclosure and verifiable purity at scale. The EU shift under Directive (EU) 2024/1438 and the TRACES establishment-registration requirement are pushing exporters and packers to invest in batch-level traceability, testing capacity, and documentation workflows, which tends to favor audited supply chains over opaque blended flows. This compliance-led premiumization fits with industrial reformulation trends reflected in the report context, where food and beverage manufacturers are replacing refined sugar with authenticated honey and tightening flavor-profile specifications for consistent national rollouts.
Technology-led supply resilience is also a practical focus, given report context on annual colony mortality exceeding 55% and measurable production pressure such as U.S. honey production of 116 million pounds in 2025, down 14% from 2024. Precision apiculture platforms, including low-cost hive sensors and integrated monitoring systems (temperature, humidity, weight, activity), support earlier interventions and yield stabilization, while also generating digital audit trails that can support traceability requirements. Investment and hub build-outs that add testing, packaging, and quality assurance capacity, alongside vertical integration by larger operators and partnerships that expand offtake infrastructure for smallholders, provide near-term routes to improve supply reliability and value realization across both retail and industrial segments.
Recent Industry Developments
- July 2026: DMCC signed a strategic MoU with Naturalim France Miel to develop the DMCC Honey Centre, including plans for a dedicated honey testing laboratory and optimized packaging operations. The agreement supports third-party verification capacity and export-readiness infrastructure, helping strengthen higher-value, traceability-driven honey trade through a centralized hub.
- December 2025: Sweet Harvest Foods announced that its Apiary Nate's Hives became the largest U.S. beekeeper, operating more than 120,000 honey bee colonies following the acquisition of five local beekeeping operations. The consolidation tightens control over upstream supply and can improve consistency for branded and industrial customers amid volatility from colony losses.
- October 2024: China and Tanzania signed a protocol permitting Tanzanian honey exports, setting requirements around Varroa control programs and batch-level traceability. The agreement broadens South-South trade corridors while formalizing biosecurity and documentation practices aligned with stricter global import expectations.


Research Methodology Framework and Report Scope
Market Definition and Coverage
For this study, the natural honey market is defined as the sales value of honey that is positioned and traded as a natural sweetener for household and commercial use, across major consuming regions, and counted at the point of sale into the market.
Scope exclusions: We exclude other bee products (such as beeswax, propolis, royal jelly, and pollen) and we also exclude synthetic sweeteners and sugar substitutes that are not honey.
Segmentation Overview
- By Geography (Production Analysis (Volume), Consumption Analysis (Volume and Value), Import Analysis (Volume and Value), Export Analysis (Volume and Value), and Price Trend Analysis)
- North America
- United States
- Canada
- Mexico
- South America
- Brazil
- Argentina
- Europe
- Germany
- Ukraine
- Poland
- Russia
- Asia-Pacific
- China
- India
- Japan
- New Zealand
- Middle East
- Turkey
- Iran
- Saudi Arabia
- Africa
- Ethiopia
- Nigeria
- North America
Data Sources, Market Sizing, and Validation
Desk Research
Desk work starts by mapping the supply chain and the traded footprint of honey, since a lot of visibility comes from production and cross border flows. We refer to public sources such as FAOSTAT for production series, UN Comtrade for import and export values and volumes, and national agriculture agencies for country level updates on beekeeping output and seasonality.
To make the market model practical, we layer in price and demand signals using sources such as USDA (including market and trade commentary), Eurostat for EU trade and consumption related series, and technical references from peer reviewed food science journals on quality, adulteration checks, and moisture and purity markers that influence pricing. We also review company filings, investor presentations, and credible press coverage for capacity additions, sourcing shifts, and retail channel moves, and we selectively use paid subscriptions for company financials, patent databases, and shipment level import export datasets when a public series is incomplete. These examples are not exhaustive, and many other public and proprietary references were also used for data collection, cross checks, and clarification.
Primary Interviews and Surveys
Primary work is used to pressure test the desk assumptions and convert volume and price signals into a clean market value view, especially where informal trade or blended sourcing can hide true consumption. We speak with producers, packers and brand teams, distributors, retail and foodservice buyers, and quality and regulatory specialists across APAC, EMEA, and the Americas so the same variables are validated from both supply and demand angles.
Distribution of primary research fieldwork respondents
| Company type | Respondent position | Region |
|---|---|---|
| Top tier: 28% | CXOs: 21% | APAC: 48% |
| Mid tier: 51% | Functional/Unit leaders: 34% | EMEA: 32% |
| Smaller Players: 21% | Managers: 45% | Americas: 20% |
Market-Sizing & Forecasting
Sizing starts with a top-down build where production, net trade, and apparent consumption signals are used to reconstruct the demand pool by region, and then value is derived using blended price paths. Once that structure is in place, we corroborate totals with selective bottom-up approximations, like sampled supplier roll ups, channel checks in key importing countries, and ASP times volume tests for a few high share markets.
Inputs are kept grounded so they can be tracked over time, including honey production volumes, import and export volumes by major origins, retail and foodservice demand shifts, observed price spreads between raw and processed honey, and the incidence of quality and origin labeling that can move realized prices. When a country has weak public time series, gaps are handled by using trade mirror statistics, regional proxy ratios, and expert validated pricing bands, and then the results are adjusted to stay consistent with the larger regional balance.
Forecasting uses scenario analysis supported by regression style checks where consumption growth, income and health preference indicators, and price movements are treated as the key drivers. Assumptions are only carried forward after they are confirmed by primary inputs, and a short list of sensitivity cases is maintained for weather related supply volatility and changes in origin compliance requirements.
Data Validation & Update Cycle
Validation is done in layers, where our outputs are compared against independent signals such as trade unit values, production season outcomes, and shifts in major importer buying patterns. Outliers are flagged, traced back to the underlying variable, and corrected through a second pass before sign off, which is then followed by an internal peer review.
The model is refreshed at least annually so base year values, price assumptions, and trade balances remain current, and interim updates are triggered when material events occur, such as abnormal harvest conditions, major policy changes tied to labeling and quality, or sharp currency moves in key trading corridors. Before delivery, a final freshness check is completed so clients receive the most recent view that can still be replicated from stated inputs.
Mordor Intelligence's Natural Honey Market Sizing Compared With Other Published Estimates
Published market numbers for natural honey can look far apart even when they talk about the same theme, because scope choices and pricing logic are not always aligned. Differences often come from whether the estimate tracks only natural honey sales or a broader honey universe, and whether values are built from trade and consumption signals or inferred from a faster growth narrative.
The main gap comes from mixing natural honey with adjacent bee and specialty honey categories and then applying a higher price curve. In this build, Mordor Intelligence counts natural honey value using region level consumption signals with trade and production checks before prices are extended forward. Base year selection also matters, since older price baselines and currency timing can push a number up or down, and not every publisher revisits assumptions when harvest conditions and adulteration enforcement change.
Benchmark comparison
| Source | Market Size | Gaps in Research Methodology |
|---|---|---|
| Mordor Intelligence | USD 11.99 B (2026) | |
| Global Consultancy A | USD 10.51 B (2026) | Uses a broader honey framing and a different base value path, and the conversion from volume to value is less tied to trade unit value checks by origin, which can pull the 2026 level lower. |
| Industry Publisher B | USD 10.00 B (2025) | Anchors the series on a prior year and applies a generalized growth step into the forecast window, which can miss price spread changes between raw, processed, and labeled origin honey across regions. |
Across the three figures, most of the spread is explained by what is included in the honey universe, the base year used, and how price progression is treated when quality and origin signals shift. By keeping the value build linked to observable production and trade balances, and then checking pricing against buyer feedback, the estimate stays easier to follow and to update when conditions change quickly in major sourcing regions.


Key Questions Answered in the Report
How large is the natural honey market in 2026?
The natural honey market size is USD 11.99 billion in 2026 and is projected to reach USD 14.76 billion by 2031.
What is the expected growth rate of global honey demand?
Consumption is forecast to grow at a 4.24% CAGR between 2026 and 2031, driven by clean-label trends and medical-grade applications.
Which country leads global honey production?
China remains the top producer with 20.4% share of 2024 global output.
Why are IoT sensors important for beekeeping?
Hive-monitoring sensors detect temperature and activity anomalies early, helping reduce annual colony losses that exceed 55%.
Page last updated on:


 Your data is secure and never sold or shared.


