Nutmeg Market Size and Share
Nutmeg Market Analysis by Mordor Intelligence
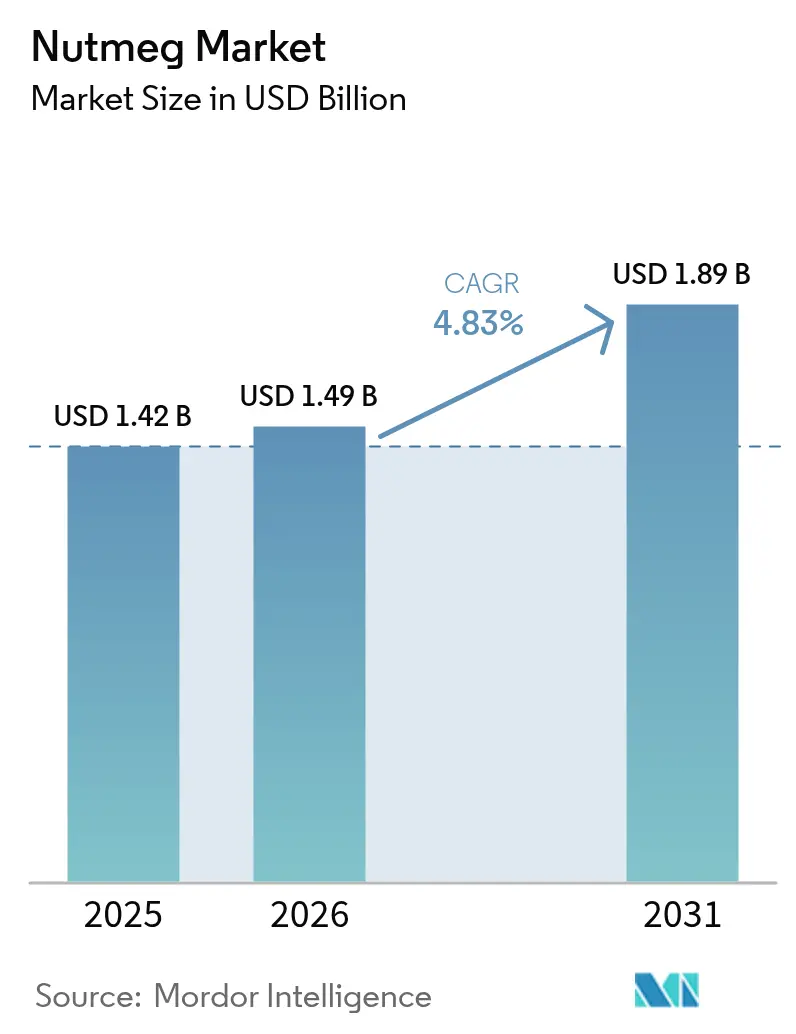
Nutmeg Market size in 2026 is estimated at USD 1.49 billion, growing from 2025 value of USD 1.42 billion with 2031 projections showing USD 1.89 billion, growing at 4.83% CAGR over 2026-2031. The market’s forward momentum is tempered by sharp supply-side swings linked to extreme weather in Indonesia and Grenada, two regions that collectively underpin most export volumes. Buyers confront geographic concentration risk because Indonesia alone shipped USD 129 million of the USD 238 million global trade value in the latest complete trade year. Demand strength rests on clean-label adoption in food manufacturing, premiumization in personal care, and early-stage pharmaceutical research into myristicin-rich extracts. Meanwhile, processing innovation is nudging value from whole seed toward high-margin essential oils and oleoresins. Consolidation moves by McCormick, Marubeni, and other multinationals signal a race to secure flavor technology and traceable supply.
Key Report Takeaways
- By geography, Asia-Pacific led with 61.20% of the nutmeg market share in 2025, whereas the Middle East is the fastest-growing region at 7.08% CAGR through 2031.
Note: Market size and forecast figures in this report are generated using Mordor Intelligence’s proprietary estimation framework, updated with the latest available data and insights as of 2026.
Global Nutmeg Market Trends and Insights
Drivers Impact Analysis*
| Driver | (~) % Impact on CAGR Forecast | Geographic Relevance | Impact Timeline |
|---|---|---|---|
| Rising demand for natural clean-label ingredients in food and beverages | +1.2% | North America and EU premium markets | Medium term (2–4 years) |
| Expansion of processed ethnic and gourmet foods | +0.8% | Core Asia-Pacific with spill-over to North American urban centers | Long term (≥4 years) |
| Rising popularity of exotic flavors in bakery and RTD beverages | +0.6% | North America and EU; emerging Asia-Pacific cities | Short term (≤2 years) |
| Premium personal care and cosmetics demand for natural aromatics | +0.5% | Global premium skincare and fragrance hubs | Medium term (2–4 years) |
| Sustainable sourcing mandates from multinational spice buyers | +0.4% | Indonesia and Grenada supply chains | Medium term (2–4 years) |
| Pharmaceutical Research and Development on myristicin-rich botanicals | +0.3% | Research hubs in North America, EU, and Japan | Long term (≥4 years) |
| Source: Mordor Intelligence | |||
Rising demand for natural clean-label ingredients in food and beverages
Food manufacturers are replacing synthetic preservatives with botanical alternatives that deliver both flavor and microbial protection. Studies show that nutmeg oil at 0.05% concentration maintains sensory quality while lowering lipid oxidation in chicken patties, allowing formulators to meet label-friendly mandates without added cost layers. The spice also inhibits E. coli and L. monocytogenes across varied pH and temperature conditions, supporting broader adoption in processed meats and ready meals. Premium brands use nutmeg’s dual function—flavor plus shelf-life extension—to justify higher product pricing. The shift is most pronounced in North American and European premium chilled foods, where transparent ingredient lists shape repeat purchase behavior. Formulators increasingly treat the compound as a single-line solution rather than stacking multiple synthetics, simplifying procurement and formulation matrices.
Expansion of processed ethnic and gourmet foods
Globalized palates have pushed nutmeg into mainstream packaged meals far beyond Western desserts. Large Asian conglomerates now market ready-to-eat rendang and biryani that rely on nutmeg for signature warmth.[1]PT Mitra Ayu, “Spice Blend Product Specifications,” mitraayu.co.id At the same time, diaspora brands in the United States and Canada have normalized Southeast Asian spice blends on grocery shelves, expanding baseline volumes. Nutmeg’s compatibility with high-pressure processing and retort sterilization supports mass-market scale without flavor loss. Beverage innovators have integrated the spice into premium chai and golden milk formulations, taking advantage of its perceived wellness halo and aromatic depth. Continuous demand from ethnic processors, therefore, reinforces predictable order books for exporters.
Rising popularity of exotic flavors in bakery and RTD beverages
Search analytics show an uptick in consumer discourse about “nutty-creamy” seasonal flavors, especially around autumn coffee specials. Nutmeg aligns with this trend by delivering complexity that pairs with pumpkin, chocolate, or dairy. Industrial bakeries value the spice’s thermal stability, allowing flavor consistency across high-temperature lines. Beverage SMEs use essential oil fractions to craft proprietary profiles that stand out in crowded RTD aisles. Predictable demand spikes during festive periods let procurement teams plan forward contracts and hedge against raw material swings. Higher margin positioning also provides leeway to absorb transportation cost inflation without eroding profitability.
Pharmaceutical research and development on myristicin-rich botanicals
Early-stage trials demonstrate myristicin’s neuroprotective and anti-inflammatory effects, encouraging pharma-botanical collaborations in the United States, Germany, and Japan. Extract suppliers able to deliver consistent chemical profiles secure contracts priced well above culinary grades. The sector remains nascent because clinical pathways extend beyond 10 years, but even pilot-scale demand lifts average farm-gate prices for high-purity material. Academic partnerships accelerate compound characterization, feeding a pipeline of nutraceutical prototypes that enlarge addressable demand over the long term.
Restraints Impact Analysis*
| Restraint | (~) % Impact on CAGR Forecast | Geographic Relevance | Impact Timeline |
|---|---|---|---|
| Production and price volatility due to climate-sensitive yields | -1.8% | Indonesia, Grenada, wider tropical belt | Short term (≤ 2 years) |
| Stringent aflatoxin and pesticide residue limits | -1.1% | EU and North America import markets | Medium term (2–4 years) |
| Fragmented farmer base limits traceability and certification | -0.9% | Indonesia, India, other smallholder regions | Long term (≥ 4 years) |
| Adverse consumer perceptions around allergenic reactions | -0.7% | Developed markets with high food-safety awareness | Medium term (2–4 years) |
| Source: Mordor Intelligence | |||
Production and price volatility due to climate-sensitive yields
Hurricane Ivan destroyed 70% of Grenada’s nutmeg trees in a single season, proving how one event can erase decades of output.[2]Deutsche Gesellschaft für Internationale Zusammenarbeit (GIZ), “Climate Resilience in Grenada’s Spice Sector,” giz.de Similar shocks affect Indonesian islands, where 99.81% of farms are smallholdings lacking irrigation or wind-break infrastructure. Uneven rainfall and rising night-time temperatures stress trees and cut yields, triggering price spikes that ripple through contract manufacturing schedules. Replacement cycles are painfully slow because saplings need 7–10 years to mature. Manufacturers, therefore, diversify suppliers or hold higher inventory, tying up working capital.
Stringent aflatoxin and pesticide residue limits
European Union regulations cap aflatoxin B1 levels at 5 micrograms per kilogram for dried spices, forcing exporters to invest in post-harvest drying tunnels and steam sterilization lines. Studies show 80% incidence rates of aflatoxin contamination in untreated samples from humid Indonesian warehouses. Import rejections lead to reputational damage and sunk logistics costs. Compliance is easier for large processors with in-house labs, but cost-sharing often squeezes farm-gate prices, discouraging the very improvements that regulators seek.
*Our forecasts treat driver/restraint impacts as directional, not additive. The impact forecasts reflect baseline growth, mix effects, and variable interactions.
Geography Analysis
Asia-Pacific commanded 61.20% of the nutmeg market share in 2025, anchored by Indonesia’s 76% contribution to global output and a USD 129 million export tally. North Maluku’s coastal micro-climate and well-drained volcanic soils support year-round flowering, yet the average farm yield is only 479 kg/ha compared with Malaysia and Sri Lanka’s higher-productivity orchards, presenting a clear agronomic upside. Chronic underinvestment in drying infrastructure exposes the chain to aflatoxin risk, prompting buyers to co-finance solar tunnel projects. Regional governments now trial clonal planting material that bears fruit in five years instead of the customary seven, widening long-run supply potential.
The Middle East is projected to grow at 7.08% CAGR through 2031 as Saudi Arabia and the UAE consolidate re-export hubs supplying North Africa. Food service operators in these markets pivot toward premium spice blends for convenience-driven consumer segments, reinforcing annual contract demand. Although volumes trail Asia-Pacific, higher per-kilogram margins attract processors keen to offset freight inflation. Climatic resilience concerns drive importers to diversify sourcing beyond Indonesia, creating openings for India’s Kerala, Sri Lanka’s Central Province, and Papua New Guinea.
Europe and North America constitute mature destinations where unit growth is low, but value per kilogram is elevated due to stringent quality and sustainability requirements. Import regulations cap aflatoxin and pesticide residues, rewarding suppliers with on-site labs and HACCP certification. Grenada, branded as the “Isle of Spice,” is still rebuilding tree stock lost to Hurricane Ivan. Recovery programs funded by development agencies target grafted stock that withstands Category 4 winds, yet commercial output will not reach pre-2004 levels before 2030. India’s emerging regions in Tamil Nadu and Karnataka add incremental diversification, while Sri Lanka enjoys an agronomic advantage with 22–34 °C temperatures and fertile mountain soils that produce high essential oil concentrations.


Recent Industry Developments
- May 2025: Vietnam exported 760 metric tons of cardamom and nutmeg worth USD 6.7 million in Q1 2025, marking a 39% rise in volume and 37% in value year-on-year.
- January 2024: Nutmeg farmers in Pollachi, Tamil Nadu, secured INR 75 lakh (USD 89.6 thousand) worth of mace orders through their Farmer Producer Company, benefiting over 50 growers.
- October 2023: For organic nutmeg from Sri Lanka and India, the Fairtrade Minimum Price is USD 1.74/kg with a premium of USD 0.24. For all other nutmeg traded under Fairtrade, the premium is 15% of the commercial price. As of October 2023, there are 24 Fairtrade-certified nutmeg producers globally, with eight in India and 16 in Sri Lanka.


Research Methodology Framework and Report Scope
Market Definitions and Key Coverage
Our study treats the nutmeg market as the cumulative value generated by whole seeds, ground powder, and food-grade nutmeg oil that move through legal trade channels for culinary, beverage, personal-care, and limited nutraceutical use. It counts only new produce of Myristica fragrans harvested, processed, and sold in the stated year, then valued at prevailing average transaction prices.
Scope exclusion: ornamental mace derivatives, synthetic flavor substitutes, and informal farm-gate barter are outside the present scope.
Segmentation Overview
- By Geography (Production Analysis (Volume), Consumption Analysis (Volume and Value), Import Analysis (Volume and Value), Export Analysis (Volume and Value), and Price Trend Analysis)
- North America
- United States
- Canada
- Guatemala
- South America
- Brazil
- Europe
- Netherlands
- United Kingdom
- Germany
- Spain
- Italy
- Asia-Pacific
- India
- Indonesia
- Vietnam
- Sri Lanka
- China
- Japan
- Middle East
- Saudi Arabia
- United Arab Emirates
- Africa
- South Africa
- Egypt
- North America
Detailed Research Methodology and Data Validation
Primary Research
Mordor analysts interviewed spice exporters in Indonesia and Grenada, European ingredient blenders, North American grocery buyers, and nutraceutical formulators across Asia-Pacific and the Middle East. These conversations clarified farm-gate yields, typical export grade spreads, buyer quality tolerances, and emerging demand pulses, helping us adjust desk findings and close data gaps.
Desk Research
We began with public data streams such as FAOSTAT crop output, ITC Trade Map shipment values, the Spices Board of India export dashboards, USDA GAIN reports, and pesticide limit alerts from the EU RASFF system. Company disclosures, selected press coverage captured through Dow Jones Factiva, and trade association briefs from the International Spice Association added context on volumes, pricing, and regulatory shifts. D&B Hoovers financial snapshots offered revenue clues for large processors. Numerous other reputable sources were referenced; the list above is illustrative, not exhaustive.
Market-Sizing & Forecasting
A top-down construct starts with harvested tonnage, export-import balances, and domestic disappearance, which are then converted to retail-equivalent value using weighted average FOB and wholesale mark-ups. Select bottom-up cross-checks, processor revenue roll-ups and sampled average selling price × volume estimates, are applied to keep totals grounded. Key model inputs include climate-linked yield patterns, average bulk price swings, spice mix penetration in packaged foods, organic share progression, and regional disposable income indices. A multivariate regression, updated annually, projects these drivers forward; scenario analysis layers account for supply shocks or regulatory changes. Where partial bottom-up data are missing, ratios from comparable producer countries or product forms fill the gap, flagged for later revision.
Data Validation & Update Cycle
Before sign-off, outputs pass three steps: algorithmic variance scans against historical ranges, peer review by a senior analyst, and re-contact of field sources if anomalies persist. Mordor refreshes every twelve months, with interim tweaks triggered by material events such as crop failure or tariff shifts, ensuring clients always receive the latest view.
Why Mordor's Nutmeg Baseline Remains the Most Dependable Market Compass
Published figures often diverge because firms pick different product mixes, price anchors, and refresh cadences. Some roll mace and other spices into nutmeg totals, while others lock in a single export price without factoring domestic use.
Key gap drivers include broader scope coverage by certain publishers, absence of cross-checks between value and volume, use of static currency years, and less frequent model updates. Mordor's disciplined segmentation, dual-path validation, and annual updates minimize such distortions.
Benchmark comparison
| Market Size | Anonymized source | Primary gap driver |
|---|---|---|
| USD 1.42 B (2025) | Mordor Intelligence | |
| USD 2.74 B (2024) | Regional Consultancy A | Adds mace and essential-oil derivatives; limited verification of domestic consumption ratios |
| USD 1.08 B (2024) | Global Consultancy B | Uses single-country yield averages and static average selling price, ignoring intra-year price volatility |
The comparison shows that when extra products inflate totals or when key variables stay untested, estimates swing widely. By anchoring values to transparent crop, trade, and price series and validating assumptions with live market voices, Mordor delivers a balanced, reproducible baseline that decision-makers can trust.


Key Questions Answered in the Report
What is the current value of the nutmeg market?
The nutmeg market is valued at USD 1.49 billion in 2026 and is projected to reach USD 1.89 billion by 2031.
Which region leads the nutmeg market?
Asia-Pacific dominates with 61.20% share in 2025, primarily due to Indonesia’s large-scale production.
What technological advances are shaping future nutmeg products?
Supercritical CO₂ extraction, encapsulation to preserve antioxidants, and blockchain-enabled traceability are driving product innovation and higher price realisation.
How are climate risks affecting nutmeg prices?
Extreme weather can wipe out mature trees, leading to multi-year supply shortfalls and price spikes because new plantings take 7–10 years to reach commercial yield.
Page last updated on:


