Silk Market Size and Share
Market Overview
| Study Period | 2021 - 2031 |
|---|---|
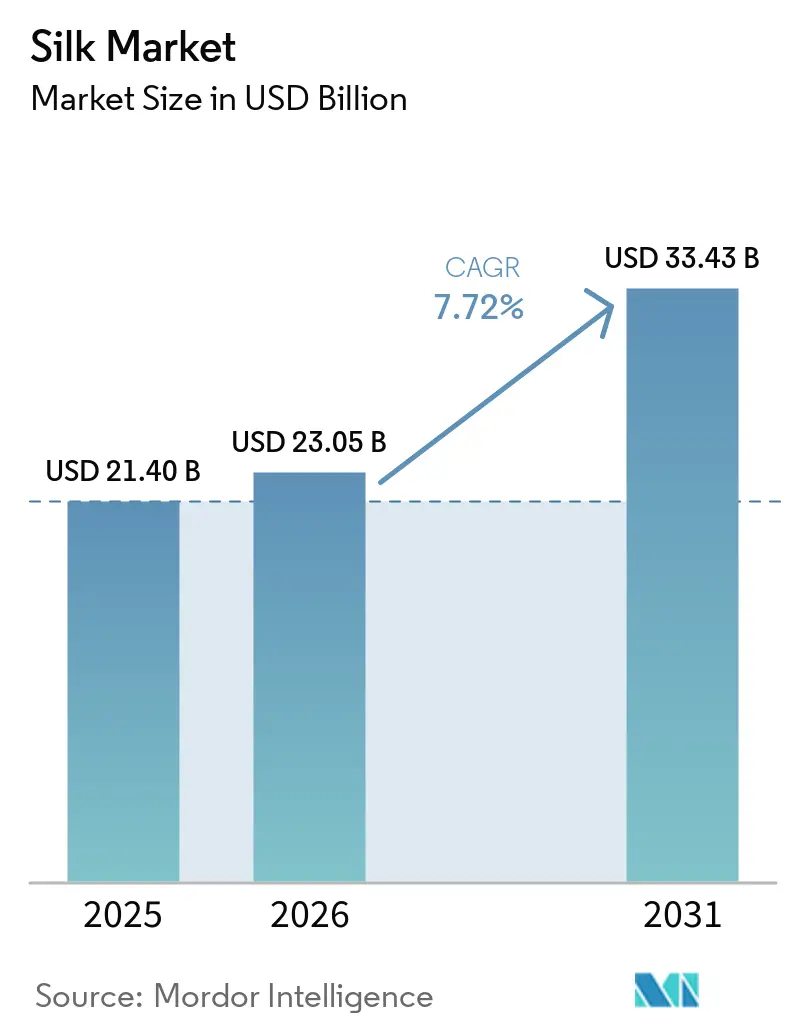
| Market Size (2026) | USD 23.05 Billion |
| Market Size (2031) | USD 33.43 Billion |
| Growth Rate (2026 - 2031) | 7.72% CAGR |
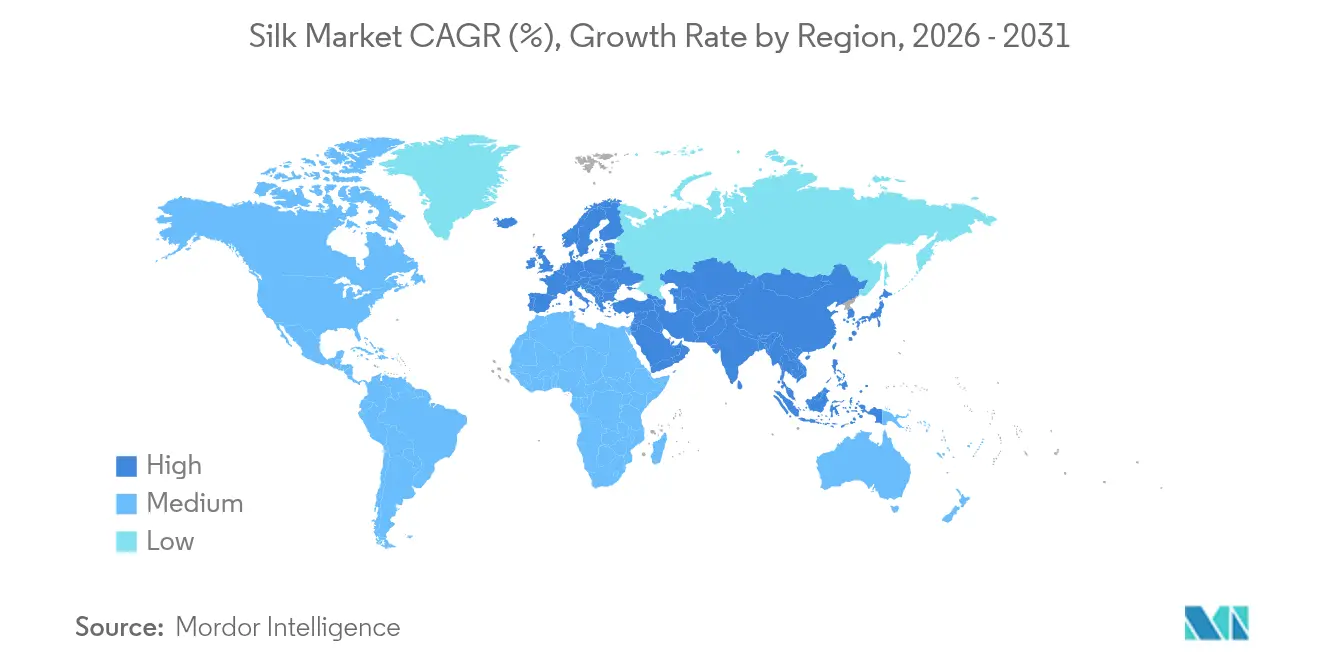
| Fastest Growing Market | Europe |
| Largest Market | Asia Pacific |
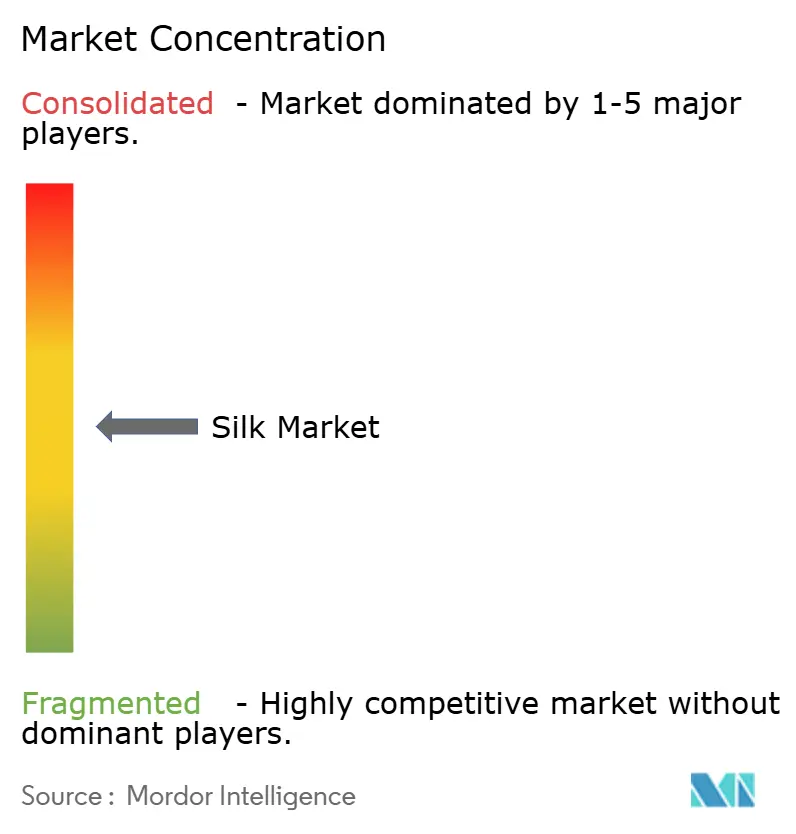
| Market Concentration | Medium |
Major Players *Disclaimer: Major Players sorted in no particular order Image © Mordor Intelligence. Reuse requires attribution under CC BY 4.0. | |
Silk Market Analysis by Mordor Intelligence
The Silk market size is expected to grow from USD 21.4 billion in 2025 to USD 23.05 billion in 2026 and is forecast to reach USD 33.43 billion by 2031 at 7.72% CAGR over 2026-2031. This expansion reflects a transition from purely luxury positioning toward diversified uses in biomedical engineering, high-performance textiles, and eco-friendly materials. Breakthroughs in bio-engineered spider silk, such as Kraig Biocraft Laboratories’ transgenic silkworm that spins fibers 10 times tougher than para-aramid, signal new performance frontiers for the silk market. Asia-Pacific retains production leadership, yet Europe posts the fastest regional growth as brands invest in traceable, low-impact sericulture processes. Spiraling demand for medical-grade fibroin, government support programs, and digital process upgrades together reinforce a robust long-term outlook for the silk market.
Key Report Takeaways
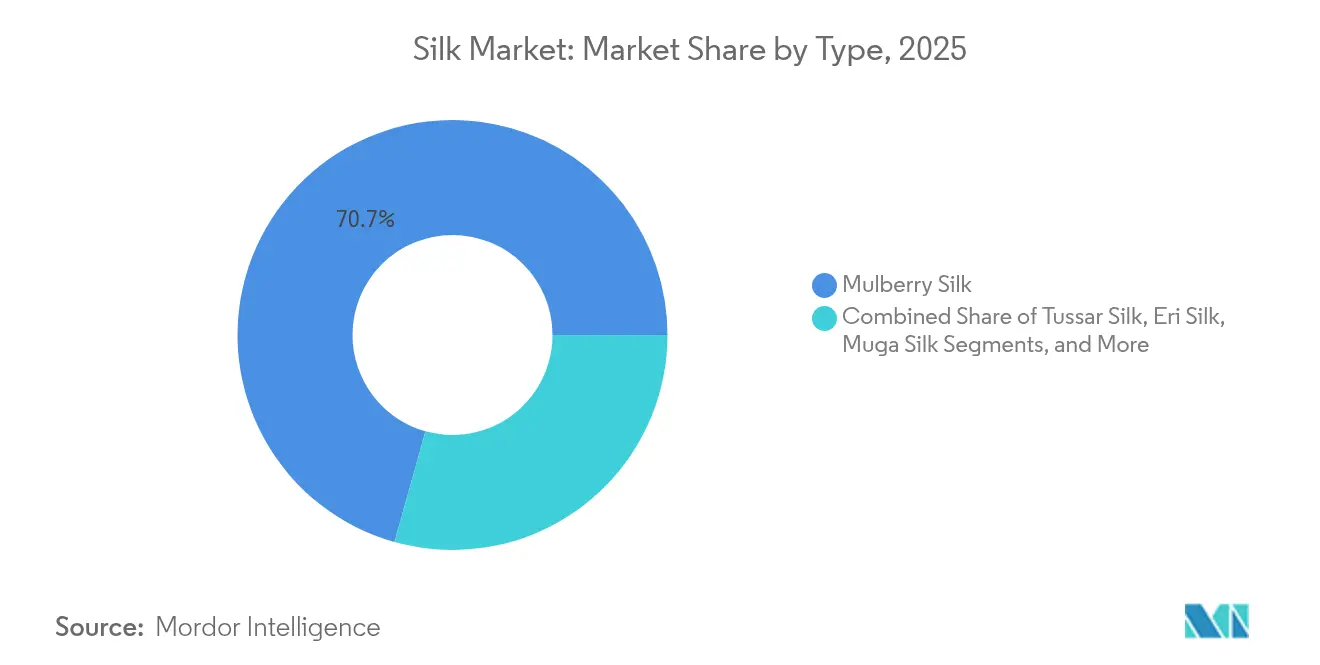
- By type, mulberry silk led with a 70.65% revenue share in 2025, while bio-engineered spider silk is projected to surge at a 18.73% CAGR to 2031.
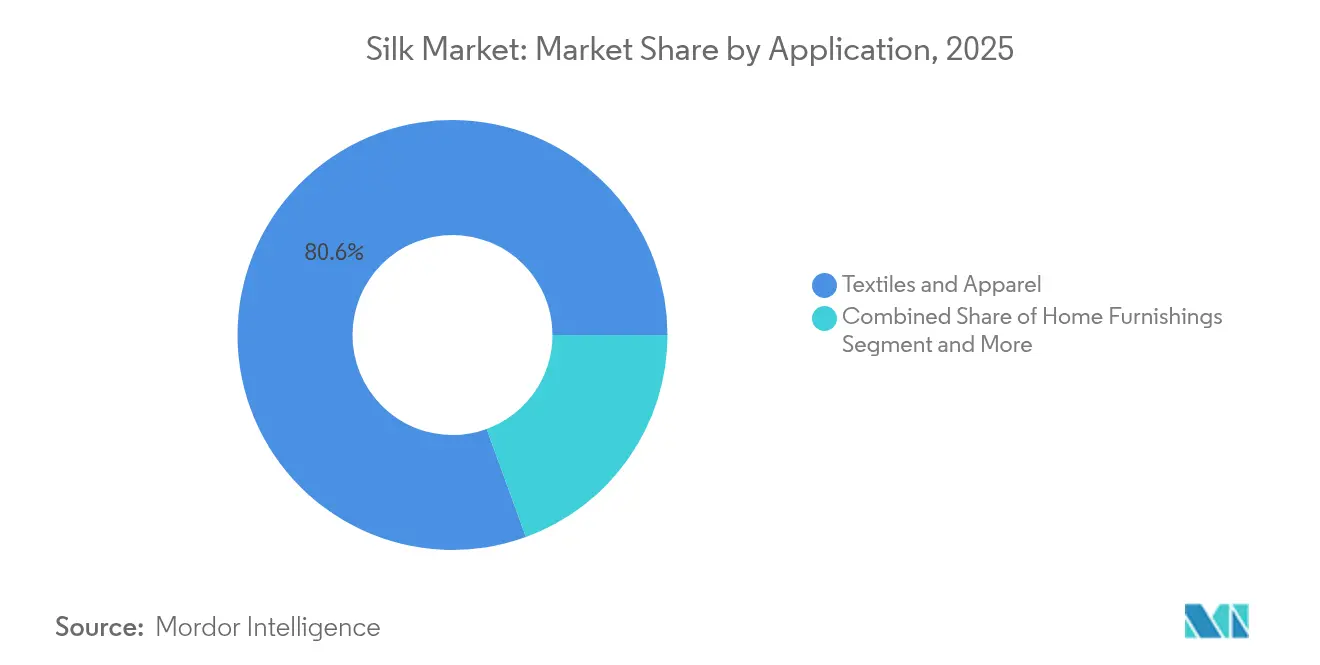
- By application, textiles and apparel accounted for 80.55% of the silk market size in 2025; biomedical and tissue engineering is expanding at a 13.58% CAGR through 2031.
- By geography, Asia-Pacific held 61.92% of the silk market share in 2025; Europe is forecast to advance at a 7.19% CAGR through 2031.
Note: Market size and forecast figures in this report are generated using Mordor Intelligence’s proprietary estimation framework, updated with the latest available data and insights as of 2026.
Global Silk Market Trends and Insights
Drivers Impact Analysis*
| Driver | (~) % Impact on CAGR Forecast | Geographic Relevance | Impact Timeline |
|---|---|---|---|
| Rising demand for luxury apparel and home textiles | +1.8% | Asia-Pacific, Europe | Medium term (2-4 years) |
| Technological advances in sericulture and reeling | +1.5% | Asia-Pacific, spill-over to Europe and North America | Long term (≥ 4 years) |
| Government subsidies and integrated development programs | +1.2% | India, China | Short term (≤ 2 years) |
| Accelerating biomedical use of silk fibroin | +2.1% | North America, Europe | Medium term (2-4 years) |
| Eco-sericulture hubs for traceable ethical silk | +0.9% | Europe, North America, expanding to Asia-Pacific | Long term (≥ 4 years) |
| Scale-up of lab-grown spider silk for performance wear | +2.3% | North America, Europe, tech transfer to Asia | Long term (≥ 4 years) |
| Source: Mordor Intelligence | |||
Rising Demand for Luxury Apparel and Home Textiles
Silk’s intrinsic luster and drape underpin steady premium demand even as global luxury spending shifts toward experiential value propositions. Chinese consumers’ rising disposable income sustains regional appetite for hand-crafted silk garments and upscale bedding. Luxury brands couple heritage narratives with sustainability messaging, satisfying Millennial and Gen Z preferences for natural fibers. Relative insulation from fast-fashion cycles enables silk producers to maintain pricing power, supporting the long-term growth arc of the silk market.
Technological Advances in Sericulture and Reeling
Selective breeding and genetic modification have led to silkworm strains with higher silk yield, disease resistance, and better fiber quality. pH-controlled nanofibril formation insights are guiding artificial silk spinning techniques that rival native fibers’ strength. Japan’s NARO commercialized fluorescent cocoons generated by genetically modified silkworms, widening creative and technical applications.[1]NARO, “Fluorescent Silk Commercialization,” naro.go.jp Artificial diets formulated with soybean meal ensure consistent cocoon quality, easing feedstock volatility. Digital twins in Chinese reeling plants lift throughput and cut wastage, illustrating how Industry 4.0 tools raise productivity across the silk market.
Government Subsidies and Integrated Development Programs
India’s Silk Samagra Scheme extended mulberry acreage to 263,352 hectares in 2024 and lifted raw silk output to 38,913 metric tons, validating coordinated input, training, and marketing support.[2]Press Information Bureau, “Silk Samagra Scheme Performance 2025,” pib.gov.in The Indian Silk Export Promotion Council negotiates tariff reliefs and logistics facilitation, positioning domestic mills for renewed export traction. China’s advanced fiber roadmap pairs manufacturing intelligence with bio-innovation, ensuring supply security and global competitiveness through the forecast horizon.
Accelerating Biomedical Use of Silk Fibroin
Silk fibroin scaffolds exhibit cell adhesion and controlled-degradation attributes ideal for sutures, nerve guides, and drug-delivery films. Recombinant spider silk proteins expand indications from musculoskeletal repair to cosmetic fillers. Valorization of sericin, a former waste stream into antioxidant cosmetic actives, reinforces circular business models. Increasing healthcare expenditure and aging demographics fortify long-run demand for medical-grade silk, further amplifying the silk market trajectory.
Restraints Impact Analysis*
| Restraint | (~) % Impact on CAGR Forecast | Geographic Relevance | Impact Timeline |
|---|---|---|---|
| High production cost and raw-silk price volatility | -1.4% | Asia-Pacific production regions | Short term (≤ 2 years) |
| Competition from synthetics and regenerated cellulose | -1.1% | Global mass-market segments | Medium term (2-4 years) |
| Climate change–linked crop disease outbreaks | -0.8% | Asia-Pacific core, spill-over globally | Long term (≥ 4 years) |
| Supply-chain concentration risk | -0.7% | Global, critical in Asia-Pacific | Medium term (2-4 years) |
| Source: Mordor Intelligence | |||
High Production Cost and Raw-Silk Price Volatility
Silk production involves more than 30 discrete steps, keeping labor costs elevated. Cocoon price swings compress mill margins and dampen the willingness to scale capacity. China’s 2023 export decline of 14% to USD 801 million reflects these supply-side pressures. A persistently tight raw silk supply can curtail the near-term growth pulse of the silk market.
Competition from Synthetics and Regenerated Cellulose
Polyester, rayon, and bio-based cellulosics deliver silk-like aesthetics at lower costs, tempting price-sensitive apparel chains. Animal welfare concerns add reputational risk for traditional sericulture, steering certain brands toward alternative materials. As synthetic manufacturers replicate silk’s hand-feel, the silk industry must accentuate biodegradability, traceability, and performance niches to maintain its share.
*Our forecasts treat driver/restraint impacts as directional, not additive. The impact forecasts reflect baseline growth, mix effects, and variable interactions.
Segment Analysis
By Type: Bio-Engineering Disrupts Traditional Silk Hierarchy
Mulberry silk retained the largest slice of the silk market size in 2025, capturing 70.65% of revenue. Bio-engineered spider silk, though nascent, is accelerating at a 18.73% CAGR through 2031, reflecting sizeable venture capital flows and pilot-scale production wins. Superior tensile strength and light weight make spider silk attractive for defense wear, aerospace composites, and premium sports gear. The University of Bayreuth’s CRISPR-enabled fluorescent silk showcases how genetic editing can tailor protein chains for specialized functions. Traditional tussar and eri varieties are carving ethical niches, while muga silk continues to fetch luxury premiums in niche couture circles. Intensifying Research and Development around recombinant proteins suggests spider silk will secure a larger silk market share as commercial output scales.
The Continued dominance of mulberry hinges on well-entrenched farming and reeling networks in China and India. Yet margin headwinds push mills to introduce blended fabrics and performance coatings. State-backed breeding programs for disease-resistant silkworms may stabilize yields and curb cost spikes. Meanwhile, synthetic biology startups target cost parity with conventional filament grades by optimizing fermentation media and downstream purification. The convergence of bio-engineering and legacy sericulture points to a diversified future silk market where engineered variants coexist with heritage fibers.


By Application: Biomedical Engineering Drives Premium Growth
Textiles and apparel commanded 80.55% of the silk market size in 2025, underpinned by luxury womenswear, neckties, and home decor. Biomedical and tissue engineering uses are expanding at a 13.58% CAGR, signaling a lucrative shift toward high-value healthcare materials. Silk fibroin’s proven cell compatibility enables resorbable sutures and cartilage scaffolds, while sericin is gaining traction in antioxidant skin-care formulas. Bolt Threads’ USD 346 million listing to finance b-silk cosmetics underscores investor confidence in functional personal-care applications.
Nutraceutical demand for insect protein in aquafeed introduces an additional revenue stream from pupae by-products. Home furnishings benefit from silk’s thermoregulation and hypoallergenic traits, appealing to wellness-minded consumers. As medical indications diversify, the silk market will increasingly depend on biopharmaceutical compliance standards, opening consulting and licensing opportunities for knowledge-rich suppliers.
Geography Analysis
Asia-Pacific accounted for 61.92% of the silk market in 2025, with China exporting USD 801 million of silk despite labor shortages and price turbulence. India produced 36,582 metric tons of raw silk in FY 2023 and expanded mulberry acreage under Silk Samagra, signaling continued public-sector backing. Vietnam recorded USD 143 million in exports, supplying Indian mills and diversifying regional supply. Mechanization brings bacterial-load challenges, prompting the adoption of nano platinum-poly hexamethylene disinfectants that outperform legacy treatments. Maritime tensions in the South China Sea highlight logistics vulnerabilities, pushing buyers to dual-source within the silk market.
Europe is the fastest-growing region, advancing at a 7.19% CAGR through 2031. Italy imported USD 161 million of Chinese greige silk for artisanal finishing, reinforcing its role in global luxury supply chains. EU workshops market traceable, low-impact silk to eco-conscious consumers willing to pay premiums. Bio-engineered spin-outs such as AMSilk are scaling recombinant fibers for performance footwear and medical devices, anchoring regional innovation clusters.
North America focuses on high-performance and biomedical niches. The United States imported USD 14.65 million of silk in 2024 for specialized downstream processing. Kraig Biocraft Laboratories operates pilot farms in Vietnam, yet plans domestic spinning for defense contracts. The Middle East and Africa remain nascent but show rising luxury consumption and cultural affinity for silk in ceremonial attire, setting the stage for future demand pickup as logistics and retail infrastructures mature.

Competitive Landscape
The competition spans legacy sericulture firms and emerging biotech entrants, yielding a moderately fragmented silk market. Shanghai Silk Group Co., Ltd. controlled 18% of global silk sales in 2024. Wujiang First Textile Co. Ltd. ranked second with a 10% share. Zhejiang Jiaxin Silk Corp. Ltd. held 7%. Ongetta Srl secured 5%, while biotech entrant AMSilk GmbH contributed 4%. Together, these five firms accounted for 44% of the silk market, reflecting moderate concentration. Chinese and Indian producers command scale advantages in mulberry cultivation, yet their combined share leaves headroom for innovators. Kraig Biocraft Laboratories filed patents for Monster Silk and Dragon Silk, targeting protective apparel and surgical sutures. AMSilk raised new funds to supply spider-silk yarns to leading sportswear brands, evidencing cross-industry pull toward lightweight, vegan fibers.
Traditional firms lean on craftsmanship branding, organic certifications, and co-creation with luxury houses to defend price premiums. Meanwhile, bio-engineered challengers promise consistent quality, tunable mechanical properties, and lower land-use footprints. Diversification into medical devices and cosmetics offers higher margins than commodity filament yarns. Strategic alliances, such as Italian mills partnering with biotech labs, are anticipated to accelerate technology transfer and broaden product portfolios.
Competitive tactics increasingly focus on vertical collaboration and intellectual property control rather than raw capacity expansion. European workshops partner with biotech labs to co-develop niche performance fabrics that carry higher profit margins. Investors favor firms that blend advanced material science with sustainability narratives, accelerating capital flow into lab-grown spider silk projects. Over the forecast period, the silk market will likely witness consolidation among mid-tier mills seeking capital to modernize, while deep-tech spinoffs may license protein designs to incumbent spinners.
Silk Industry Leaders
Wujiang First Textile Co. Ltd.
AMSilk GmbH
Shanghai Silk Group Co. Ltd.
Zhejiang Jiaxin Silk Corp. Ltd.
Ongetta Srl
- *Disclaimer: Major Players sorted in no particular order

Recent Industry Developments
- May 2025: University of Bayreuth scientists applied CRISPR-Cas9 to spiders, producing red fluorescent silk with the potential for advanced materials engineering.
- January 2025: Kraig Biocraft Laboratories unveiled transgenic silkworms carrying Darwin’s bark spider genes, targeting metric-ton production capacity in 2025.
- February 2024: With a USD 105 million (INR 900 crore) allocation for the fiscal year 2024-25, India is ramping up its backing for the silk industry. The Central Silk Board (CSB) is set to utilize these funds to refine sericulture practices, spearhead research initiatives, and boost both the quantity and quality of the nation's silk output.
- January 2024: Kraig Biocraft Laboratories, Inc. signed a Memorandum of Understanding (MOU) with the Vietnam Sericulture Association and the Lam Dong Agro-Forestry Research Experiment Center, aiming to bolster and broaden silk production in Vietnam.


Research Methodology Framework and Report Scope
Market Definitions and Key Coverage
Our study defines the silk market as the total annual value of natural protein-based filaments and staple fibers produced from mulberry, tussar, eri, muga, and bio-engineered spider silk that are sold into textiles, home furnishings, cosmetics, nutraceutical, and biomedical uses. The market value is expressed in U.S. dollars at manufacturer gate prices before further fabrication or retail mark-ups.
Scope exclusion: synthetic cellulosic and petroleum-derived fibers such as rayon or polyester are not covered.
Segmentation Overview
- By Type
- Mulberry Silk
- Tussar Silk
- Eri Silk
- Muga Silk
- Bio-engineered Spider Silk
- By Application
- Textiles and Apparel
- Home Furnishings
- Cosmetics and Personal Care
- Biomedical and Tissue Engineering
- Nutraceutical and Food Additives
- By Geography
- North America
- United States
- Canada
- Mexico
- Rest of North America
- South America
- Brazil
- Argentina
- Rest of South America
- Europe
- Germany
- United Kingdom
- France
- Italy
- Spain
- Norway
- Finland
- Rest of Europe
- Asia-Pacific
- China
- India
- Japan
- Australia
- Rest of Asia-Pacific
- Middle East
- Turkey
- Saudi Arabia
- United Arab Emirates
- Rest of Middle East
- Africa
- South Africa
- Nigeria
- Egypt
- Rest of Africa
- North America
Detailed Research Methodology and Data Validation
Primary Research
Mordor analysts conduct structured interviews with sericulture extension officers in Asia-Pacific, Italian fabric mills, U.S. cosmeceutical formulators, and global commodity traders. These discussions validate yield assumptions, average selling prices, and emerging bio-silk applications while surfacing regional policy shifts that a desk scan alone might miss.
Desk Research
We start with publicly available sericulture production data from sources such as the Food and Agriculture Organization, UN Comtrade shipment records, the International Sericulture Commission, and China's Ministry of Agriculture, which together outline cocoon output, raw silk exports, and key price points. These statistics are complemented with domestic agriculture yearbooks from India, Vietnam, and Uzbekistan, alongside tariff filings that reveal average declared values. Company 10-Ks, investor presentations, and patent filings help our analysts at Mordor Intelligence gauge downstream demand for silk blends in apparel, medical sutures, and personal-care actives. Paid databases, including D&B Hoovers for producer financials and Questel for biomaterial patents, add granularity on corporate revenue streams and technology pipelines. The secondary source list is illustrative, not exhaustive; many other materials guide data validation and clarification.
Market-Sizing & Forecasting
We first build a top-down model that converts reported cocoon tonnage into grade-specific filament output. Applying calibrated recovery factors and country-level average selling prices reconstructs the global demand pool. Supplier roll-ups, channel checks, and sampled price × volume calculations then provide a bottom-up reasonableness test, with discrepancies reconciled through analyst review. Key variables include mulberry acreage, reeling recovery rates, raw silk import premiums, luxury apparel retail indices, and biomedical grade price differentials, all projected with a multivariate ARIMA that captures seasonality and policy shocks. Gaps in producer data are bridged with three-year moving-average imputation anchored to trade receipts. Only after mapping five-year filament trends and normalizing them to current prices do we release the base value.
Data Validation & Update Cycle
Outputs are benchmarked against independent import statistics and spot-price trackers; anomalies trigger re-checks before sign-off. An internal peer review ensures consistency with adjacent fiber studies. Reports refresh each year, and material events, such as disease outbreaks in mulberry farms or bio-silk scale-ups, prompt interim revisions so clients receive the latest view.
Why Mordor's Silk Market Baseline Earns Broad Trust
Published estimates often diverge because firms choose different fiber types, price references, and refresh cadences, which can widen gaps for a niche, supply-led market like silk.
Key gap drivers include whether non-textile uses such as biomedical scaffolds are included, the choice between farm-gate and mill-gate pricing, assumptions on reeling wastage, and currency conversion timing. Mordor's disciplined scope, annual refresh, and explicit reconciliation of production with trade flows limit these distortions.
Benchmark comparison
| Market Size | Anonymized source | Primary gap driver |
|---|---|---|
| USD 21.40 B (2025) | Mordor Intelligence | - |
| USD 20.99 B (2024) | Regional Consultancy A | Excludes cosmetics and nutraceutical uses; applies constant 2020 exchange rates |
| USD 8.56 B (2024) | Trade Journal B | Counts only apparel-grade mulberry silk; uses farm-gate prices without value-addition factor |
The comparison shows that when scope is narrow or price anchors differ, values swing widely. By integrating full end-use coverage and verified pricing ladders, Mordor Intelligence delivers a balanced, transparent baseline that decision-makers can retrace and replicate with confidence.


Key Questions Answered in the Report
How large is the silk market in 2026?
The silk market stands at USD 23.05 billion in 2026 and is on track to reach USD 33.43 billion by 2031, growing at an 7.72% CAGR.
Which region leads silk production?
Asia-Pacific commands 61.92% of silk market share, driven mainly by China’s export capacity and India’s expanding raw-silk output.
What is the fastest-growing silk type?
Bio-engineered spider silk is the fastest-growing type, projected to expand at a 18.73% CAGR through 2031 due to superior mechanical properties.
Why is biomedical demand important for silk suppliers?
Biomedical and tissue-engineering uses of silk fibroin are advancing at a 13.58% CAGR, offering higher margins and diversified revenue beyond apparel.
How are governments supporting sericulture?
Programs like India’s Silk Samagra Scheme provide subsidies, training, and expanded mulberry cultivation, helping stabilize production and exports.
What competitive edge do synthetic biology firms offer?
They produce spider-silk proteins via fermentation, achieving consistent quality, custom properties, and lower land requirements, pressuring traditional mills to innovate.
Page last updated on:


