Heat Stress Monitor Market Size and Share
Market Overview
| Study Period | 2019 - 2030 |
|---|---|
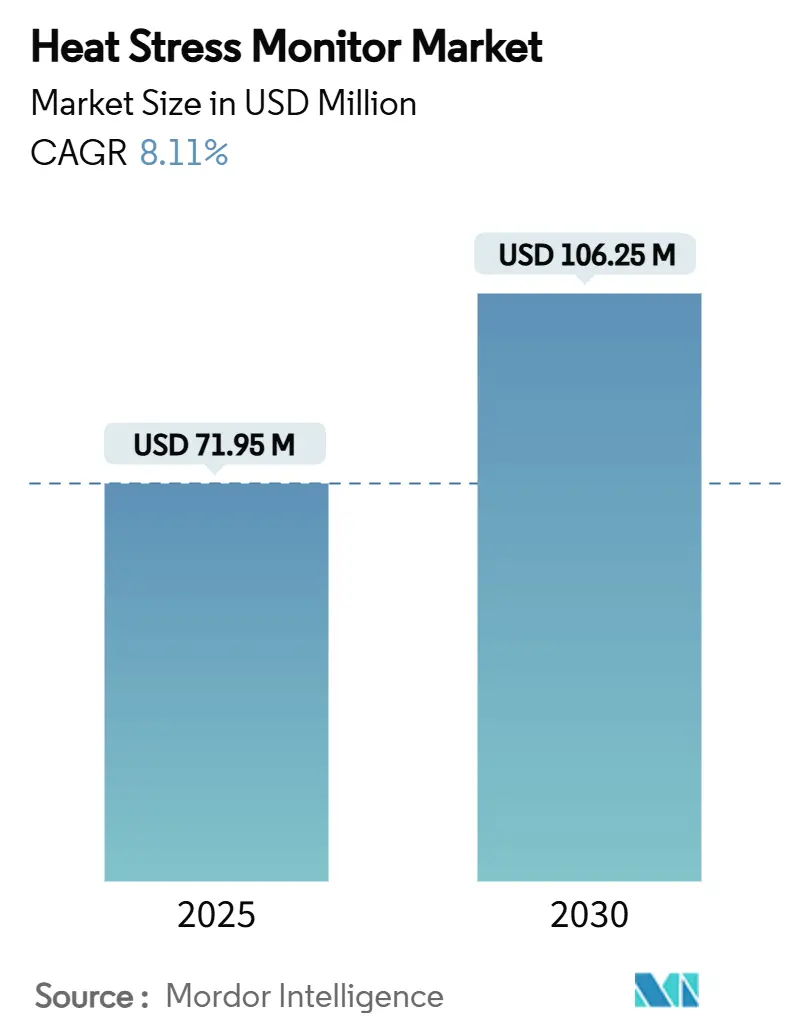
| Market Size (2025) | USD 71.95 Million |
| Market Size (2030) | USD 106.25 Million |
| Growth Rate (2025 - 2030) | 8.11% CAGR |
| Fastest Growing Market | Middle East and Africa |
| Largest Market | North America |
| Market Concentration | Medium |
Major Players
*Disclaimer: Major Players sorted in no particular order Image © Mordor Intelligence. Reuse requires attribution under CC BY 4.0. |
|
Heat Stress Monitor Market Analysis by Mordor Intelligence
The Heat Stress Monitor market size stood at USD 71.95 million in 2025 and is projected to reach USD 106.25 million by 2030, advancing at an 8.11% CAGR through the forecast period. Heightened regulatory vigilance, rising workplace heat-injury incidence, and rapid sensor innovation have repositioned heat-stress tracking from periodic testing to continuous surveillance. Employers are moving capital budgets toward integrated environmental-plus-physiological platforms that predict risk, a trend confirmed by OSHA’s July 2024 notice of proposed rulemaking that mandates monitoring once the heat index touches 80°F.[1]U.S. Department of Labor, “Heat Injury and Illness Prevention in Outdoor and Indoor Work Settings – NPRM,” OSHA, osha.govCompetitive momentum is also shaped by ESG reporting demands, military modernization programs, and insurance premium incentives, all of which embed real-time data analytics into routine safety management. Within this expanding framework, the Heat Stress Monitor market consistently rewards suppliers that can pair accurate sensing with AI-enabled forecasting, while cost barriers and privacy concerns remain the chief adoption hurdles.
Key Report Takeaways
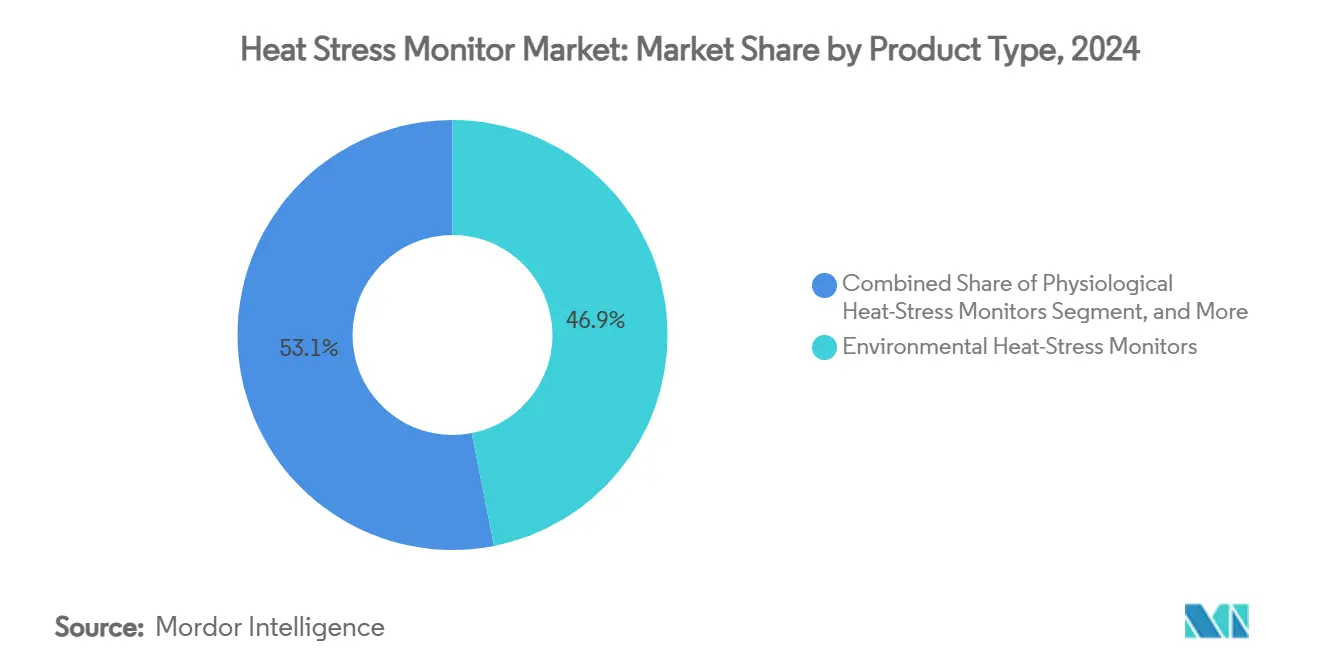
- By product type, Environmental Heat-Stress Monitors led with 46.9% revenue share in 2024; Combined Environmental + Physiological Solutions are set to grow at an 8.2% CAGR through 2030.
- By form factor, handheld devices accounted for 38.7% of the Heat Stress Monitor market share in 2024, whereas wearable patches are forecast to expand at an 8.5% CAGR to 2030.
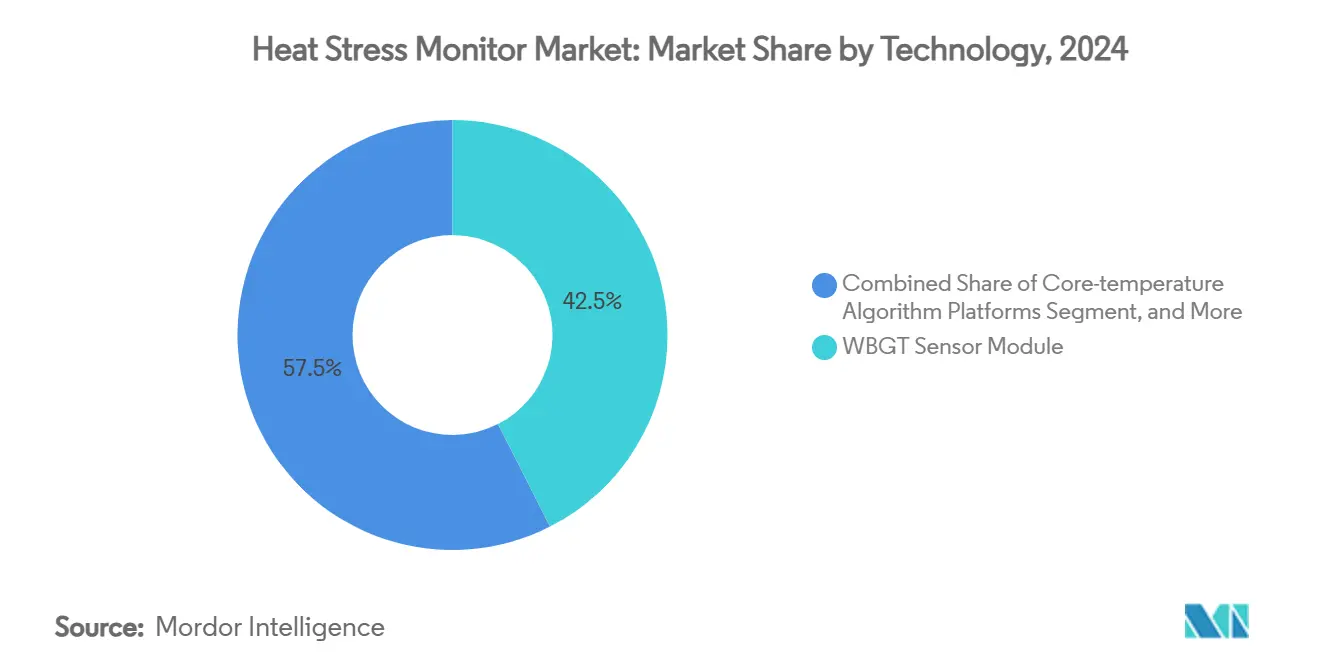
- By technology, WBGT sensor modules held 42.5% share of the Heat Stress Monitor market size in 2024, while AI/ML predictive analytics engines register the fastest CAGR at 8.8% through 2030.
- By end-user, construction captured 28.3% share in 2024 and the military segment is on track for an 8.4% CAGR through 2030.
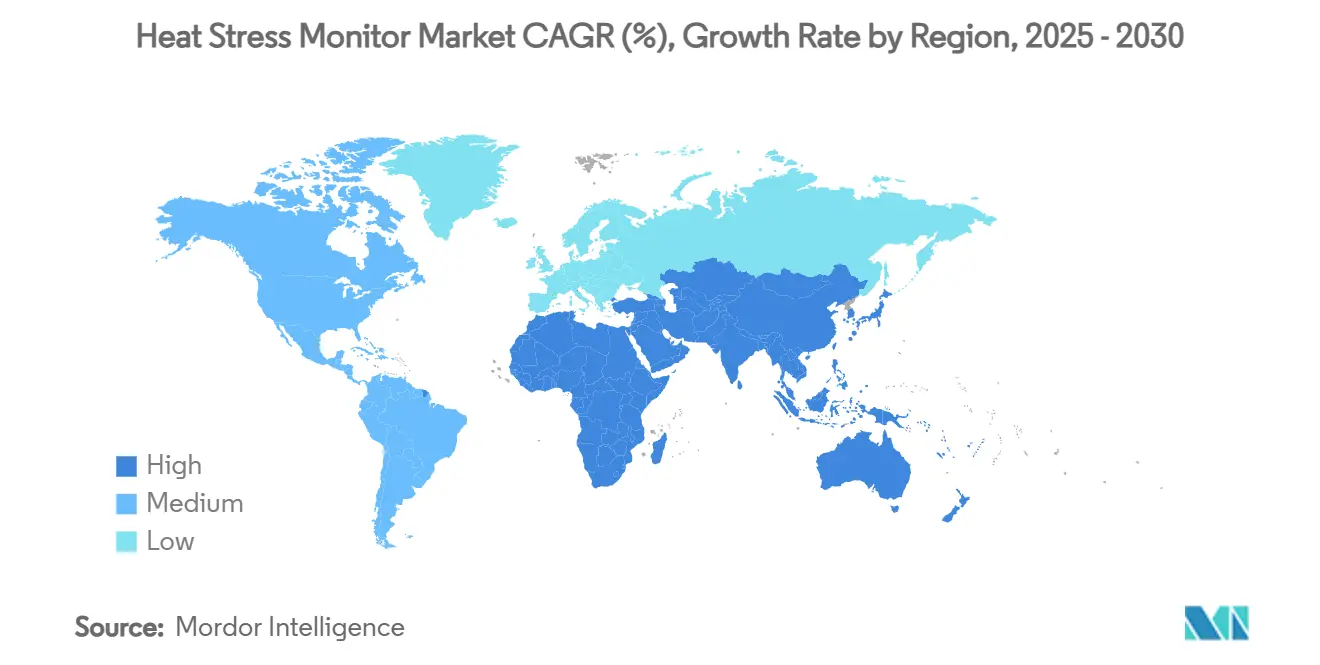
- By geography, North America commanded 34.1% market share in 2024; the Middle East and Africa region is projected to advance at an 8.9% CAGR between 2025-2030.
Global Heat Stress Monitor Market Trends and Insights
Drivers Impact Analysis*
| Driver | (~) % Impact on CAGR Forecast | Geographic Relevance | Impact Timeline |
|---|---|---|---|
| Stringent occupational heat-exposure regulations | +1.8% | Global, with early adoption in North America & EU | Medium term (2-4 years) |
| Rising heat-related workplace injuries and productivity losses | +1.2% | Global, concentrated in construction and manufacturing hubs | Short term (≤ 2 years) |
| Employer ESG and safety-culture investments | +1.5% | North America & EU core, expansion to APAC | Long term (≥ 4 years) |
| Insurance-premium incentives for deploying certified monitors | +0.9% | North America & EU, emerging in developed APAC markets | Medium term (2-4 years) |
| Military modernization programs integrating rugged wearables | +0.7% | Global defense markets, led by US, NATO allies | Long term (≥ 4 years) |
| Cross-vertical demand from livestock and smart-farm deployments | +0.6% | Global agricultural regions, concentrated in dairy-intensive areas | Medium term (2-4 years) |
| Source: Mordor Intelligence | |||
Stringent Occupational Heat-Exposure Regulations
OSHA’s proposed nationwide heat rule obliges employers to implement Heat Injury and Illness Prevention Plans when the worksite heat index reaches 80°F, escalating controls at 90°F. The rule affects about 36 million U.S. workers and has already prompted a procurement surge for continuous monitors that satisfy imminent compliance audits. Parallel policy moves in China and Thailand extend this compliance pull, so manufacturers now design sensor suites that meet both U.S. and Asian WBGT or core-temperature thresholds.[2]Teniope Adewumi-Gunn, “Workplace Heat Protections Across the Globe,” NRDC, nrdc.org Together these statutes anchor the Heat Stress Monitor market as a non-discretionary spend category.
Rising Heat-Related Workplace Injuries and Productivity Losses
Heat-related fatalities climbed to 2,300 in 2023, the highest level in 45 years, with construction workers facing a 13-fold greater illness risk than other sectors. Empirical studies also link every 1°C uptick in WBGT to a 0.33% decline in labor productivity, translating into multimillion-dollar output shortfalls for heat-exposed industries. These facts propel corporate demand for predictive, personnel-specific alerts that curtail downtime and reduce compensation claims.
Employer ESG and Safety-Culture Investments
Investors now score ESG performance on concrete health-and-safety metrics, and smart heat-stress dashboards supply the hard data boards want. European regulators add further impetus by offering insurance discounts and tax subsidies to firms that deploy advanced monitoring.[3]European Agency for Safety and Health at Work, "Effectiveness of Economic Incentives to Improve Occupational Safety and Health," osha.europa.eu As leadership teams chase verifiable ESG gains, integrated Heat Stress Monitor market platforms that log exposure hours, alarm response times, and near-miss counts become embedded into enterprise reporting suites.
Insurance-Premium Incentives for Certified Monitors
Workers-compensation insurers now embed sensor data into actuarial models and reward users with lower premiums for documented risk mitigation. The National Council on Compensation Insurance cites wearable safety tech as a major lever to reshape rating algorithms, granting companies a direct payback for system adoption. This finance-driven catalyst has increased RFP volumes for certified heat-stress systems among logistics, warehousing, and oilfield operators.
Restraints Impact Analysis*
| Restraint | (~) % Impact on CAGR Forecast | Geographic Relevance | Impact Timeline |
|---|---|---|---|
| High device and calibration costs for SMEs | -0.8% | Global, acute in developing markets | Short term (≤ 2 years) |
| Lack of harmonized performance standards for sensors | -0.5% | Global, with regional differences | Medium term (2-4 years) |
| Worker-privacy and union pushback against biometric tracking | -0.4% | North America and EU | Long term (≥ 4 years) |
| Accuracy gaps of non-invasive core-temperature algorithms | -0.3% | Global | Medium term (2-4 years) |
| Source: Mordor Intelligence | |||
High Device and Calibration Costs for SMEs
Many small companies struggle to justify USD 1,000-plus per unit outlays plus annual ISO-traceable calibrations. Research on IIoT adoption among U.S. manufacturing SMEs confirms that upfront cost hurdles eclipse long-run savings, especially when the employee base is small. Without group-buy subsidies or leasing models, this price barrier caps penetration in lower-margin workshops and farms.
Worker-Privacy and Union Pushback Against Biometric Tracking
The Equal Employment Opportunity Commission warns that collecting continuous physiological data may violate disability laws unless clearly job-related. Unions likewise argue that round-the-clock surveillance chills organizing rights, prompting collective-bargaining demands before device rollouts. [4]U.S. Government Accountability Office, “Digital Surveillance of Workers,” GAO, gao.gov Vendors must therefore embed strict data-minimization and anonymization protocols to quell resistance and unlock broader Heat Stress Monitor market uptake.
*Our forecasts treat driver/restraint impacts as directional, not additive. The impact forecasts reflect baseline growth, mix effects, and variable interactions.
Segment Analysis
By Product Type: Integrated Solutions Drive Market Evolution
Environmental monitors retained a 46.9% grip on revenue in 2024, anchored by decades-old WBGT protocols that regulators readily accept. The Heat Stress Monitor market is now shifting, however, toward Combined Environmental + Physiological Solutions that log real-time core-temperature estimates and push notifications, a category growing at an 8.2% CAGR. Enterprises select these hybrid bundles because they couple ambient readings with worker-specific strain indices, reducing false alarms and improving legal defensibility. Physiological devices alone still appeal to high-risk defense or firefighting units, yet buyer surveys reveal that many safety managers prefer single-dashboard views, which explains the momentum of bundled architectures.
Market education now emphasizes evidence that pHST indices avert 85% of potential heat-strain incidents compared with ambient-only triggers. Demonstrated risk-reduction fuels CAPEX approvals, and many multinationals roll out phased upgrades where existing WBGT gear is back-fitted with physiological-sensor docks. Over the forecast window, integrated bundles are expected to eclipse environmental-only units in new installations, even as regulations keep the legacy segment relevant for routine audits. This dual market dynamic supports both retrofit sales and greenfield deployments, providing suppliers multiple paths to capture Heat Stress Monitor market growth.


By Form Factor: Wearables Challenge Handheld Dominance
Handheld meters continued to command 38.7% of 2024 shipments because supervisors value spot-checks during site walks. Yet the mobility of labor crews and the speed at which body temperature can escalate have amplified demand for wearables that deliver uninterrupted streams. Wearable patches are forecast for an 8.5% CAGR, assisted by breakthroughs in flexible batteries and breathable substrates that eliminate previous skin-irritation issues. In distribution centers, safety leads already swap clipboards for cloud dashboards that integrate patch data with geo-fenced heat maps.
Stationary or fixed-site sensors still anchor large plants where furnace zones remain in predictable locations, but smart PPE-integrated sensors—ranging from hard-hat liners to fire-retardant shirts—are the headline innovation. Vehicle-mounted units, meanwhile, target utilities and open-pit mines, feeding driver cab displays that trigger rest breaks when WBGT climbs. User testimonials underline the comfort gains from sub-5 g sensor weight thresholds, and NBC-profiled Florida farm pilots showed that 90% of workers accepted the new devices over bulkier chest straps.
By Technology: AI/ML Transforms Predictive Capabilities
WBGT modules accounted for 42.5% of technology deployments in 2024 because auditors and insurers remain familiar with ISO 7243 readings. That said, AI/ML predictive analytics engines clock the fastest 8.8% CAGR as employers transition from reactive alarms to forward-looking risk scores. Modern dashboards ingest weather, exertion, and historical illness data to generate 12-hour probability curves, echoing Japanese models that achieved high early-warning accuracy.
Core-temperature algorithm platforms improve every quarter as physics-based models fuse with photoplethysmography and thermal-camera inputs, closing the technology gap that once limited non-invasive reliability. Infrared thermography retains niche appeal for bulk-material yards and flight lines where contact sensors are impractical, while IoT multi-sensor nodes knit everything together under a single network stack. Suppliers that pair proprietary AI with open API hooks position themselves to integrate with existing EHS or MES suites, a critical procurement criterion for large manufacturers.
By End-user Industry: Military Leads Innovation Adoption
Construction preserved a 28.3% revenue stake in 2024 owing to the disproportionate share of heat-related fatalities faced by this 6% workforce segment. Military and defense, however, post the fastest 8.4% CAGR as projects like the U.S. Army’s Heat Illness Prevention System—field-tested since 2018—expand to NATO partners. Heavy industry, mining, and oil installations follow closely, constrained mainly by intrinsic safety certifications that delay rapid rollouts.
Agriculture and forestry adoption accelerates via smart-farm pilots that track both animal and worker core temperatures, while sports science labs employ the same sensors for match-day readiness. Utilities, logistics, and emergency services fill out the demand curve, each requiring ruggedized enclosures but benefiting from shared AI back-ends. Because institutional buyers in defense and public safety typically specify multi-year, multi-site contracts, their adoption pushes volume guarantees that help vendors amortize R&D and reduce unit costs for commercial sectors.
Geography Analysis
North America’s 34.1% Heat Stress Monitor market share is underpinned by regulatory clarity and deep insurance ecosystems that monetize risk reduction. Investment flows into predictive analytics platforms that integrate seamlessly with popular EHS software, and the U.S. Department of Defense acts as a technology incubator whose field-proven wearables quickly migrate to commercial job sites. Canada’s oil sands and Mexico’s maquiladoras add further pull by mandating WBGT devices during seasonal heat waves.
The Middle East and Africa’s 8.9% CAGR stems from climate-driven urgency combined with mega-infrastructure projects. Governments in the Gulf require licensed contractors to show documented heat-risk mitigation, and mining operators in South Africa adopt ruggedized IoT nodes to audit compliance remotely. International climate-fund programs often subsidize smart cooling and monitoring solutions, enabling swift market entry for vendors able to certify intrinsically safe designs.
Europe and Asia-Pacific share common drivers—stringent labor codes and manufacturing intensity—but differ in adoption velocity. The EU’s economic-incentive model lowers total cost of ownership, while APAC’s vast workforce and heat-health studies catalyze AI-enhanced deployments. Japan, for instance, pioneers machine-learning early-warning indices that neighboring markets now trial. India and Australia, experiencing more frequent extreme heat events, have started to integrate heat-stress clauses into national safety legislation, extending the Heat Stress Monitor market’s geographic addressable base.

Competitive Landscape
Competition remains moderately fragmented as no single vendor exceeds a double-digit share, yielding a fertile arena for differentiated technology stacks. Traditional instrumentation majors such as TSI Incorporated and Honeywell leverage certified calibration labs and global distribution, yet wearable pure-plays like Kenzen or SlateSafety win bids by offering faster algorithm updates and API-ready dashboards. Mid-tier firms collaborate with software analytics houses, forging ecosystems that couple sensor hardware, risk-scoring AI, and regulatory-report templates into turnkey solutions.
Strategic moves cluster around three themes. First, OEMs file patents for non-invasive core-temperature algorithms that combine thermal imagery with heart-rate variability, aiming to displace ingestible thermistors. Second, equity investors back insurgents like Epicore, whose sweat-sensing patches secured January 2024 funding to enter Asian construction markets. Third, established metrology players acquire AI start-ups to close software gaps, mirroring Honeywell’s prior pivot toward cloud analytics across its sensing portfolio.
Customer stickiness rises with each firmware release, since algorithm efficacy improves once models are trained on site-specific exposure profiles. That data-network effect could gradually tilt market concentration toward vertically integrated vendors. Even so, the near-term Heat Stress Monitor industry structure will stay pluralist because end-users span disparate risk classes—from dairy farms to forward-operating bases—each demanding tailored sensor ruggedness, form factor, and price points.
Heat Stress Monitor Industry Leaders
-
TSI Incorporated
-
Nielsen-Kellerman (Kestrel)
-
Teledyne FLIR LLC
-
Honeywell International Inc.
-
SlateSafety Inc.
- *Disclaimer: Major Players sorted in no particular order

Recent Industry Developments
- October 2024: Pacific Northwest National Laboratory issued an assessment urging tighter integration of cardiac and heat-stress analytics for first-responder wearables.
- September 2024: Nature Digital Medicine reported 90% device-acceptance rates among Kenyan farmers wearing research-grade physiological monitors, underscoring global scalability
- August 2024: Hong Kong Polytechnic University debuted soft robotic clothing capable of autonomously adjusting thermal insulation during extreme heat.
- August 2024: NBC News highlighted Florida farm trials of lightweight biopatches that notify workers directly when body-heat indices spike.


Global Heat Stress Monitor Market Report Scope
| Environmental Heat-Stress Monitors |
| Physiological Heat-Stress Monitors |
| Combined Environmental + Physiological Solutions |
| Software / Analytics Platforms |
| Accessories and Calibration Tools |
| Handheld Devices |
| Wearable Patches / Bands |
| Stationary / Fixed-site Sensors |
| Smart PPE-integrated Sensors |
| Vehicle / Equipment-mounted Sensors |
| WBGT Sensor Modules |
| Core-temperature Algorithm Platforms |
| Infrared Thermography-based Systems |
| IoT-connected Multi-sensor Nodes |
| AI / ML Predictive Analytics Engines |
| Construction |
| Manufacturing and Heavy Industry |
| Mining and Oil and Gas |
| Military and Defense |
| Agriculture and Forestry |
| Sports and Athletics |
| Utilities and Energy |
| Logistics and Transportation |
| Emergency Services |
| North America | United States | |
| Canada | ||
| Mexico | ||
| South America | Brazil | |
| Argentina | ||
| Chile | ||
| Rest of South America | ||
| Europe | Germany | |
| United Kingdom | ||
| France | ||
| Italy | ||
| Spain | ||
| Russia | ||
| Rest of Europe | ||
| Asia-Pacific | China | |
| Japan | ||
| India | ||
| South Korea | ||
| Australia | ||
| Rest of Asia-Pacific | ||
| Middle East and Africa | Middle East | Saudi Arabia |
| United Arab Emirates | ||
| Turkey | ||
| Rest of Middle East | ||
| Africa | South Africa | |
| Nigeria | ||
| Rest of Africa | ||
| By Product Type | Environmental Heat-Stress Monitors | ||
| Physiological Heat-Stress Monitors | |||
| Combined Environmental + Physiological Solutions | |||
| Software / Analytics Platforms | |||
| Accessories and Calibration Tools | |||
| By Form Factor | Handheld Devices | ||
| Wearable Patches / Bands | |||
| Stationary / Fixed-site Sensors | |||
| Smart PPE-integrated Sensors | |||
| Vehicle / Equipment-mounted Sensors | |||
| By Technology | WBGT Sensor Modules | ||
| Core-temperature Algorithm Platforms | |||
| Infrared Thermography-based Systems | |||
| IoT-connected Multi-sensor Nodes | |||
| AI / ML Predictive Analytics Engines | |||
| By End-user Industry | Construction | ||
| Manufacturing and Heavy Industry | |||
| Mining and Oil and Gas | |||
| Military and Defense | |||
| Agriculture and Forestry | |||
| Sports and Athletics | |||
| Utilities and Energy | |||
| Logistics and Transportation | |||
| Emergency Services | |||
| By Geography | North America | United States | |
| Canada | |||
| Mexico | |||
| South America | Brazil | ||
| Argentina | |||
| Chile | |||
| Rest of South America | |||
| Europe | Germany | ||
| United Kingdom | |||
| France | |||
| Italy | |||
| Spain | |||
| Russia | |||
| Rest of Europe | |||
| Asia-Pacific | China | ||
| Japan | |||
| India | |||
| South Korea | |||
| Australia | |||
| Rest of Asia-Pacific | |||
| Middle East and Africa | Middle East | Saudi Arabia | |
| United Arab Emirates | |||
| Turkey | |||
| Rest of Middle East | |||
| Africa | South Africa | ||
| Nigeria | |||
| Rest of Africa | |||


Key Questions Answered in the Report
What is the current value of the Heat Stress Monitor market?
The Heat Stress Monitor market size reached USD 71.95 million in 2025 and is forecast to climb to USD 106.25 million by 2030.
How fast will demand for heat-stress wearables grow?
Wearable patches are projected to post an 8.5% CAGR through 2030, reflecting employers’ shift toward continuous, worker-centred monitoring.
Which technology segment is expanding the quickest?
AI/ML predictive analytics engines exhibit the highest forecast growth at 8.8% CAGR as enterprises transition from reactive alarms to proactive risk prediction.
Why is construction the leading end-user?
Construction commands 28% market share because outdoor crews face the highest heat-injury incidence and fall directly under pending OSHA mandates.
Which region offers the most rapid growth prospects?
The Middle East and Africa are set for an 8.9% CAGR through 2030, driven by extreme climatic conditions and large-scale infrastructure projects that require stringent worker protection.
How do insurers influence adoption rates?
Workers-comp carriers now provide premium discounts to employers that deploy certified monitoring systems, creating a direct ROI that accelerates procurement decisions.
Page last updated on:


