
Infrared Thermometer Market Size and Share
Market Overview
| Study Period | 2020 - 2031 |
|---|---|
| Market Size (2026) | USD 3.77 Billion |
| Market Size (2031) | USD 5.42 Billion |
| Growth Rate (2026 - 2031) | 7.52 % |
| Fastest Growing Market | Asia Pacific |
| Largest Market | North America |
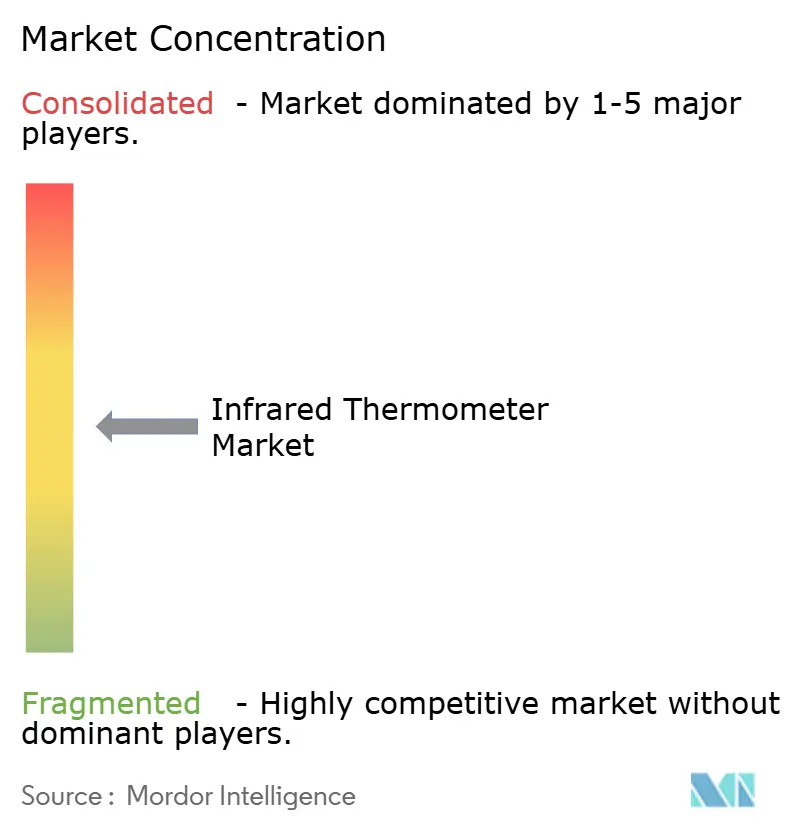
| Market Concentration | Medium |
Major Players *Disclaimer: Major Players sorted in no particular order Image © Mordor Intelligence. Reuse requires attribution under CC BY 4.0. | |
Infrared Thermometer Market Analysis by Mordor Intelligence
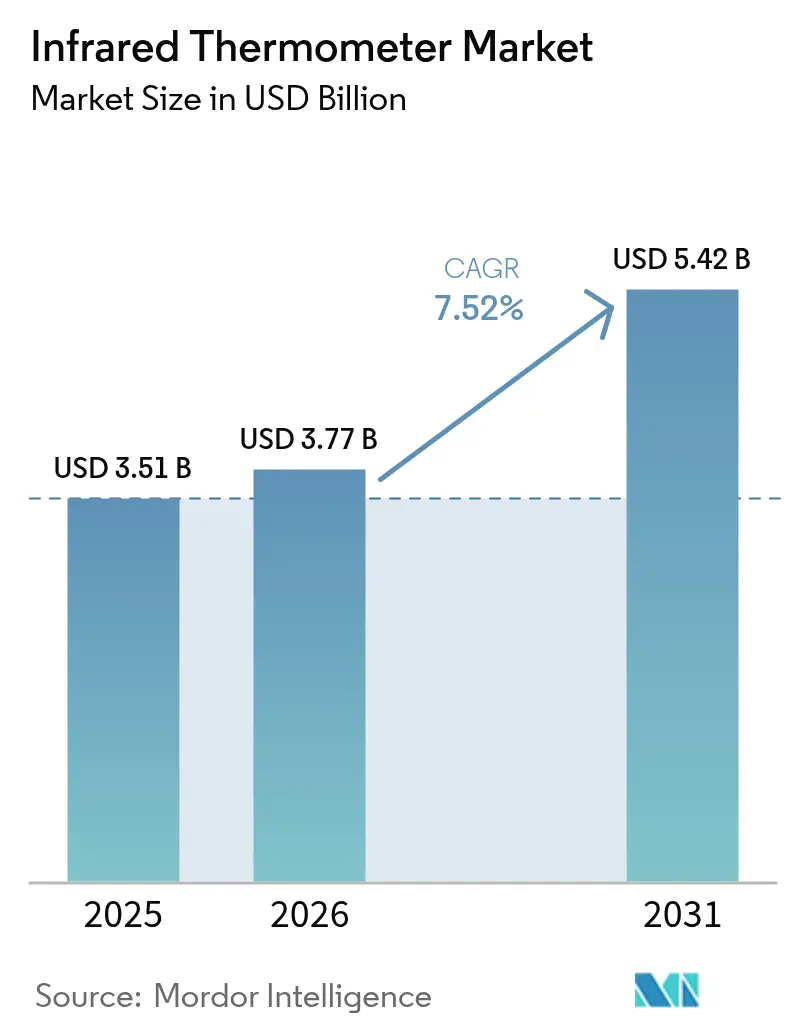
The infrared thermometer market size is expected to grow from USD 3.51 billion in 2025 to USD 3.77 billion in 2026 and is forecast to reach USD 5.42 billion by 2031 at 7.52% CAGR over 2026-2031. Expanding use cases—from clinical triage to predictive maintenance continue to enlarge the total addressable opportunity for the infrared thermometer market. Healthcare demand remains anchored by post-pandemic screening mandates, while manufacturers integrate embedded sensors with AI to curb production downtime.[1]MDPI Sensors, “Artificial Intelligence in IR Thermal Imaging and Sensing for Medical Applications,” mdpi.com Food processors in Europe adopt certified devices to comply with HACCP rules, reinforcing contactless monitoring.[2]Official Journal of the European Union, “Regulation (EU) 2023/988 on General Product Safety,” eur-lex.europa.eu Supply chain pressures on long-wave infrared (LWIR) sensors elevate costs, yet strategic acquisitions and new materials help leading vendors protect margins. Rising online sales channels, sharper telehealth penetration and EV battery safety needs collectively sustain the medium-term growth outlook for the infrared thermometer market [3]Frontiers in Medicine, “Uses of infrared thermography in acute illness: a systematic review,” frontiersin.org.
Key Report Takeaways
- By end-user industry, healthcare dominated with 60.55% revenue share in 2025, while electronics and semiconductor manufacturing is projected to post the fastest 8.05% CAGR through 2031.
- By type, non-contact devices captured 82.95% of infrared thermometer market share in 2025 and remain the quickest-growing category at 7.56% CAGR to 2031.
- By form factor, handheld pistol-grip units held 54.65% share in 2025; multipurpose ear-forehead devices are positioned to advance at a 8.72% CAGR through 2031.
- By temperature range, the 50 °C–500 °C band led with 62.55% share in 2025, whereas above-500 °C instruments are forecast to expand at an 8.52% CAGR to 2031.
- By Distribution Channel, Brick-and-mortar pharmacies and specialty outlets retained 66.95% share in 2025, but online vendors will rise at 8.74% CAGR to 2031.
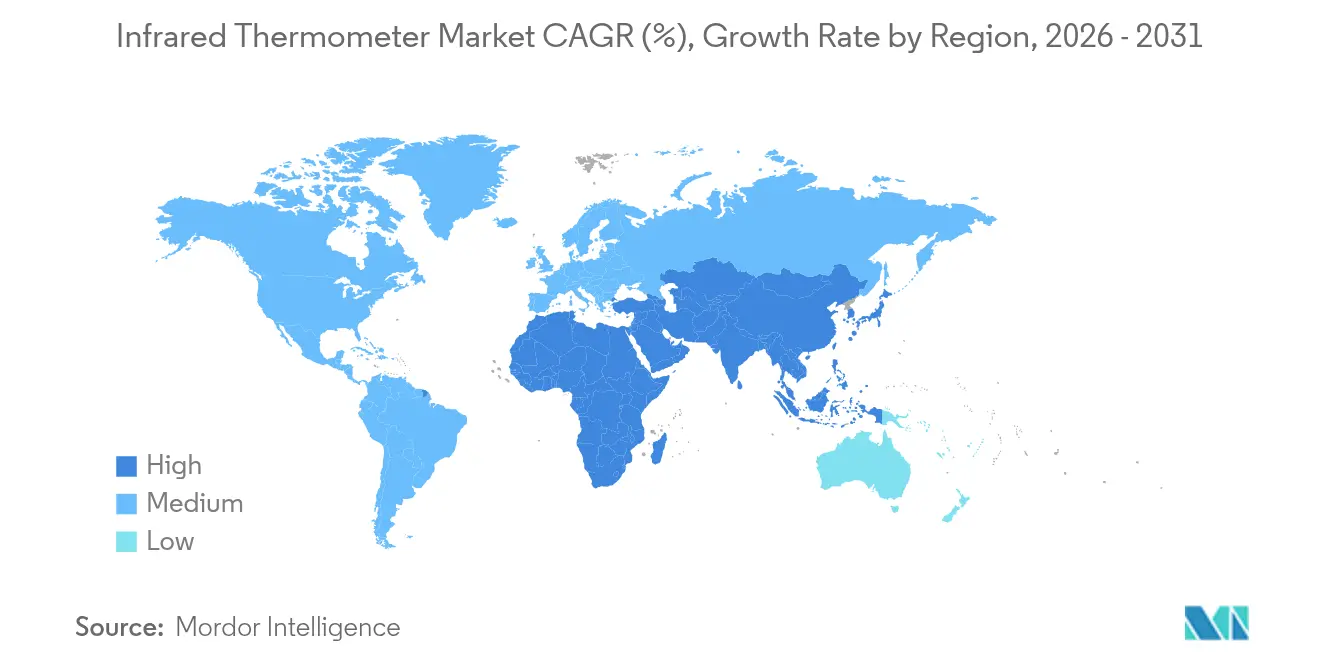
- By geography, North America accounted for 31.95% revenue in 2025; Asia-Pacific is projected to register the fastest 8.25% CAGR through 2031.
Note: Market size and forecast figures in this report are generated using Mordor Intelligence’s proprietary estimation framework, updated with the latest available data and insights as of 2026.
Market Trends and Insights
Drivers Impact Analysis of Infrared Thermometer Market*
| Driver | (~) % Impact on CAGR Forecast | Geographic Relevance | Impact Timeline |
|---|---|---|---|
| Surge in preventive screening at transportation hubs | +1.20% | Asia-Pacific; spillover to Middle East | Medium term (2-4 years) |
| Integration with Industrial IoT for predictive maintenance | +1.80% | Global; concentrated in North America & Europe | Long term (≥ 4 years) |
| HACCP compliance in food processing | +0.90% | Europe; expanding to North America | Short term (≤ 2 years) |
| Cloud-connected telehealth kiosks | +1.40% | North America | Medium term (2-4 years) |
| Autonomous thermal control in EV batteries | +1.10% | China, Europe, North America | Long term (≥ 4 years) |
| Non-contact QA tools in semiconductor foundries | +0.80% | Asia-Pacific core; expanding to North America | Medium term (2-4 years) |
| Source: Mordor Intelligence | |||
Surge in Preventive Screening at Transportation Hubs in Asia
Transportation authorities across Asia-Pacific have embedded thermal cameras in airports, rail terminals and ports, enabling real-time screening of more than 1,000 passengers per hour while meeting ASTM E 1965-98 accuracy thresholds. AI-enhanced imaging drives sensitivity above 94% and lowers false alarms. The same infrastructure is migrating to wearable devices for long-haul routes, permitting continuous monitoring on ferries and inter-city buses. Government funding programs in China and Japan allocate capital for permanent fever-screening installations, making the driver structural rather than transient.
Integration with Industrial IoT for Predictive Maintenance in Discrete Manufacturing
Factory operators integrate infrared probes with edge gateways to predict bearing, motor and switchgear failures up to two weeks before breakdown, cutting unplanned downtime by as much as 35%. Annual savings of USD 15-25 million are reported in large automotive and electronics plants. Machine-learning calibration raises sensor accuracy roughly 65%, letting inexpensive devices replace costly reference units. The practice is spreading to tier-2 suppliers as IoT platforms become subscription-priced.
Regulatory HACCP Compliance Driving Food-processing Adoption in Europe
The EU General Product Safety Regulation (2023/988) obliges processors to retain verifiable temperature logs, prompting installation of certified infrared arrays on production lines. Dairy operators have lowered contamination events 40% after automating heat-treatment checks. Blockchain-based traceability combines with infrared thermometry to create immutable audit trails for buyers and regulators. Non-destructive inspection through packaging cuts waste and speeds throughput.
Rapid Expansion of Cloud-connected Tele-health Kiosks in North America
Retail clinics and rural hospitals deploy telehealth kiosks that integrate infrared sensors for fever triage alongside pulse oximetry and BP measurement. FDA exemption of certain Class II thermometers from 510(k) premarket review in 2025 reduced compliance cost and shortened rollout times. Pharmacy-based kiosks improved access to basic diagnostics by 60% in underserved counties. Embedded AI guides patients to appropriate care, reducing unnecessary emergency visits.
Restraints Impact Analysis of Infrared Thermometer Market*
| Restraint | (~) % Impact on CAGR Forecast | Geographic Relevance | Impact Timeline |
|---|---|---|---|
| Calibration drift in high-humidity climates | -0.7% | Southeast Asia; tropical South America | Short term (≤ 2 years) |
| ITAR & dual-use curbs on uncooled LWIR sensors | -1.1% | Global; most severe in Asia-Pacific & Middle East | Medium term (2-4 years) |
| Counterfeit devices depressing ASPs | -0.9% | Global; price-sensitive markets | Long term (≥ 4 years) |
| Accuracy loss on low-emissivity automotive coatings | -0.4% | Global automotive hubs | Medium term (2-4 years) |
| Source: Mordor Intelligence | |||
Calibration Drift of Sensors in High-humidity Climates
Relative humidity above 80% accelerates sensor drift by 15-20%, pushing errors beyond 2 °C in clinical and food-safety settings. Southeast Asian processors now budget extra recalibration cycles, raising operating costs. Dual-blackbody methods alleviate drift yet require skilled technicians. Vendors are designing moisture-sealed optics and humidity-compensated firmware, but deployment remains uneven.
Import Curbs on Uncooled LWIR Sensors Limiting Supply Chains
Export controls under the U.S. Commerce Control List Category 6 and China’s quotas on germanium and gallium complicate sourcing of LWIR cores. Lead times lengthen and prices rise, especially for high-spec modules. LightPath’s BDNL4 glass partially offsets germanium shortages but is costlier and complex to process. Manufacturers diversify suppliers and localize production, yet geopolitical risks linger.
*Our forecasts treat driver/restraint impacts as directional, not additive. The impact forecasts reflect baseline growth, mix effects, and variable interactions.
Infrared Thermometer Market Segment Analysis
By Type:
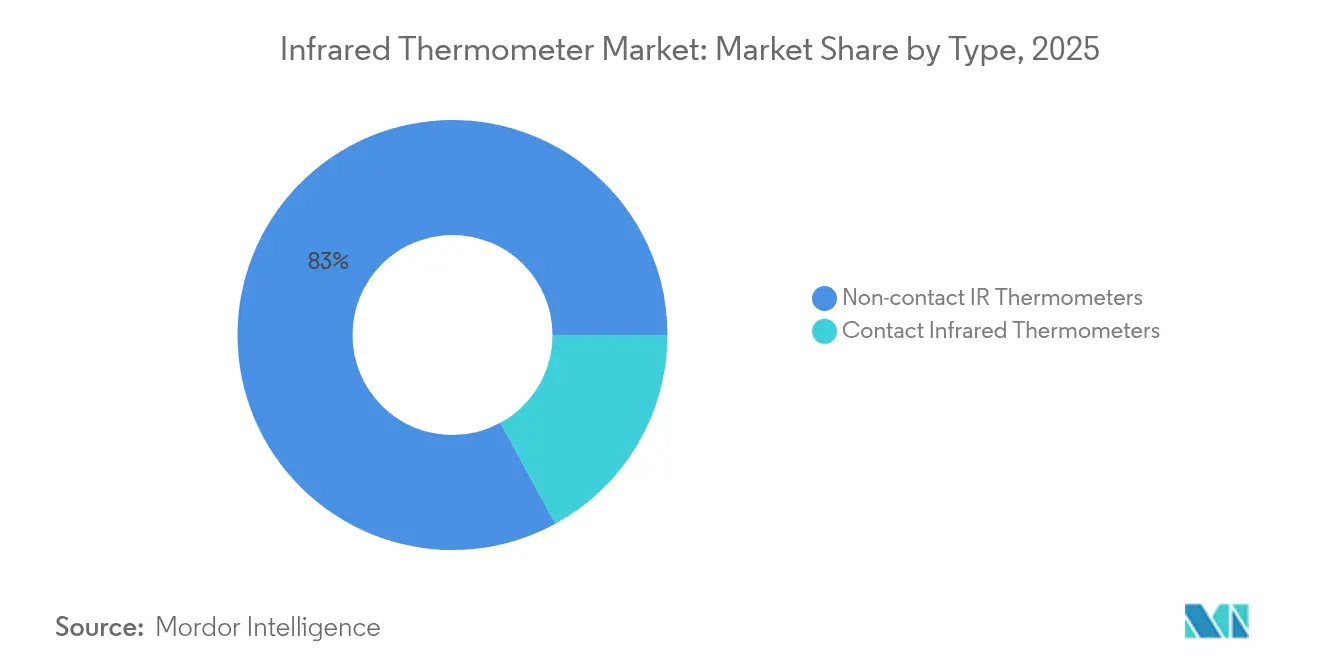
Non-contact Dominance Reflects Hygiene PrioritiesNon-contact instruments commanded 82.95% share in 2025 and will keep the lead with a 7.56% CAGR to 2031, mirroring long-term preference for touch-free screening. Hospitals recorded 90% declines in cross-contamination when switching from oral probes to infrared devices. Advanced algorithms now correct emissivity variance and ambient drift, holding ±0.3 °C accuracy. The infrared thermometer market size for non-contact models is poised to approach USD 4.44 billion by 2031 at the current pace.
Contact thermometers remain essential where surface equilibrium is mandatory—semiconductor wafer checks and metallurgy labs. Wireless logging and cloud dashboards elevate both categories. Hybrid systems that fuse contact and non-contact modes are being prototyped in research institutes, aiming to merge accuracy with convenience. Sustained R&D and lower optics costs should keep the infrared thermometer market on its current growth curve.



By Form Factor:
Multipurpose Devices Gain TractionHandheld pistol-grip units held 54.65% revenue in 2025 due to versatility in HVAC and plant maintenance. Yet ear-forehead hybrids are on course for a 8.72% CAGR to 2031 as clinics consolidate diagnostic tools. The infrared thermometer market share for multipurpose devices could exceed 20% before the end of the decade.
Fixed in-line sensors proliferate on automated lines, streaming data directly to MES platforms. Pocket pen thermometers cater to field technicians who value portability over advanced optics. Wearable patches and smart helmets are emerging, pointing to new niches that may reshape the infrared thermometer market over time.
By Temperature Range:
High-Temperature Applications Drive GrowthThe 50 °C–500 °C bracket comprised 62.55% of 2025 shipments because it aligns with body-heat screening, pasteurization and routine industrial tasks. Segment revenues will climb steadily with overall demand. Applications above 500 °C are growing quicker at 8.52% CAGR as steel, semiconductor and battery firms need precise thermal control. Here, the infrared thermometer market size for extreme-heat devices is forecast to more than double by 2031.
Cryogenic uses below −50 °C stay niche but strategic for biologics storage and aerospace R&D. Innovations in superlattice detectors and induction-heated calibration widen usable extremes. Broadening technical scope secures a resilient outlook for the infrared thermometer market.
By End-user Industry:
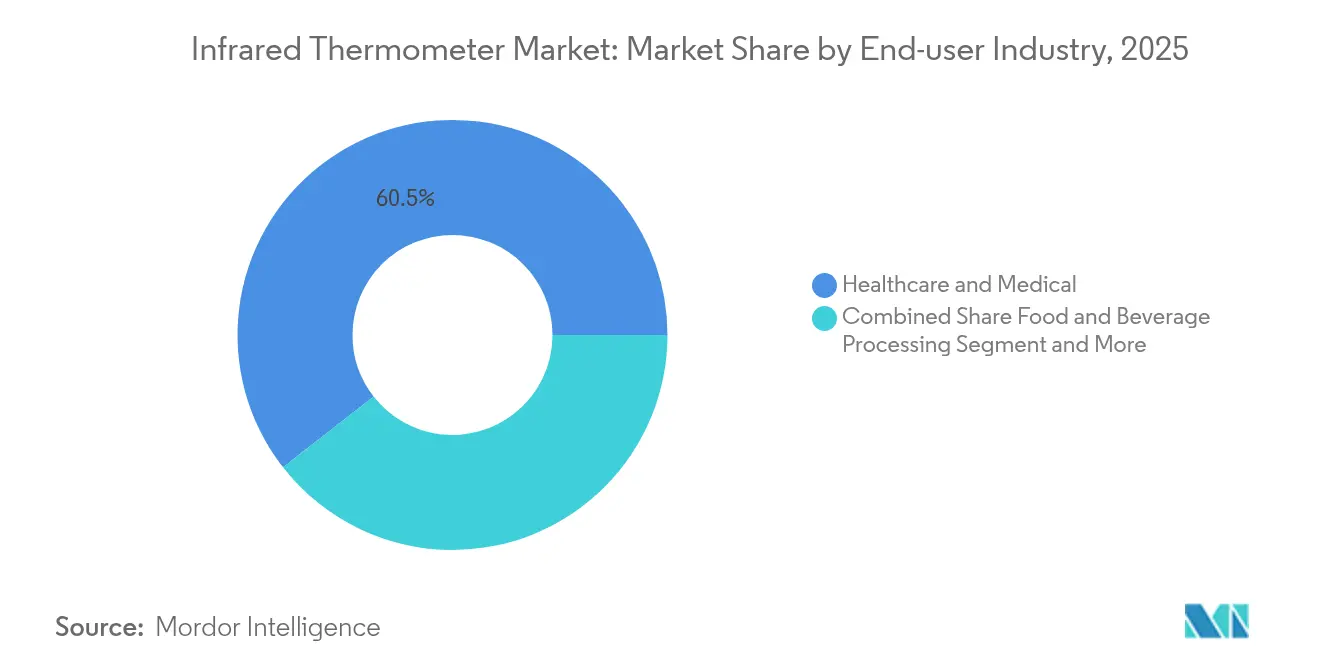
Electronics Sector Accelerates AdoptionHealthcare kept 60.55% of 2025 revenue and will remain dominant thanks to hospital protocols and home-health expansion. Electronics and semiconductor fabs, however, will log the fastest 8.05% CAGR, pushed by heat-sensitive sub-7 nm processes that demand non-contact metrology. The infrared thermometer market size attributed to fabs is on track for USD 0.92 billion by 2031.
Food and beverage plants integrate blockchain tracing with infrared checks to prove HACCP compliance, limiting recalls. Automotive OEMs embed sensors inside EV packs to avert thermal runaway, illustrating cross-industry convergence. Industrial IoT adoption propels uptake in heavy machinery health monitoring, ensuring the infrared thermometer market remains diversified.
By Distribution Channel:
E-commerce Transformation AcceleratesBrick-and-mortar pharmacies and specialty outlets retained 66.95% share in 2025, but online vendors will rise at 8.74% CAGR as consumers accept digital medical device purchases. Enhanced authentication labels and tighter platform rules mitigate counterfeit risk, improving trust in online listings.
Institutional direct procurement persists for volume deals in hospitals and factories. Subscription-based calibration services emerge online, bundling devices with annual accuracy checks. The shift reinforces the multi-channel nature of the infrared thermometer market and supports ongoing revenue streams.
Geography Analysis
North America Infrared Thermometer Market
North America generated 31.95% of 2025 turnover, underpinned by telehealth kiosks and strict food-safety enforcement. FDA deregulation of clinical infrared thermometers further accelerates deployments. Industrial IoT retrofits in discrete manufacturing compound the region’s demand profile. Thermo Fisher’s pledge to invest USD 2 billion in domestic facilities illustrates the commitment to local instrumentation leadership.
APAC Infrared Thermometer Market
Asia-Pacific will post an 8.25% CAGR to 2031, the fastest worldwide. China’s semiconductor dominance, Japan’s aging demographics and Southeast Asia’s transport screening create a potent mix of drivers. Calibration drift challenges in humid climates push vendors to innovate moisture-resistant optics. Record sales by HORIBA demonstrate the region’s appetite for precision measurement. Export restrictions on germanium heighten supply challenges, prompting material innovation and regional sourcing.
EMEA and LATAM Infrared Thermometer Market
Europe maintains a steady path grounded in HACCP enforcement, Industry 4.0 adoption and EV battery thermal management. Germany’s auto sector experiments with in-pack infrared arrays for battery safety, while Nordic buildings integrate thermal sensors into energy-saving HVAC systems. The region’s sustainability ethos spurs development of longer-life sensors. Latin America and the Middle East & Africa trail in absolute size yet deliver high-single-digit growth as healthcare infrastructure scales and industrial diversification intensifies.

Regulatory Landscape
Medical-use infrared thermometers operate within established medical-device frameworks, but compliance expectations have been moving in key markets. In the United States, non-contact infrared thermometers intended for medical diagnosis are regulated under 21 CFR 880.2910. In June 2025, the FDA issued a final order exempting certain clinical electronic thermometers from 510(k) premarket notification requirements. That change reduces time and cost for eligible device families while retaining quality-system and labeling obligations.
In Europe, market access for medical devices remains governed by Regulation (EU) 2017/745 (MDR), with continued attention on conformity assessment and notified body capacity. In May 2026, ISO 12487:2026 was published to standardize clinical performance evaluation of thermometers, which pushes global manufacturers to map results into design verification and clinical evidence documentation. The same month, Implementing Regulation (EU) 2026/977 introduced more uniform requirements for conformity assessment and notified bodies, reinforcing documentation rigor for manufacturers supplying clinical infrared thermometers into the EU.
Value Chain Analysis
The infrared thermometer value chain starts with IR sensing elements and optics, including germanium and alternative IR-transmissive glasses, then moves through module packaging and device assembly in handheld, fixed/inline, and multipurpose clinical formats. Procurement and integration are increasingly influenced by export restrictions and quotas affecting germanium and other inputs, which have raised uncertainty since 2023-2024. This has prompted some OEMs to lean on chalcogenide glass and other substitutes, while also increasing the emphasis on supplier qualification, traceability, and calibration infrastructure for healthcare and HACCP-driven food applications.
Downstream, manufacturers and integrators differentiate through tighter coupling of optical materials, lens fabrication, and sensor assembly, supported by software for emissivity correction, drift compensation, and connectivity to industrial IoT and clinical workflows. Distribution includes institutional procurement in hospitals, factories, and transport hubs, as well as retail and online channels where counterfeit risk raises the need for authentication and after-sales recalibration programs. Vendors are also moving toward wafer-level packaging and more integrated sensor-readout designs to shorten assembly steps, which supports smaller form factors for telehealth kiosks, fixed process monitoring, and embedded automotive or EV safety applications.
Competitive Landscape
The market is moderately fragmented but moving toward greater concentration. Teledyne’s USD 8 billion acquisition of FLIR unified thermal imaging assets across defense and commercial domains, cementing a multi-vertical powerhouse. Thermo Fisher, OMRON and others respond with heavy R&D in AI-aided calibration and IoT connectivity.
Cross-industry alliances reshape competition. Valeo’s partnership with Teledyne FLIR to deliver ASIL-B automotive cameras signals thermal imaging’s migration into mainstream ADAS stacks. Semiconductor foundries invest directly in sensor startups to secure supply and tailor performance.
Supply resilience emerges as a differentiator. Firms diversify optics substrates—chalcogenide, BDNL4 and alumino-silicate glass—to blunt germanium shortages. Regional assembly hubs outside sensitive trade lanes reduce ITAR exposure. Vendors offering calibration-as-a-service and cybersecurity-hardened firmware gain an edge in enterprise tenders.
Infrared Thermometer Industry Leaders
Thermo Fisher Scientific Inc.
OMEGA Engineering inc.
HORIBA, Ltd.
PCE Instruments
Teledyne FLIR
- *Disclaimer: Major Players sorted in no particular order
Infrared Thermometer Market Companies Covered in this Report
- Thermo Fisher Scientific Inc.
- Omega Engineering Inc.
- HORIBA Ltd.
- PCE Instruments
- Teledyne FLIR
- Extech Instruments Corporation
- Excelitas Technologies
- Optris GmbH
- Fluke Corporation
- General Tools and Instruments LLC
- Hioki E.E. Corporation
- SKF Group
- OMRON Corporation
- Thermomedics Inc.
- Microlife Corporation
- TriMedika Ltd.
- Braun GmbH
- Exergen Corporation
- Tecnimed Srl
- Paul Hartmann AG
- Lynred
- AMETEK Land
- A&D Company Ltd.
- Medtronic plc
- CHINO Corporation

Market Opportunities and Future Outlook
Product demand is shifting toward connected and continuously monitored temperature workflows rather than standalone spot checks. In industrial settings, predictive maintenance programs are moving from periodic handheld inspections to always-on monitoring, which increases the pull for fixed/inline sensors, edge gateways, and analytics that translate thermal anomalies into maintenance actions across motors, switchgear, transformers, and data center infrastructure. The direction is reflected in 2025-2026 IP and technical work on ML-based thermal anomaly detection and real-time machinery health monitoring, supporting product roadmaps that bundle infrared sensing with on-device inference, device management, and integration into CMMS/EAM systems.
In healthcare and screening, compliance requirements and harmonized standards shape where vendors can differentiate around accuracy, repeatability, and electromagnetic compatibility across connected clinical environments. IEC 60601-1-2:2014+A1:2020 and ISO 80601-2-56:2017 remain key anchors for medical electrical equipment and clinical thermometer performance, while IEC 80601-2-59:2017+AMD1:2023 sets test limits for screening thermographs used in febrile temperature detection. Manufacturers that align product design, calibration workflows, and documentation with these standards, and that use simplified pathways where applicable, including the FDA’s June 2025 exemption order for certain clinical electronic thermometers, have room to broaden deployments in telehealth kiosks, pharmacy-based triage points, and institutional screening programs.
Recent Industry Developments in Infrared Thermometer Market
- March 2026: HORIBA Advanced Techno Co., Ltd. launched the CS-900F, a fiber-optic, non-contact chemical concentration monitor for semiconductor wet processes such as cleaning and etching, using a relocated spectrometer design to shrink equipment footprint by about 60%. The release reinforces demand for compact, non-contact monitoring architectures in high-volume semiconductor environments, where temperature-adjacent process control and metrology drive adjacent procurement of non-contact sensing solutions.
- April 2025: Thermo Fisher Scientific committed USD 2 billion for US manufacturing and R&D, allocating USD 1.5 billion to capacity expansion and USD 500 million to instrumentation R&D. This investment supports tighter domestic supply and faster iteration cycles for measurement and instrumentation portfolios that overlap with industrial and clinical temperature-monitoring ecosystems.
- January 2024: Valeo and Teledyne FLIR signed a contract to supply ASIL-B thermal cameras for driver-assist systems. The agreement strengthens the pull for automotive-qualified thermal sensing components and supply chains, which can spill over into higher-volume, ruggedized non-contact temperature measurement and embedded thermal monitoring use cases.


Infrared Thermometer Market Report Scope and Research Methodology
Market Definition and Coverage
This market covers infrared thermometers that measure temperature from emitted thermal radiation, across clinical screening, industrial checks, food safety, and similar use cases. Our sizing is in revenue terms and reflects equipment sales captured within the defined product scope and geographies.
Scope exclusions: We exclude thermal imaging cameras and other multi-purpose imaging systems that are not sold or positioned as infrared thermometers.
Segments Covered in This Report
- By Type
- Contact Infrared Thermometers
- Non-contact Infrared Thermometers
- By Form Factor
- Handheld (Pistol-grip)
- Pocket/Pen-style
- Fixed/Inline Process-mount
- Multipurpose Ear-Forehead Devices
- By Temperature Range
- Below - 50 °C
- 50 °C - 500 °C
- Above 500 °C
- By End-user Industry
- Healthcare and Medical
- Food and Beverage Processing
- Electronics and Semiconductor
- Industrial Manufacturing
- Automotive and Transportation
- HVAC and Building Automation
- Veterinary and Animal Health
- Others
- By Distribution Channel
- Direct/Institutional Procurement
- Retail Pharmacies and Specialty Stores
- Online/E-commerce
- By Geography
- North America
- United States
- Canada
- Mexico
- Europe
- Germany
- United Kingdom
- France
- Nordics
- Rest of Europe
- South America
- Brazil
- Rest of South America
- Asia-Pacific
- China
- Japan
- India
- South-East Asia
- Rest of Asia-Pacific
- Middle East and Africa
- Middle East
- Gulf Cooperation Council Countries
- Turkey
- Rest of Middle East
- Africa
- South Africa
- Rest of Africa
- Middle East
- North America
Data Sources, Market Sizing, and Validation
Desk Research
Desk research started with clarifying how infrared thermometers are classified and used across medical, industrial, and food environments, and then we aligned that to measurable demand signals. We referred to public sources such as US FDA device safety communications and recall notices, CDC infection control and screening guidance, OSHA workplace safety references, and ISO standards notes that influence accuracy and calibration expectations. For trade flows and regional context, we also reviewed customs and statistics portals such as UN Comtrade and national statistical agencies where available.
To ground the model in real-world activity, we also reviewed manufacturer annual reports, investor decks, reputable press coverage, and distributor catalogs to understand product availability and pricing direction. Where helpful, paid subscriptions were used for company financials and news scanning, and for patent databases to track feature trends like emissivity settings and calibration methods. The examples above are illustrative, and many other public sources were also used to collect data, validate assumptions, and clear up scope questions.
Primary Interviews and Surveys
Primary work focused on interviews and short surveys with manufacturers, component and contract partners, distributors, and large institutional buyers that procure thermometry at scale. We used these discussions to confirm mix shifts between medical and non-medical demand, typical pricing by form factor, and how quickly demand rebounds after inventory corrections across major regions.
Distribution of primary research fieldwork respondents
| Company type | Respondent position | Region |
|---|---|---|
| Top tier: 31% | CXOs: 16% | APAC: 39% |
| Mid tier: 47% | Functional/Unit leaders: 40% | EMEA: 34% |
| Smaller Players: 22% | Managers: 44% | Americas: 27% |
Market-Sizing & Forecasting
The core build uses a top-down and bottom-up combination, where a demand pool is first reconstructed from end-use adoption and replacement patterns for infrared thermometry, and then translated into value using device mix and price logic. The totals are subsequently checked using selective bottom-up approximations, such as sampled ASP ranges by form factor multiplied by estimated volumes from channel conversations and publicly visible procurement signals.
Inputs that most often move the number include the share of non-contact thermometers used for screening versus clinical point-of-care measurement, the replacement cycle for consumer and institutional devices after COVID-era surges, the split of handheld versus fixed or stationary screening setups, the role of emissivity and accuracy requirements in industrial buying, and pricing spread by temperature range and calibration needs. When any volume data is incomplete, gaps are handled by using region-level penetration assumptions and then tightening them with distributor feedback and observed price bands.
For forecasting, scenario analysis is used so the model can reflect different paths for public health screening intensity, industrial maintenance activity, and channel stocking behavior. The final growth path is set only after assumptions like ASP progression and replacement rates are reviewed with primary respondents and stress-tested against recent procurement and pricing signals.
Data Validation & Update Cycle
Validation is done through triangulation across independent indicators, and we also run variance checks at region and end-use levels so one large assumption does not silently drive the whole output. When an input produces an unusual swing, the driver is traced back to a specific variable (like ASP, replacement timing, or screening intensity) and then rechecked through follow-up calls or alternate public references.
Before sign-off, the model and narrative go through a multi-step analyst review, where calculations, currency conversions, and year mapping are revalidated. Reports are refreshed annually, and interim updates are added when material events occur, such as major regulatory actions, large price resets, or sudden demand changes tied to public health guidance. Right before delivery, we do a fresh pass on key inputs so clients receive the most current view available at that time.
Mordor Intelligence's Infrared Thermometer Market Size Compared Against Other Published Estimates
Published market values for infrared thermometers can look far apart, even when the topic label seems the same, because the market can be built from different product boundaries and end-use assumptions. Differences also show up when one publisher anchors on a pandemic-affected year or blends finished devices with adjacent component categories.
The biggest gaps usually come from what gets counted as an infrared thermometer, how fixed or stationary screening units are treated, and whether OEM modules and sensors are included alongside finished thermometers. Time-period choices matter as well, because prices and purchase volumes normalized quickly after COVID-era surges, and not all estimates reset ASP and replacement cycles at the same speed.
Benchmark comparison
| Source | Market Size | Gaps in Research Methodology |
|---|---|---|
| Mordor Intelligence | USD 3.77 B (2026) | |
| Industry Publisher A | USD 3.00 B (2024) | Uses a different base year and appears to include OEM modules and sensors alongside finished devices, which can shift the total away from a finished-thermometer revenue view. |
| Research Publisher B | USD 1.58 B (2024) | Narrow scope focused on portable, non-contact infrared thermometers only, which excludes contact types and many fixed or stationary deployments used in industrial and entrance screening. |
Taken together, the spread is mainly explained by scope and year selection, rather than a single arithmetic disagreement. When OEM modules are added, or when only portable non-contact products are counted, the total naturally shifts away from a like-for-like view, and this market model keeps those add-on items outside scope and refreshes post-pandemic pricing and replacement timing consistently, as done by Mordor Intelligence.


Key Questions Answered in the Report
How large is the infrared thermometer market in 2026?
The market is valued at USD 3.77 billion in 2026, with a forecast CAGR of 7.52% over 2026-2031.
Which segment grows fastest in the infrared thermometer market?
Electronics and semiconductor manufacturing leads with an 8.05% CAGR through 2031 because non-contact sensors help maintain advanced-node yields.
Why are non-contact infrared thermometers preferred?
They eliminate cross-contamination, comply with hygiene regulations and now achieve ±0.3 °C accuracy, supporting their 82.95% share in 2025.
What is driving demand in Asia-Pacific?
Mass transportation screening, rapid semiconductor expansion and EV battery safety needs lift Asia-Pacific growth to an 8.25% CAGR.
Page last updated on:


 Your data is secure and never sold or shared.


