
Market Overview
| Study Period | 2020 - 2031 |
|---|---|
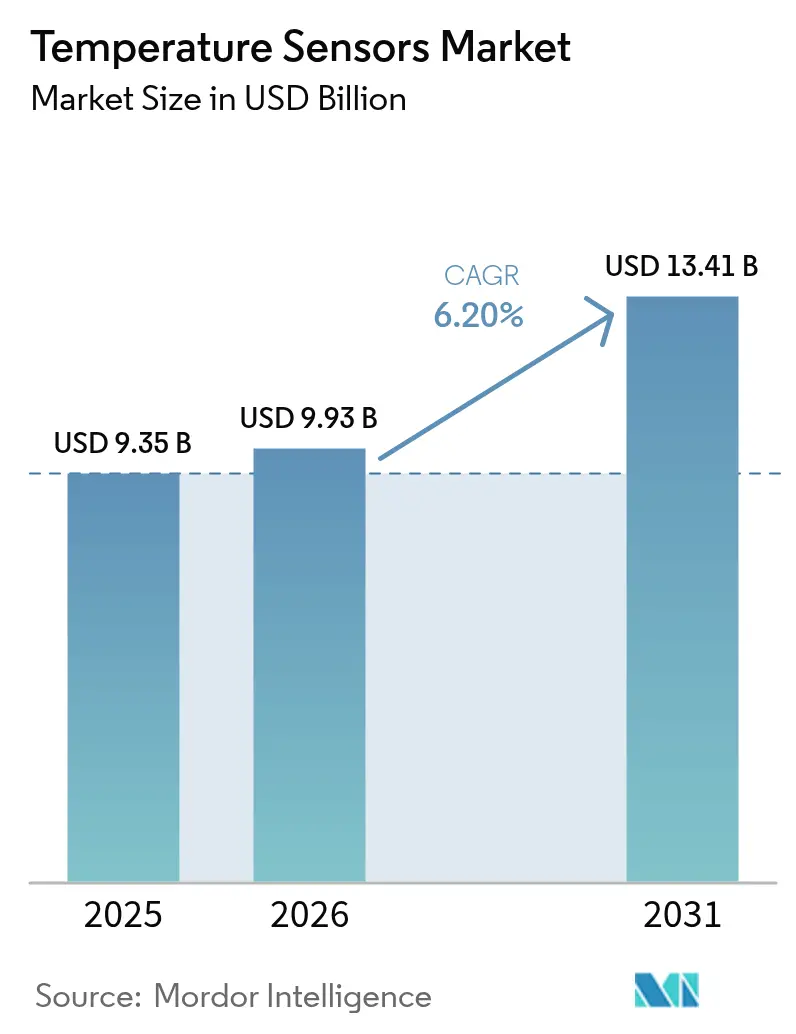
| Market Size (2026) | USD 9.93 Billion |
| Market Size (2031) | USD 13.41 Billion |
| Growth Rate (2026 - 2031) | 6.20 % |
| Fastest Growing Market | Asia Pacific |
| Largest Market | Asia Pacific |
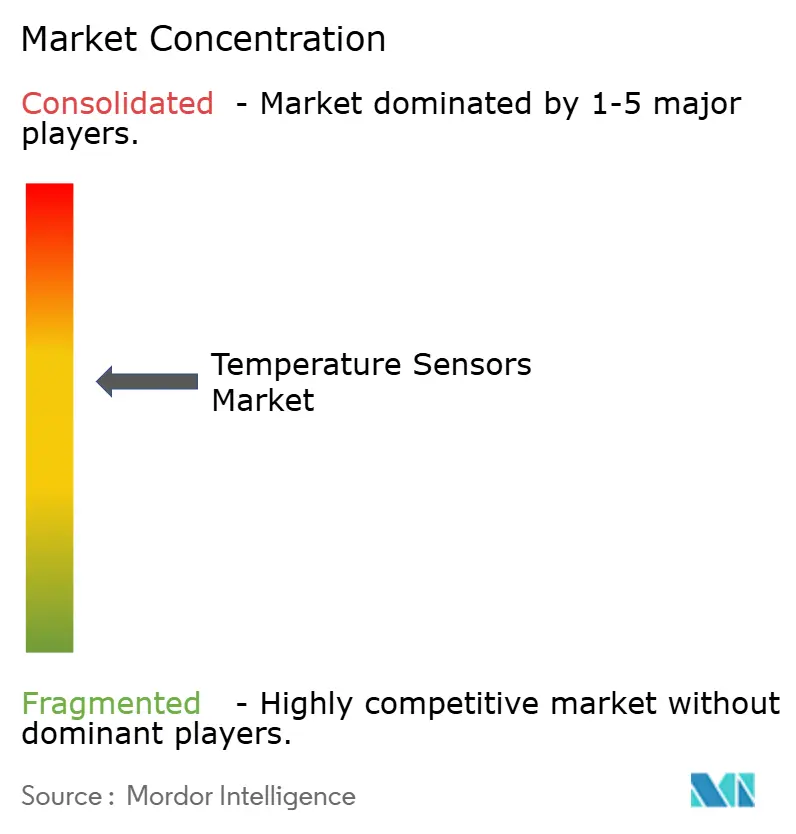
| Market Concentration | Medium |
Major Players *Disclaimer: Major Players sorted in no particular order Image © Mordor Intelligence. Reuse requires attribution under CC BY 4.0. | |
Temperature Sensors Market Analysis by Mordor Intelligence
The temperature sensor market size is expected to grow from USD 9.35 billion in 2025 to USD 9.93 billion in 2026 and is forecast to reach USD 13.41 billion by 2031 at 6.2% CAGR over 2026-2031. Demand is rising as industrial facilities digitize, electric vehicles proliferate, and life-science supply chains enforce real-time thermal traceability. Regulatory cold-chain mandates for biologics, hyperscale data-center buildouts that favor fiber-optic distributed sensing, and widespread IIoT adoption across European process plants jointly elevate sensor volumes. Growth is further strengthened by GaN/SiC power-electronics adoption, which raises precision-cooling requirements, and by 5G base-station deployments that need on-board thermal monitoring to protect uptime. On the supply side, vertically integrated incumbents counter price pressure from low-cost Asian suppliers by focusing on high-accuracy products and wireless retrofit solutions that reduce total installed cost.
Key Report Takeaways
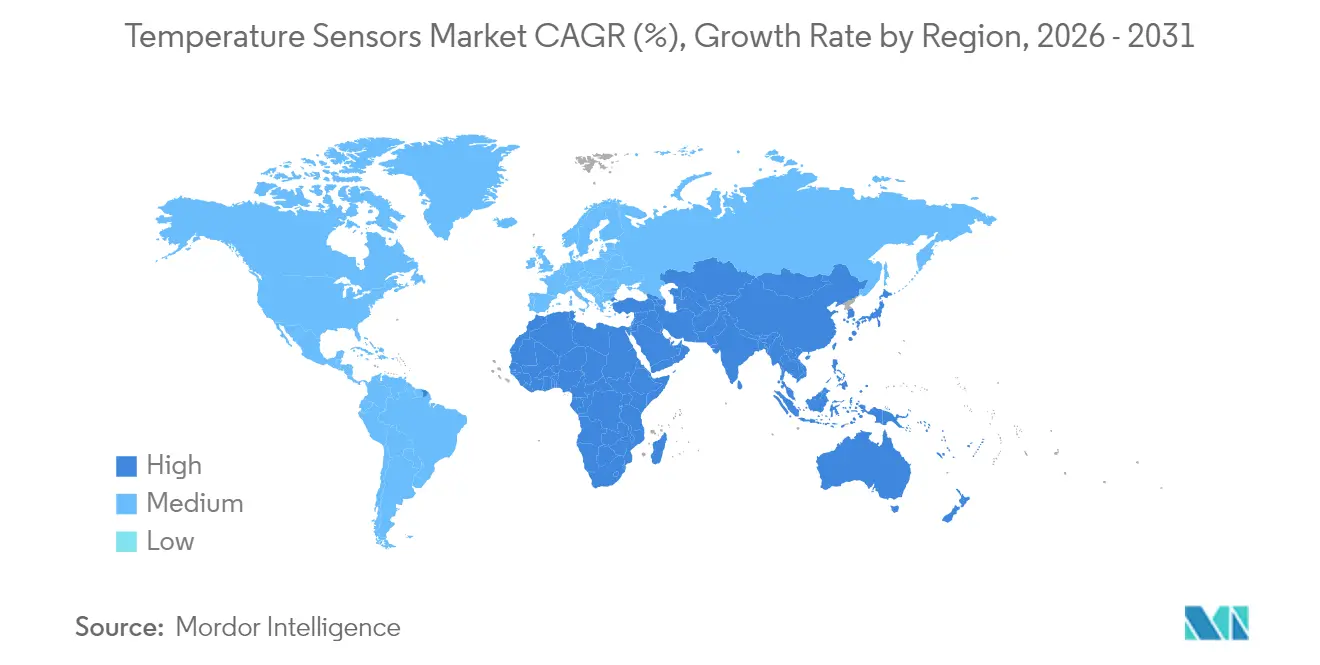
- By geography, Asia-Pacific held 44.72% of the temperature sensor market share in 2025 and is expanding at 7.05% CAGR through 2031.
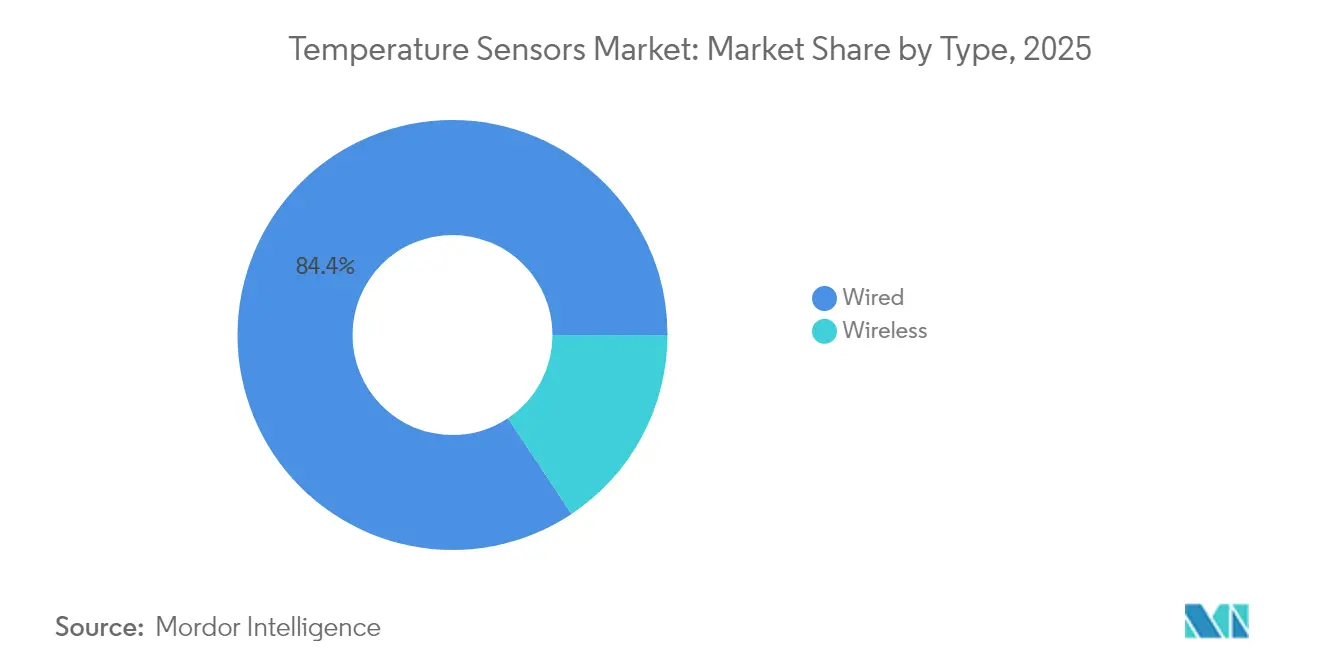
- By connectivity, wired sensors led with 84.35% revenue share in 2025; wireless is the fastest-growing segment at 11.2% CAGR through 2031.
- By Output, Analog devices retained 70.65 % revenue in 2025 because 4–20 mA loops still anchor distributed-control-system (DCS) inputs in refineries and steel mills. Digital sensors, however, are expanding 9.1 % CAGR to 2031.
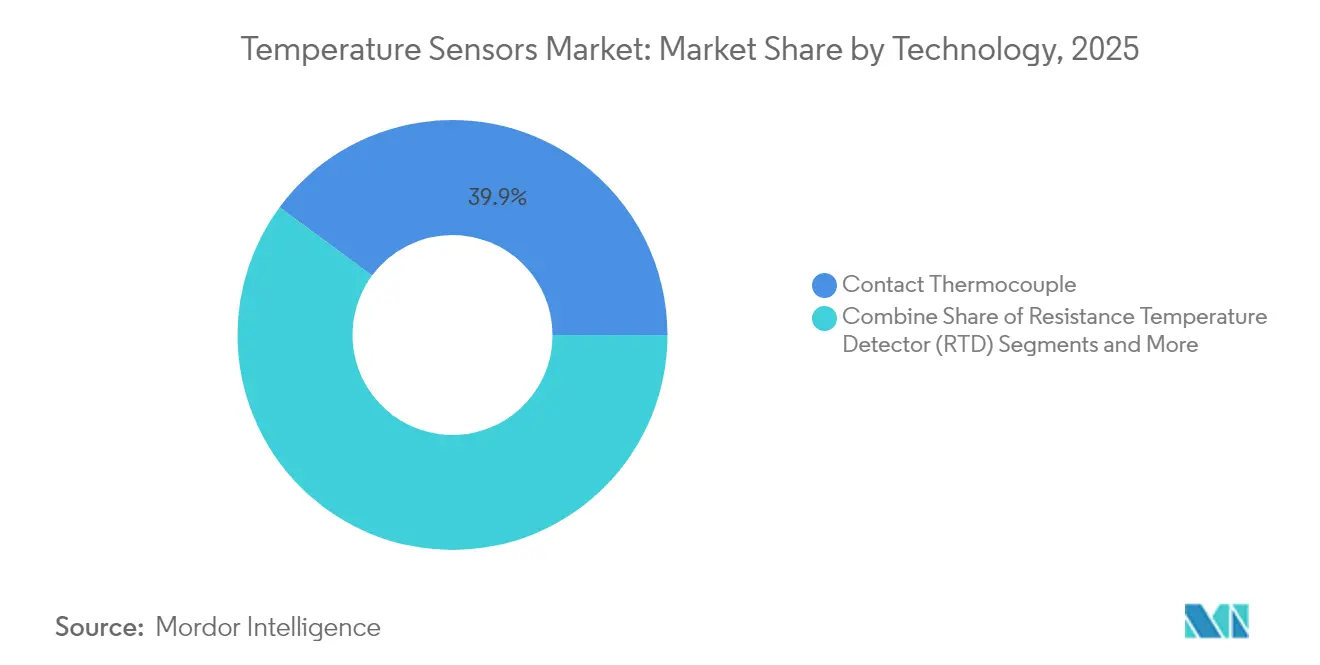
- By technology, thermocouples captured 39.88% of 2025 revenue, whereas fiber-optic distributed sensing is advancing at a 10.1% CAGR to 2031.
- By end user, oil & gas retained an 17.85% share in 2025; medical & healthcare applications are progressing at 8.4% CAGR through 2031.
- Honeywell, Siemens, and Texas Instruments together accounted for a double-digit temperature sensor market share in 2024, leveraging vertical integration to protect margins.
Note: Market size and forecast figures in this report are generated using Mordor Intelligence’s proprietary estimation framework, updated with the latest available data and insights as of 2026.
Market Trends and Insights
Drivers Impact Analysis of Temperature Sensors Market*
| Driver | ( ) % Impact on CAGR Forecast | Geographic Relevance | Impact Timeline |
|---|---|---|---|
| Expansion of Smart IIoT Temperature Networks in European Process Industries | 1.20% | Europe, spill-over to North America | Medium term (2-4 years) |
| GaN/SiC Power Electronics Adoption Elevating Precision-Cooling Sensor Demand | 0.80% | Asia-Pacific core, expanding global | Long term (≥ 4 years) |
| Mandatory Cold-Chain Traceability for Biologics & mRNA Vaccines | 1.50% | North America & EU, emerging APAC | Short term (≤ 2 years) |
| 5G Base-Station Roll-outs Requiring On-Board Thermal Monitoring | 0.70% | Asia-Pacific, selective global | Medium term (2-4 years) |
| Electrified-Mobility Thermal-Management Modules Adoption | 1.10% | Europe & North America, expanding APAC | Medium term (2-4 years) |
| Hyperscale Data-Center Build-out Driving Fiber-Optic Distributed Sensing | 0.90% | Global | Long term (≥ 4 years) |
| Source: Mordor Intelligence | |||
Expansion of Smart IIoT Temperature Networks in European Process Industries
European manufacturers are integrating wireless temperature nodes into existing control architectures to meet Industry 5.0 goals for energy efficiency and worker safety. [1]Siemens AG, “Temperature Sensors,” siemens.com Maintenance-free sensor designs lower lifecycle cost and simplify retrofit deployment, which is attractive in chemical-fiber plants and HVAC upgrades. AI-enabled control loops use the richer data stream to stabilize air-pressure and thermal conditions, improving product yield and reducing downtime.[2]Jiann-Shing Shieh, “Development of a Human-Centric Autonomous HVAC Control System,” MDPI, mdpi.com Return-on-investment studies in small US factories show operating savings that outweigh initial IIoT hardware spend, validating capital budgets for similar. As a result, wireless nodes gain momentum even in reliability-critical applications, accelerating the temperature sensor market toward connected architectures.
GaN/SiC Power Electronics Adoption Elevating Precision-Cooling Sensor Demand
Gallium-nitride and silicon-carbide devices operate at higher power densities, creating localized heat zones that require sub-degree monitoring accuracy. Semiconductor suppliers forecast GaN reaching commercial tipping points in fast chargers, AI servers, and electric-vehicle converters. [3]Infineon Technologies AG, “GaN to Reach Adoption Tipping Points,” infineon.com Automotive OEMs specify sensors that maintain calibration under strong electromagnetic fields, while data-center operators adopt multi-point thermal maps to contain hotspot risk. Research into aluminum-nitride thin-film sensors shows reliable operation up to 900 °C, extending sensor use into extreme power-electronics environments . Suppliers that deliver precision and EMI immunity at competitive cost are well-positioned to gain share in the temperature sensor market.
Mandatory Cold-Chain Traceability for Biologics & mRNA Vaccines
The US Food and Drug Administration continues to tighten oversight on temperature deviations in biologic distribution, and real-time loggers with GPS connectivity have become a regulatory expectation. Pharmaceutical firms lose an estimated USD 35 billion annually to temperature-induced spoilage, incentivizing investment in cloud-linked sensors that issue instant alerts. Adoption extends into last-mile distribution, boosting demand for low-power digital sensors able to operate across multiday shipments. Blockchain pilots that record immutable temperature histories further embed sensors into supply-chain architectures, raising the baseline unit volume for the temperature sensor market.
5G Base-Station Roll-outs Requiring On-Board Thermal Monitoring
High-bandwidth 5G radios dissipate more heat than LTE equipment, and equipment failures from overheating threaten service quality. Asian carriers install rugged sensors rated for outdoor temperature swings and electromagnetic interference, enabling predictive maintenance programs that cut field-repair costs. AI algorithms now dynamically throttle power amplifiers based on real-time readings, improving energy efficiency without sacrificing throughput. These roll-outs expand sensor content per base station, supporting above-average regional growth for the temperature sensor market.
Restraints Impact Analysis of Temperature Sensors Market*
| Restraint | ( ) % Impact on CAGR Forecast | Geographic Relevance | Impact Timeline |
|---|---|---|---|
| Downward ASP Pressure from Chinese Low-Cost Suppliers | −0.9% | Global, most severe APAC | Short term (≤ 2 years) |
| Supply Risk of High-Purity Platinum Wire for RTDs | −0.6% | Global, heavy industrial | Medium term (2-4 years) |
| Calibration-Drift Liability Claims in Pharma Manufacturing | −0.4% | North America & EU | Long term (≥ 4 years) |
| Extended automotive Tier-1 design-freeze cycles delaying adoption | −0.3% | Global; acute in Europe and North America | Medium term (2-4 years) |
| Source: Mordor Intelligence | |||
Downward ASP Pressure from Chinese Low-Cost Suppliers
State-supported economies of scale allow Chinese vendors to undercut global peers on commodity thermocouples and basic RTDs, eroding margins across the temperature sensor market. European firms are countering by releasing cost-efficient yet accurate models such as Sensirion’s STS4L, which draws micro-watts of power while holding ±0.4 °C accuracy, thereby defending share without direct price wars
Supply Risk of High-Purity Platinum Wire for RTDs
High-purity platinum, refined by only a handful of facilities worldwide, concentrates supply risk for RTD producers. YAGEO Nexensos is broadening refining capacity across Europe and Asia, yet geopolitical tensions could still disrupt flows, pushing OEMs toward silicon-based IC sensors where permissible
*Our forecasts treat driver/restraint impacts as directional, not additive. The impact forecasts reflect baseline growth, mix effects, and variable interactions.
Temperature Sensors Market Segment Analysis
By Connectivity:
Wireless Adoption AcceleratesWired sensors continued to dominate with 84.35 % revenue in 2025, anchoring production-critical loops that must resist electromagnetic interference and latency risks. Wireless nodes are closing the gap, expanding at 11.2 % CAGR to 2031 as factories retrofit legacy lines and building-management firms deploy battery-powered transmitters that install without conduit work. The temperature sensor market benefits because every wireless retrofit typically adds extra redundancy channels, lifting unit volumes and service revenues. Use cases span chemical reactors, HVAC balancing and remote well-head monitoring, each demanding secure protocol stacks and multi-year battery life.
Rapid protocol maturation is reducing the reliability delta versus copper cabling and bringing average project payback below two years for multi-node deployments. Honeywell’s ISA100-compliant SmartLine transmitter illustrates how encrypted mesh architectures keep packet loss below 0.01 % while reporting sub-second updates [honeywell.com]. Operators also value firmware-over-the-air upgrades that let them roll out cyber-security patches without line shutdowns, a feature now common across the temperature sensor market. The overall temperature sensor industry therefore sees wireless not as a niche but as the long-term default for brown-field sites.



By Output:
Digital Channels Gain GroundAnalog devices retained 70.65 % revenue in 2025 because 4–20 mA loops still anchor distributed-control-system (DCS) inputs in refineries and steel mills. Digital sensors, however, are expanding 9.1 % CAGR to 2031 as industrial Ethernet, I²C and 1-Wire buses proliferate in edge-to-cloud architectures. When digital nodes embed EEPROM-based calibration, installers no longer need plant-floor trim, cutting commissioning cost and shortening downtime. The temperature sensor market size for digital devices is projected to reach USD 5.38 billion by 2031, reflecting this accelerating conversion.
Texas Instruments’ ±0.08 °C TMP117 exemplifies how embedded CRC-protected registers improve traceability in pharmaceutical plants that must archive calibration data for FDA audits [ti.com]. Data-rich packets also enable asset-performance-management algorithms that predict failure before excursions occur, extending pump and motor life and lowering indemnity exposure. Vendors consequently bundle analytics dashboards as value-added subscriptions that smooth revenue cyclicality across the temperature sensor market.
By Technology:
Fiber-Optic Distributed Sensing ScalesThermocouples held 39.88 % of 2025 revenue thanks to 1,700 °C limits, simple construction and low unit cost. Fiber-optic distributed temperature sensing (DTS) is the fastest-growing line, climbing 10.1 % CAGR as hyperscale data centers and midstream pipelines require continuous temperature profiles over kilometers. Operators specify DTS because it provides thousands of virtual points along a single fiber, immune to EMI and capable of 1 m spatial resolution. The temperature sensor market size for DTS installations in data centers alone is forecast to post an 10.8 % annual increase through 2031.
AP Sensing’s Raman-backscatter platform captures ≥0.1 °C variations, feeding AI models that trim chiller energy use by up to 30 % [apsensing.com]. Meanwhile, aluminum-nitride thin-film research demonstrates calibration stability to 900 °C, pointing to crossover opportunities in GaN/SiC test rigs and geothermal wells [sciencedaily.com]. Incumbent thermocouple suppliers are responding with hybrid probes that embed fiber strands into Inconel sheaths, protecting legacy share while tapping the emerging distributed segment of the temperature sensor market.
By End-User:
Healthcare Outpaces Heavy IndustryOil & gas led with 17.85 % contribution in 2025, driven by refinery reformer loops, LNG liquefaction trains and down-hole logging. Medical and healthcare lines are the growth engine, rising 8.4 % CAGR on the back of mRNA vaccine production and biologics cold-chain authentication. Regulatory traceability needs make high-accuracy, Bluetooth-enabled data loggers standard on every pallet, multiplying unit count per shipment. Battery EV manufacturing is another pull factor; each 80 kWh pack now integrates more than 15 cell-level probes plus coolant-loop sensors, boosting the temperature sensor market even when auto output cycles.
Data-center operators round out the demand mix by specifying fiber DTS and 1-Wire node strings for rack-level thermal mapping. A single 200 MW campus can deploy over 50,000 sensing points, dwarfing the count in conventional office HVAC. Aerospace and nuclear applications maintain premium ASP niches where redundant RTDs and ceramic thermistors are mandatory for flight safety and radiation hardness. Collectively these diverse adopters keep the temperature sensor market insulated from single-sector downturns.
Geography Analysis
APAC Temperature Sensors Market
Asia-Pacific generated 44.72 % of 2025 revenue and is advancing at a 7.05 % CAGR, supported by China’s 5G macro-cell rollout and India’s build-out of GMP-compliant vaccine plants. Government subsidies for EV battery lines amplify sensor density per vehicle, while domestic semiconductor fabs adopt clean-room loops that demand ±0.2 °C RTDs. Japan and South Korea add precision-manufacturing pull, especially for SiC wafer furnaces requiring 1,400 °C sensors.
North America Temperature Sensors Market
North America follows with pharmaceutical cold-chain compliance and hyperscale cloud campuses that often deploy >150 km of fiber DTS per site. The FDA’s 2025 waiver on certain clinical thermometers accelerates device qualification cycles, while DOE-funded efficiency targets push data-center operators to sub-1 °C inlet-air control. Automotive Tier-1 design cycles are longer, yet every new EV platform still expands thermal nodes, tying the temperature sensor market to Detroit’s electrification timetable.
Europe Temperature Sensors Market
Europe prioritizes Industry 5.0 retrofits, leveraging EU-level grants for smart-factory upgrades that merge wireless sensor networks with digital twins. EV adoption likewise lifts battery thermal-management units per vehicle. The region’s energy transition stimulates demand for corrosion-resistant probes in hydrogen electrolyzers and offshore wind converters. Overall the temperature sensor industry in Europe is characterised by premium ASPs and stringent metrology standards that shield margins against global price competition.

Regulatory Landscape
Temperature sensors used in regulated industrial, commercial, and healthcare environments are shaped by international standards, metrology rules, and sector-specific compliance requirements. In May 2026, IEC published IEC 60730-2-9:2026, updating requirements for temperature-sensing controls in electrical and industrial systems, and it is commonly used as a conformity route for safety-oriented control products in regions that recognize IEC-based schemes. For platinum RTD elements, IEC 60751:2022 continues to anchor performance and interchangeability requirements, affecting procurement specifications for process plants, building automation, and OEM probes.
In the United States, calibration and verification expectations influence adoption of higher-accuracy and traceable sensors in commercial and regulated use cases. NIST Handbook 44 (2026 edition, reflecting adopted amendments via NCWM processes) is referenced for commercial measurement practices, supporting demand for documented, traceable calibration where temperature measurement underpins transactions or compliance. Sector rules also harden sensor and calibration protocols, including EPA emissions measurement system requirements in 40 CFR 1065 (temperature sensor type and calibration provisions) and periodic verification expectations for temperature-indicating devices in regulated heat-processing environments (for example, 9 CFR 431.6), which increases recurring calibration, documentation, and replacement cycles across installed bases.
Value Chain Analysis
The temperature sensor value chain starts with upstream materials and substrates, including platinum wire for RTDs, thermistor ceramics, thermocouple alloys, silicon wafers and packaging materials for temperature ICs, and specialty optical fiber for distributed sensing. These inputs move into element fabrication, probe construction and assembly (including sheathing and connectors), and electronics integration, such as signal conditioning, transmitters, and connectivity modules, followed by calibration and certification services, often aligned to ISO/IEC 17025 for industrial and life-science customers. Distribution typically runs through industrial automation channels, HVAC and building controls OEMs, electronics distributors, and direct sales tied to project engineering and MRO programs.
Bottlenecks and value capture increasingly sit in calibration capability, ruggedized packaging, and software-enabled diagnostics rather than commodity sensing elements. Supply risk is visible in high-purity platinum for RTDs, which pushes some OEMs toward silicon-based IC sensors where the application allows and raises the strategic importance of long-term sourcing and refining capacity. Portfolio consolidation is also reshaping the midstream: in July 2026, Infineon completed the acquisition of the non-optical analog/mixed-signal sensor portfolio from ams OSRAM, strengthening its sensor positioning for industrial and automotive applications and reinforcing the shift toward integrated, semiconductor-led sensing platforms that bundle temperature measurement with edge connectivity and diagnostics.
Competitive Landscape
The market is moderately concentrated: the top five groups control roughly 55 % of global revenue, leaving meaningful share for regional specialists. Honeywell, Siemens and Texas Instruments exploit vertical integration, supplying ASICs, packaging, calibration services and cloud dashboards. STMicroelectronics and Infineon target digital IC niches, embedding temperature cores inside PMICs to guarantee board-level thermal protection.
Strategic moves underscore a pivot toward solutions over components. DwyerOmega’s 2024 purchase of Process Sensing Technologies broadened its pharmaceutical and energy analytics suite, while Crane Company’s USD 1.06 billion bet on Baker Hughes’ Precision Sensors bolsters aerospace and nuclear portfolios. SICK and Endress+Hauser formed a process-automation joint venture delivering gas analyzers with integrated temperature outputs, illustrating ecosystem convergence.
Established players guard margins by focusing on medical-grade accuracy, extended-lifetime drift specs and ISO/IEC 17025 calibration certificates. Chinese entrants compete on cost in commodity thermocouples but struggle to meet Western pharma and avionics traceability clauses. Emerging disrupters experiment with quantum-based probes that promise calibration-free operation; NIST’s Rydberg-atom prototype hints at a future niche for ultra-high-precision environments. These dynamics collectively sustain innovation intensity across the temperature sensor market.
Temperature Sensors Industry Leaders
Honeywell International Inc.
Siemens AG
ABB Ltd.
Texas Instruments Inc
Emerson Electric Co.
- *Disclaimer: Major Players sorted in no particular order
Temperature Sensors Market Companies Covered in this Report
- Honeywell International Inc.
- Siemens AG
- Texas Instruments Inc.
- STMicroelectronics N.V.
- TE Connectivity Ltd.
- Panasonic Corporation
- ABB Ltd
- Emerson Electric Co.
- Analog Devices Inc.
- Denso Corporation
- Microchip Technology Inc.
- Amphenol Advanced Sensors
- Sensirion AG
- Endress+Hauser AG
- Robert Bosch GmbH
- Fluke Process Instruments
- FLIR Systems (Teledyne)
- Gnther GmbH Temperaturmesstechnik
- Kongsberg Gruppen
- Maxim Integrated Products
- Thermometris

Market Opportunities and Future Outlook
Interoperability and cloud-ready semantics create whitespace for temperature sensor suppliers that can provide not only measurement performance, but also standardized data transport, onboarding, and event models for industrial users. In 2026, multiple standards and specifications reinforced this direction: IEEE published IEEE 1451.1.6-2025 (noted in early 2026) to define a method for transporting sensor data over MQTT networks, IAES released v1.3 (March 2026) aligning industrial measurement events with ISO 14224 and ISO 13374 concepts, and the OPC Foundation launched the v7-2026 Cloud Reference Architecture (April 2026) to standardize edge-to-cloud and cloud-to-cloud integration patterns. Together, these anchor points support opportunities in gateways, transmitters, and sensor modules that ship with OPC UA and MQTT compatibility and structured information models that fit digital twin and APM workflows, particularly for brownfield wireless retrofits where integration friction drives total installed cost.
A second opportunity area lies in extreme-environment sensing, where conventional designs face material limits, especially high-temperature fiber-optic sensing beyond typical silica performance. Technical discourse in 2026 points to development activity around specialized fibers and structures for optical temperature sensing above 800 C, which connects directly to the report scope drivers around hyperscale data centers, midstream monitoring, and higher power-density GaN/SiC power electronics that increase hotspot risk and raise demand for denser thermal mapping. Demand pull also shows up in regulated cold-chain traceability (FDA scrutiny and audit readiness) and in industrial modernization programs that favor maintenance-reducing, diagnostics-rich devices, creating room for vendors that combine drift monitoring, self-validation features, and traceable calibration records with secure, standards-aligned connectivity.
Recent Industry Developments in Temperature Sensors Market
- July 2026: Infineon completed the acquisition of the non-optical analog/mixed-signal sensor portfolio from ams OSRAM Group. The acquisition broadens Infineon’s sensor offering for industrial and automotive applications, supporting tighter integration of temperature sensing with mixed-signal processing and system-level diagnostics.
- December 2025: Resideo launched the Honeywell Home X8S smart thermostat with room sensor support and expanded comfort control features. The release highlights ongoing convergence between precision sensing and connected building platforms, increasing pull-through for compact temperature sensors used in smart comfort ecosystems.
- June 2024: ABB launched the SIL2-certified NINVA TSP341-N non-invasive temperature sensor rated up to 550 degrees Celsius. Non-invasive measurement reduces installation complexity and shutdown requirements in chemical and oil and gas facilities, accelerating retrofit use cases where additional temperature points can be added without breaking process piping.


Temperature Sensors Market Report Scope and Research Methodology
Market Definition and Coverage
For this methodology, the temperature sensors market covers revenues from devices that measure temperature and convert it into a usable signal, across industrial, automotive, medical, aerospace and defense, and consumer uses, and across major regions.
Scope exclusions: We exclude bundled system integration and long term maintenance service revenues when they are not separately priced as temperature sensing hardware.
Segments Covered in This Report
- Type
- Wired
- Wireless
- Output
- Analog
- Digital
- Technology
- Contact Thermocouple
- Resistance Temperature Detector (RTD)
- Thermistor (NTC/PTC)
- Temperature IC
- Non-Contact Infrared
- Fiber-Optic
- End-User Industry
- Chemical and Petrochemical
- Oil and Gas
- Metals and Mining
- Power Generation
- Food and Beverage
- Automotive and E-Mobility
- Medical and Healthcare
- Aerospace and Defense
- Consumer Electronics and Wearables
- Other Industries
- By Geography
- North America
- United States
- Canada
- Mexico
- Europe
- United Kingdom
- Germany
- France
- Italy
- Rest of Europe
- Asia-Pacific
- China
- India
- Japan
- South Korea
- Australia
- Rest of Asia-Pacific
- South America
- Brazil
- Argentina
- Rest of South America
- Middle East
- United Arab Emirates
- Saudi Arabia
- Rest of Middle East
- Africa
- South Africa
- Nigeria
- Rest of Africa
- North America
Data Sources, Market Sizing, and Validation
Desk Research
Desk research was used to set the market frame and to anchor the model inputs that are visible in public data. We relied on sources such as the US Census Bureau and the US International Trade Commission trade statistics, Eurostat industrial and manufacturing indicators, IEA energy and power generation datasets, and NIST references for measurement standards and calibration context.
We also reviewed company filings, investor presentations, technical datasheets, and credible press coverage to understand product mixes like contact versus non-contact sensing and wired versus wireless adoption. Where needed, paid subscriptions for company financials and intelligence, patent databases, and shipment level import and export records were used to fill gaps on revenue splits and to check directionally whether volume trends matched the demand story. The sources listed above are illustrative only, and many other public and paid references were also used for data collection, validation, and clarification.
Primary Interviews and Surveys
Primary work focused on validating what is actually being bought and at what typical price points, because list prices and public shipments alone can be misleading. We spoke with sensor manufacturers, distributors, OEM engineering and sourcing teams, and large end users across APAC, EMEA, and the Americas to confirm adoption drivers, replacement cycles, and the share shift across sensor technologies.
To close data gaps, assumptions from desk research were challenged through repeated checks on mix (for example, thermocouple versus RTD versus thermistor and infrared) and on how temperature transmitters are counted in a bill of materials, and then the model was adjusted only when consensus signals were strong.
Distribution of primary research fieldwork respondents
| Company type | Respondent position | Region |
|---|---|---|
| Top tier: 37% | CXOs: 18% | APAC: 39% |
| Mid tier: 42% | Functional/Unit leaders: 22% | EMEA: 37% |
| Smaller Players: 21% | Managers: 60% | Americas: 24% |
Market-Sizing & Forecasting
Sizing started with a top-down build where industrial production and trade-linked electronics activity, and then end-use exposure, were used to reconstruct the demand pool by region. That total was then corroborated with selective bottom-up approximations, such as supplier revenue roll ups for temperature sensing lines, sampled ASP by type multiplied by estimated unit volumes, and distributor channel checks, which helped us correct for overcounting and undercounting.
The model was shaped using inputs that buyers and engineers recognize, including penetration of sensing in factory automation, EV and ICE vehicle build rates tied to thermal management content, medical device production trends, mix shifts across thermocouples, RTDs, thermistors, and infrared sensors, and the wired versus wireless split (which influences ASP and replacement patterns). In areas where reported splits were missing, we used conservative proxy shares backed by interviews, and we separated pure sensor value from adjacent instrumentation when it was sold as part of a larger package.
Forecasts were produced using scenario analysis supported by variable-level expectations gathered in primary discussions, followed by a smoothing step to avoid unrealistic jumps in unit volumes or ASPs. When conflicting signals appeared, the forecast was held closer to the demand indicators that could be independently observed, and only then adjusted to match credible supply-side constraints.
Data Validation & Update Cycle
Outputs were validated through triangulation across demand signals, supply-side revenue indications, and channel feedback, and then checked for year-on-year anomalies like sudden mix flips or pricing swings that did not align with manufacturing cycles. Before sign-off, the model went through a multi-step analyst review where assumptions were re-tested, and any large variance versus prior editions triggered follow-up calls.
The report is refreshed annually, and interim updates are made when material events occur, such as major regulatory shifts, sharp currency moves, or large end-market disruptions. Right before delivery, a final review pass is completed so clients receive the most current view consistent with the defined scope and inputs.
Mordor Intelligence's Temperature Sensors Market Market Estimate Compared With Other Published Estimates
Published market sizes for temperature sensors often differ, even when the topic name looks the same, because the scope lines are drawn differently and the pricing logic varies by source. Differences in whether the estimate is anchored to a device-level demand pool or to broader instrumentation revenues also tends to create visible spreads.
The main gap comes from whether temperature transmitters and adjacent measurement modules are counted as part of the sensor market, and then whether ASP progression is modeled from mix shifts or from headline inflation, which is where Mordor Intelligence counts transmitter revenue only when it is sold as part of temperature sensing hardware shipments and not as wider control instrumentation.
Benchmark comparison
| Source | Market Size | Gaps in Research Methodology |
|---|---|---|
| Mordor Intelligence | USD 9.93 B (2026) | |
| Global Consultancy A | USD 7.11 B (2024) | Uses an earlier base year and a different cut of the market that leans on broad sensor revenues, which can understate industrial transmitter and high-spec process sensor contribution when mix is shifting. |
| Industry Publisher B | USD 11.21 B (2032) | Extends the forecast further out and appears to apply a higher growth path tied to IoT adoption, which can inflate totals if wireless uptake and digital ASP increases are assumed faster than validated end-user replacement cycles. |
The comparison shows that year selection and what gets counted as a sensor versus adjacent instrumentation are the two biggest levers behind the spread. By keeping the inputs tied to observable end-market activity, and then stress-testing pricing and mix through interviews, the final number stays explainable and repeatable when the same steps are applied again.


Key Questions Answered in the Report
What is the current size of the temperature sensor market and how fast is it growing?
The market stands at USD 9.93 billion in 2026 and is forecast to reach USD 13.41 billion by 2031, advancing at a 6.2% CAGR.
Which region leads demand for temperature sensors?
Asia-Pacific holds 44.72% of global revenue and is also the fastest-growing region at a 7.05% CAGR through 2031.
Why are wireless temperature sensors gaining traction?
Brown-field factories and commercial buildings favor wireless nodes because they avoid costly cabling work; this segment is expanding at an 11.2% CAGR.
Which end-user industry shows the highest growth momentum?
Medical and healthcare applications are climbing at an 8.4% CAGR due to strict biologics cold-chain traceability and mRNA vaccine production needs.
Page last updated on:





