Electric Heat Tracing Market Size and Share
Market Overview
| Study Period | 2023 - 2030 |
|---|---|
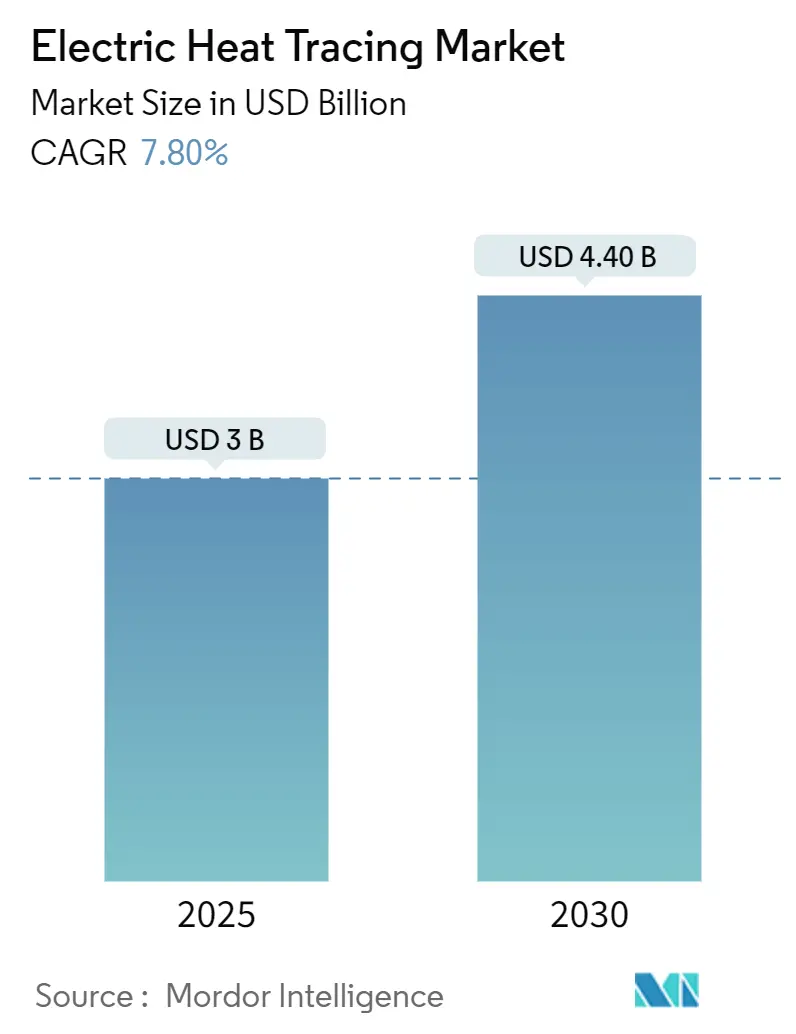
| Market Size (2025) | USD 3 Billion |
| Market Size (2030) | USD 4.40 Billion |
| Growth Rate (2025 - 2030) | 7.80% CAGR |
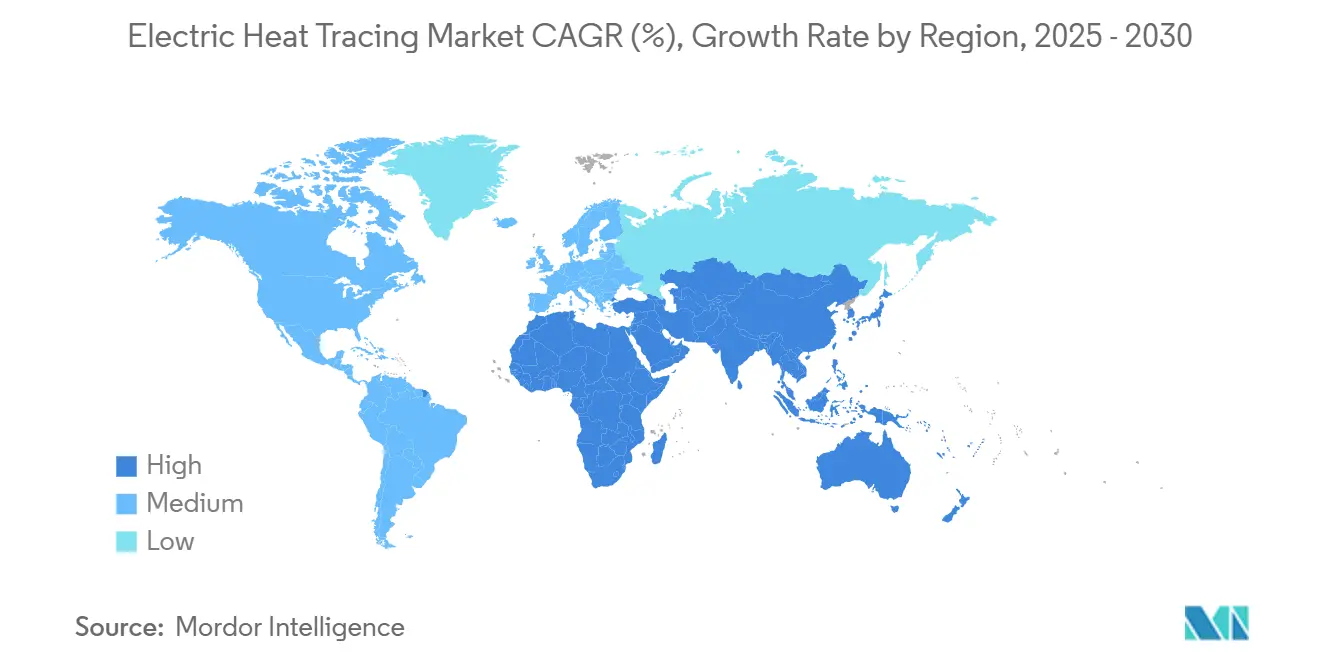
| Fastest Growing Market | Asia Pacific |
| Largest Market | North America |
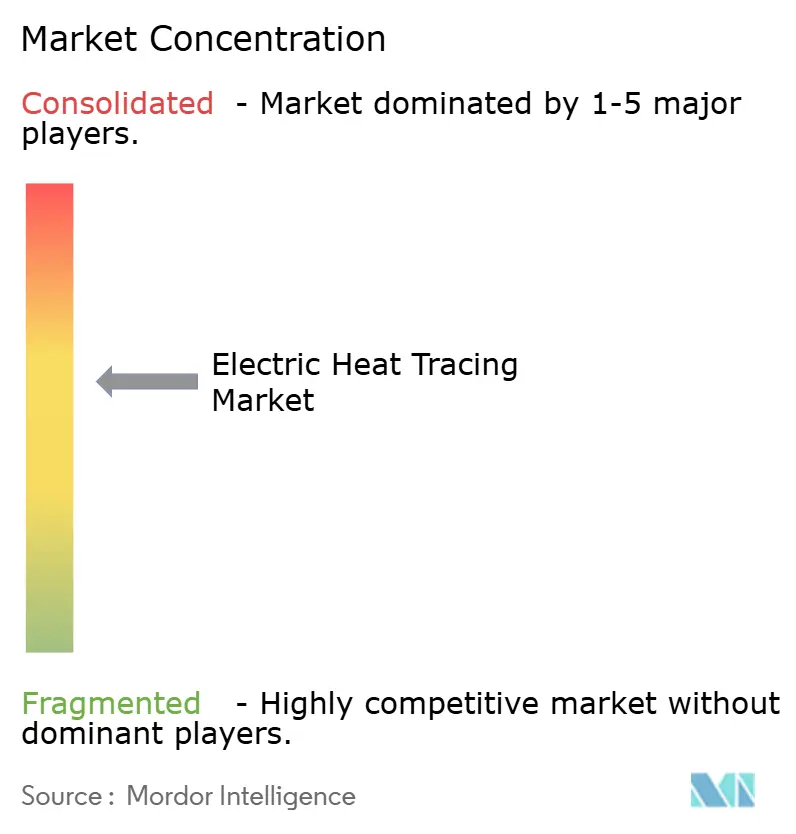
| Market Concentration | Medium |
Major Players *Disclaimer: Major Players sorted in no particular order Image © Mordor Intelligence. Reuse requires attribution under CC BY 4.0. | |
Electric Heat Tracing Market Analysis by Mordor Intelligence
The electric heat tracing market size stands at USD 3.0 billion in 2025 and is forecast to reach USD 4.4 billion by 2030, advancing at a 7.8% CAGR over the same period. This upward trajectory reflects sustained conversion from legacy steam systems to electrically driven thermal management, growing regulatory pressure for freeze protection, and momentum from the emerging hydrogen economy. Improving process uptime, combined with energy savings that can prevent more than USD 12,000 of annual waste for a single mid-size plant, underpins adoption across temperature-sensitive industries[1]Interstates Editorial Team, “Heat Trace Automation: What Does an Unplanned Outage Cost You?” Interstates, interstates.com. Consolidation remains a core theme as specialist thermal brands spin off from diversified conglomerates, fostering sharper R&D focus and faster go-to-market cycles. Digital control layers are transforming heat tracing from a commodity cable purchase into a data-rich, service-oriented solution, raising switching costs and reinforcing incumbent advantage. At the same time, Asia-Pacific’s LNG build-out, Europe’s hydrogen pipelines, and North America’s Arctic exploration collectively ensure robust project backlogs even when individual megaprojects slip.
Key Report Takeaways
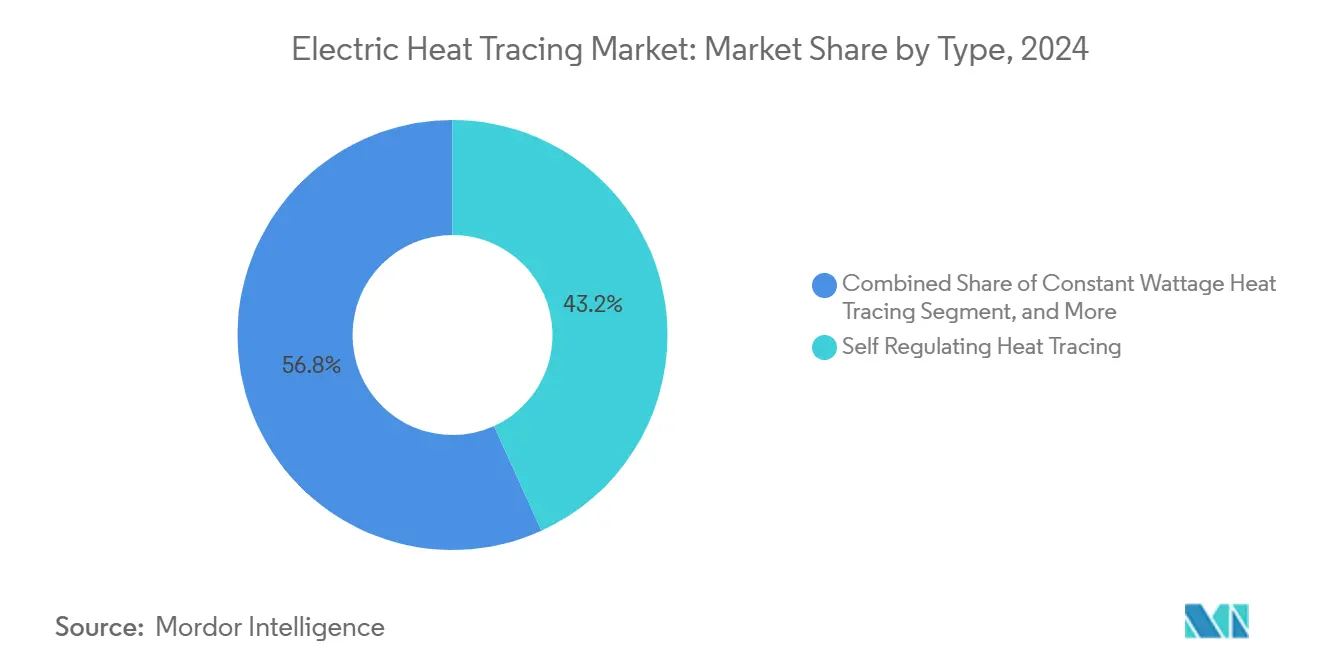
- By type, self-regulating cables held 43.2% of the electric heat tracing market share in 2024.
- By component, heating cables held 50.7% of the electric heat tracing market share in 2024.
- By temperature, high-temperature systems above 260 °C are set to expand at a 9.1% CAGR through 2030.
- By application, oil & gas accounted for 32.2% of the electric heat tracing market size in 2024, while pharmaceuticals will grow the fastest at 6.6% CAGR to 2030.
- By region, Asia-Pacific is projected to post a 9.3% CAGR between 2025-2030, whereas North America captured 32.5% revenue share in 2024.
Global Electric Heat Tracing Market Trends and Insights
Driver Imapct Analysis*
| DRIVER | (~) % IMPACT ON CAGR FORECAST | GEOGRAPHIC RELEVANCE | IMPACT TIMELINE |
|---|---|---|---|
| Rising adoption of self-regulating cables in LNG facilities | +1.2% | Asia-Pacific, Middle East | Medium term (2-4 years) |
| Growing offshore oil and gas exploration in the Arctic regions | +0.9% | North America, Europe | Long term (≥ 4 years) |
| Stringent freeze-protection mandates in chemical plants | +1.1% | North America, Europe | Short term (≤ 2 years) |
| Increasing electrification, replacing steam tracing | +1.4% | Developed markets | Medium term (2-4 years) |
| Expansion of hydrogen pipelines needs temperature control | +0.8% | Europe, Asia-Pacific | Long term (≥ 4 years) |
| Integration of IoT-based control and monitoring platforms | +0.7% | Global | Medium term (2-4 years) |
| Source: Mordor Intelligence | |||
Rising Adoption of Self-Regulating Cables in LNG Facilities
Self-regulating cable technology automatically modulates heat output in response to ambient changes, reducing overheating risk and cutting energy use by up to 30%.[2] Chromalox Technical Team, “What Is a Heat Trace System,” Chromalox, chromalox.com This feature is essential for cryogenic LNG arms that require precise pipe temperature during loading and unloading. The cables’ fluoropolymer jackets resist corrosive saltwater, extending asset life for offshore terminals. Their deployment directly influences safety ratings, which in turn drive insurance premiums and operating licenses. Because LNG capacity additions are concentrated in Asia-Pacific and the Middle East, vendors with marine-grade certifications are advantaged, reinforcing demand over the medium term.
Growing Offshore Oil and Gas Exploration in Arctic Regions
Sub-zero environments below -40 °C necessitate mineral-insulated cabling that can survive ice abrasion and severe thermal cycling.[3]BriskHeat Application Note, “Freeze Protection for Natural Gas Production Wells,” BriskHeat, briskheat.com Although installation costs can exceed USD 50,000 per kilometre, the risk of production freeze-offs justifies investment. Regulatory bodies increasingly require redundant heaters, effectively doubling system counts on new wellheads. The compressed six-month work window in many Arctic fields amplifies demand for turnkey packages and rapid-deployment crews, creating opportunity for suppliers that offer pre-terminated, pre-tested kits.
Stringent Freeze-Protection Mandates in Chemical Plants
Post-incident investigations have heightened scrutiny on freeze protection, compelling chemical producers to document performance metrics and embed heat tracing into safety-instrumented systems.[4]Egyptian PSM Steering Committee, “Hazardous Area Classification Guideline,” EGPC, psmegypt.com Facilities handling corrosive acids now specify nickel-rich alloys to mitigate simultaneous corrosion and freezing risks. Vendors able to bundle temperature controllers, sensors, and documentation within a single compliance-ready package gain share. Remote monitoring drills visibility into line temperatures, lowering the need for on-site rounds and aligning with labor-reduction targets.
Increasing Electrification Replacing Steam Tracing
Electric systems cut heating-related energy use up to 70% versus steam, while eliminating traps, condensate returns, and corrosion, thereby lowering maintenance budgets and greenhouse-gas emissions. Granular temperature control also enables pharmaceutical plants to maintain narrow process windows that steam lines cannot match. Policy incentives in Europe and Asia-Pacific reward steam-to-electric conversions, turning many replacements into payback-positive capital projects within three years.
Restraints Impact Analysis*
| RESTRAINTS | (~) % IMPACT ON CAGR FORECAST | GEOGRAPHIC RELEVANCE | IMPACT TIMELINE |
|---|---|---|---|
| Volatility in fluoropolymer and nickel-alloy prices | −0.8% | Global | Short term (≤ 2 years) |
| High installation cost for hazardous-area systems | −1.1% | Emerging markets | Medium term (2-4 years) |
| Scarcity of engineers skilled in complex circuit design | −0.6% | Developed markets | Long term (≥ 4 years) |
| Efficiency rules favoring insulation over heat tracing | −0.4% | Europe, North America | Medium term (2-4 years) |
| Source: Mordor Intelligence | |||
Volatility in Fluoropolymer and Nickel-Alloy Prices
Fluoropolymer resins have swung 15-25% over 12 months as environmental curbs limited plant output in key producer nations. Nickel-alloy cables track commodity cycles, complicating long-term project pricing. End users increasingly request fixed-price contracts, shifting risk to manufacturers, who respond with hedging or dual-source designs. Research into alternative jackets continues, yet no material currently matches the chemical resistance required for hydrochloric processes.
High Installation Cost for Hazardous-Area Systems
ATEX and IECEx certification demands explosion-proof glands, intrinsically safe controllers, and certified technicians, tripling installed cost versus non-hazardous zones. Engineering reviews can take months, delaying revenue. Smaller EPCs struggle to maintain certification, consolidating field work among a handful of regional leaders and limiting competitive bids.
*Our forecasts treat driver/restraint impacts as directional, not additive. The impact forecasts reflect baseline growth, mix effects, and variable interactions.
Segment Analysis
By Type: Self-Regulating Cables Drive Market Evolution
Self-regulating cables controlled 43.2% of the electric heat tracing market share in 2024, outpacing constant-wattage and mineral-insulated alternatives. Their semi-conductive polymer cores vary resistance with temperature, cutting energy use, and eliminating burn-out risk. The electric heat tracing market size tied to self-regulating designs is projected to grow at an 8.8% CAGR through 2030, propelled by LNG, pharmaceuticals, and food processing. Constant-wattage remains relevant where fixed heat density is mandatory, especially in chemical reactors. Mineral-insulated variants, although costlier, dominate ultra-high-temperature niches, leveraging stainless or Inconel sheaths for strength above 500 °C. Skin-effect lines, a narrow segment, appeal for pipelines spanning kilometres; their uniform heat is favoured by midstream operators who must guard against wax deposition.
Digital add-ons widen the performance gap. Embedded sensor wires inside newer self-regulating jackets feed cloud dashboards that flag hotspots before insulation is removed. Polymer advances now extend chemical resistance, inviting use in chlorine-alkali electrolysis and semiconductor-grade wet benches. Vendors capable of co-extruding multiple layers in a single pass reduce joint count, an important safety metric in hazardous areas.


By Component: Control Systems Emerge as Growth Driver
Heating cables accounted for 50.7% of the Electric Heat Tracing market share in 2024, underscoring their role as the primary revenue contributor. The component attracts buyers because self-regulating and constant-watt designs are easy to retrofit on existing pipework and require minimal civil work. This suitability for long pipeline runs in oil terminals, chemical plants, and district energy networks supports stable replacement demand. Product innovation that integrates fluoropolymer jackets with corrosion sensors keeps the value proposition strong for hazardous-area users. Regulatory codes that now require continuous temperature maintenance for freeze protection in critical utilities further amplify uptake among power producers and water treatment operators.
Ancillary parts are also evolving to complement the core cable offering. Control and monitoring systems captured only an 8.3% share of the Electric Heat Tracing market size in 2024, yet recent software upgrades that feed diagnostics into plant SCADA platforms are lifting inquiry volumes among EPC contractors. Segment specialists are partnering with PLC vendors to deliver pre-configured logic blocks that shorten commissioning cycles. Power-connection kits, splices, and terminators are benefiting from molded polymer housings that cut installation time by 20%, helping distributors push them as cost-effective maintenance stock. Other accessories such as sensors and warning labels maintain a niche but essential role, especially in multiphase flowlines where redundancy is critical.
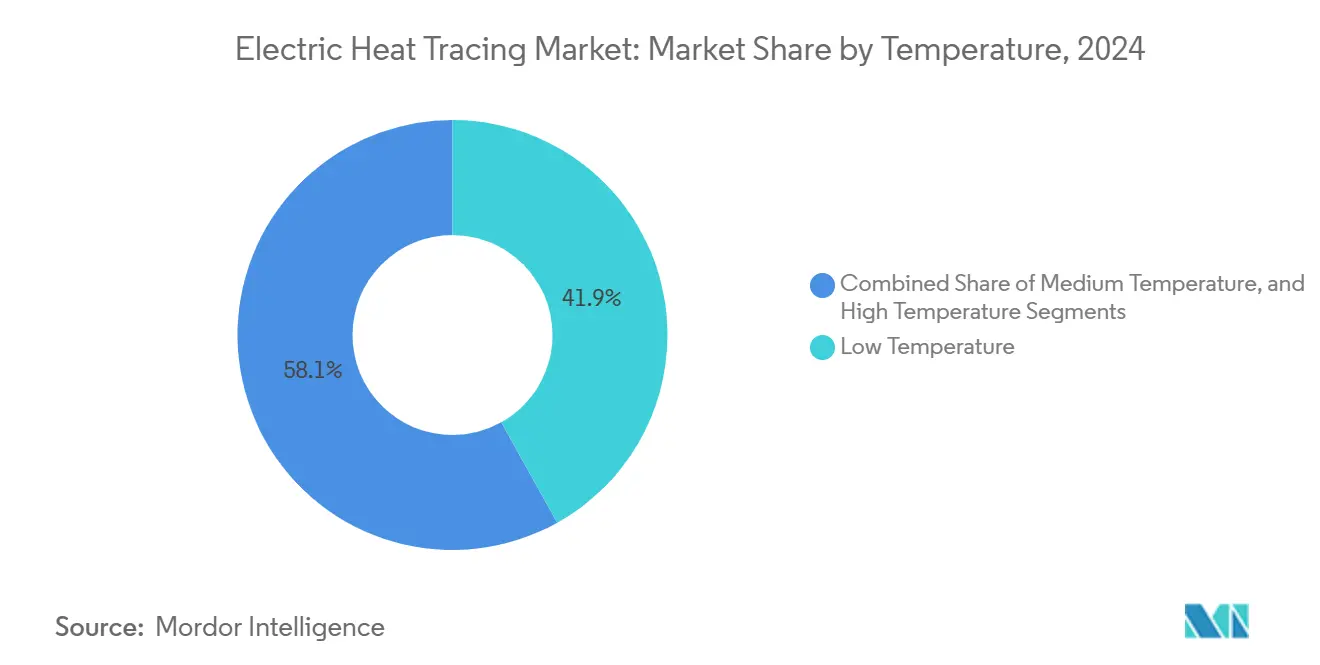
By Temperature: High-Temperature Applications Accelerate
Low-temperature solutions under 149 °C supplied 41.9% of the Electric Heat Tracing market share in 2024 and remain the first choice for frost protection and viscosity control in midstream tank farms. Their polymer insulation keeps heat loss minimal, allowing operators to abide by energy-efficiency targets without oversizing transformers. Industrial bakery and beverage processors rely on these circuits to maintain product consistency during transfer, creating steady day-to-day consumption. Insurance underwriters in colder regions have started to mandate pipe-freeze protection in new commercial buildings, expanding the technology’s opportunity outside heavy industry.
High-temperature lines above 260 °C contributed just 9.1% of 2024 revenue, but they safeguard critical sulfur recovery units and flare lines where process integrity outweighs cost. Demand is also poised to benefit from the ongoing shift to electric steam tracing replacements that eliminate hydrocarbon leakage risks. Medium-temperature ranges between 149 °C and 260 °C sit in the middle of the adoption curve, serving chemical reactors that require moderate viscosity control without the capital intensity of high-end alloys. Vendors are refining mineral-insulated technology to tolerate repeated thermal cycling, which supports uptake in batch specialty chemical plants that run variable campaigns.
By Application: Pharmaceuticals Lead Growth Transformation
The oil and gas sector generated 32.2% of 2024 revenue, keeping it the largest single application of Electric Heat Tracing market solutions. Flow-assurance programs for subsea tie-backs and onshore gathering systems rely on self-regulating cables to prevent hydrate formation, and producers treat these spends as non-discretionary safety outlays. Refiners continue to retrofit heat tracing on sulfur pit drains and jet-fuel lines to meet new low-temperature operability targets, locking in aftermarket revenue for service specialists. Offshore operators are beginning to specify polymer-jacketed heating elements that withstand high-pressure brine exposure, a specification trend manufacturers are eager to monetize.
Pharmaceutical plants held a modest 9.5% share in 2024 but now represent the fastest-growing customer group as biologics facilities proliferate. Clean-in-place cycles and water-for-injection loops need precise temperature maintenance to ensure sterility, which promotes the adoption of trace heating alongside high-accuracy digital controllers. Food and beverage processors follow closely, using tracing to stabilize chocolate, syrup, and edible oil viscosity without introducing direct contact heating that could trigger quality deviations. Power and energy utilities add steady project flow through freeze protection on flue-gas desulfurization lines and hydrogen pipelines tied to renewable energy storage pilots. Commercial buildings and residential retrofits remain smaller niches, yet state weatherization grants are encouraging homeowners in colder U.S. states to protect external water lines with low-wattage kits.
Geography Analysis
North America captured 32.5% of revenue in 2024, supported by shale, petrochemical, and Arctic production. End users prize high-reliability systems, translating into above-average ASPs and strong aftermarket service uptake. The electric heat tracing market share in Canada’s far-north drilling boasts the highest spend per kilometre, reflecting long winter campaigns. United States chemical hubs along the Gulf Coast invest heavily in self-regulating lines after a series of weather-related shutdowns.
Asia-Pacific delivers the fastest 9.30% CAGR to 2030 on the back of LNG import terminals, refinery expansions, and pharmaceutical capacity doubling. China’s carbon-neutral agenda accelerates steam replacement, while Japan subsidizes industrial electrification. India’s biologics boom underlies demand for high-precision heat maintenance in sterile corridors. Southeast Asia’s USD 100 billion deepwater gas build-out rewards suppliers with hazardous-area expertise, reinforcing the region’s outsized contribution to incremental demand.
Europe grows steadily as decarbonization mandates outlaw fossil-fired heat tracing for new builds. Hydrogen pipelines under Germany’s H₂Ready initiative require electric tracing to mitigate embrittlement, driving multi-kilometre orders. Norway and the United Kingdom invest in offshore wind service vessels that integrate heat-traced potable-water lines, opening a marine niche. Meanwhile, the ATEX framework shields incumbents by setting high certification hurdles, maintaining premium margins even amid macroeconomic uncertainty.

Competitive Landscape
The electric heat tracing market remains moderately concentrated, with technology breadth and certification depth forming the main entry barriers. Thermon, nVent’s former Raychem and Tracer labels (now under Brookfield ownership), Chromalox, and BARTEC anchor the top tier. Their portfolios span self-regulating to mineral-insulated ranges, often cross-sold with controllers and analytics software. Scale enables integrated project delivery, an advantage as EPCs in LNG and hydrogen seek single-source responsibility.
Strategic moves continue to reshape boundaries. nVent’s USD 1.7 billion divestiture tilts it toward high-growth enclosure and connection products, while freeing the thermal unit to chase specialized markets under Brookfield stewardship. Thermon’s EUR 12.5 million (USD 13.4 million) acquisition of F.A.T.I. deepens its presence in European process heaters and widens its Asian reach. IoT-centric differentiation intensifies as leaders embed edge analytics, while challengers partner with platform providers to close gaps. IEC 60800:2021 harmonization reduces approval cycles for heating cables up to 500 V, allowing mid-sized manufacturers to address multiple geographies with fewer SKUs.
Electric Heat Tracing Industry Leaders
Danfoss A/S
BARTEC GmbH
Emerson Electric Co.
Thermon Group Holdings Inc.
nVent Electric plc
- *Disclaimer: Major Players sorted in no particular order

Recent Industry Developments
- May 2025: Thermon reported record USD 134.1 million quarterly revenue and a 19% order uptick, lifting backlog to USD 240.3 million. The company highlighted decarbonization and data-center demand as strategic growth vectors, underscoring its shift from pure cable sales toward integrated electrification packages.
- April 2025: Pentair grew operating income 12% on strategic price actions despite flat sales, underscoring disciplined margin management. Its sustainable-water focus bundles electric heat tracing with fluid solutions, demonstrating cross-selling synergy after portfolio realignment.
- October 2024: Thermon acquired Italian heater maker F.A.T.I. for EUR 12 million in 2023 revenue, gaining European manufacturing and broadening its process heater lineup. The deal targets refinery and pharma customers seeking both cable and vessel heaters from one vendor.
- August 2024: nVent completed the sale of Raychem and Tracer to Brookfield for USD 1.7 billion, sharpening nVent’s focus on high-growth electrical connection niches while establishing a stand-alone thermal specialist with capital to pursue LNG and hydrogen megaprojects.


Global Electric Heat Tracing Market Report Scope
| Self-regulating Heat Tracing |
| Constant-Wattage Heat Tracing |
| Mineral-Insulated Heat Tracing |
| Skin-Effect Heat Tracing |
| Heating Cables |
| Control and Monitoring Systems |
| Power-Connection Kits |
| Splices and Terminators |
| Other Components |
| Low Temperature (<149 °C) |
| Medium Temperature (149–260 °C) |
| High Temperature (>260 °C) |
| Oil and Gas |
| Chemicals |
| Power and Energy |
| Food and Beverage |
| Pharmaceuticals |
| Water and Wastewater |
| Commercial Buildings |
| Residential |
| North America | United States | |
| Canada | ||
| Mexico | ||
| South America | Brazil | |
| Argentina | ||
| Rest of South America | ||
| Europe | Germany | |
| United Kingdom | ||
| France | ||
| Italy | ||
| Russia | ||
| Rest of Europe | ||
| Asia-Pacific | China | |
| Japan | ||
| India | ||
| South Korea | ||
| Australia | ||
| Rest of Asia-Pacific | ||
| Middle East and Africa | Middle East | Saudi Arabia |
| United Arab Emirates | ||
| Rest of Middle East | ||
| Africa | South Africa | |
| Egypt | ||
| Rest of Africa | ||
| By Type | Self-regulating Heat Tracing | ||
| Constant-Wattage Heat Tracing | |||
| Mineral-Insulated Heat Tracing | |||
| Skin-Effect Heat Tracing | |||
| By Component | Heating Cables | ||
| Control and Monitoring Systems | |||
| Power-Connection Kits | |||
| Splices and Terminators | |||
| Other Components | |||
| By Temperature | Low Temperature (<149 °C) | ||
| Medium Temperature (149–260 °C) | |||
| High Temperature (>260 °C) | |||
| By Application | Oil and Gas | ||
| Chemicals | |||
| Power and Energy | |||
| Food and Beverage | |||
| Pharmaceuticals | |||
| Water and Wastewater | |||
| Commercial Buildings | |||
| Residential | |||
| Segmentation by Geography | North America | United States | |
| Canada | |||
| Mexico | |||
| South America | Brazil | ||
| Argentina | |||
| Rest of South America | |||
| Europe | Germany | ||
| United Kingdom | |||
| France | |||
| Italy | |||
| Russia | |||
| Rest of Europe | |||
| Asia-Pacific | China | ||
| Japan | |||
| India | |||
| South Korea | |||
| Australia | |||
| Rest of Asia-Pacific | |||
| Middle East and Africa | Middle East | Saudi Arabia | |
| United Arab Emirates | |||
| Rest of Middle East | |||
| Africa | South Africa | ||
| Egypt | |||
| Rest of Africa | |||


Key Questions Answered in the Report
What is the current size of the electric heat tracing market?
The electric heat tracing market size is valued at USD 3.0 billion in 2025 and is projected to reach USD 4.4 billion by 2030.
Which cable type holds the largest share of the electric heat tracing market?
Self-regulating cables command 43.2% of 2024 revenue, leading all other technology categories.
Self-regulating cables command 43.2% of 2024 revenue, leading all other technology categories.
Pharmaceuticals are expected to post the highest application CAGR at 9.5% through 2030, driven by cold-chain and compliance needs.
Which region shows the strongest growth momentum?
Asia-Pacific is projected to record a 9.30% CAGR from 2025-2030, fueled by LNG investments and industrial electrification programs.
Page last updated on:


