
Thermal Management Technologies Market Size and Share
Market Overview
| Study Period | 2020 - 2031 |
|---|---|
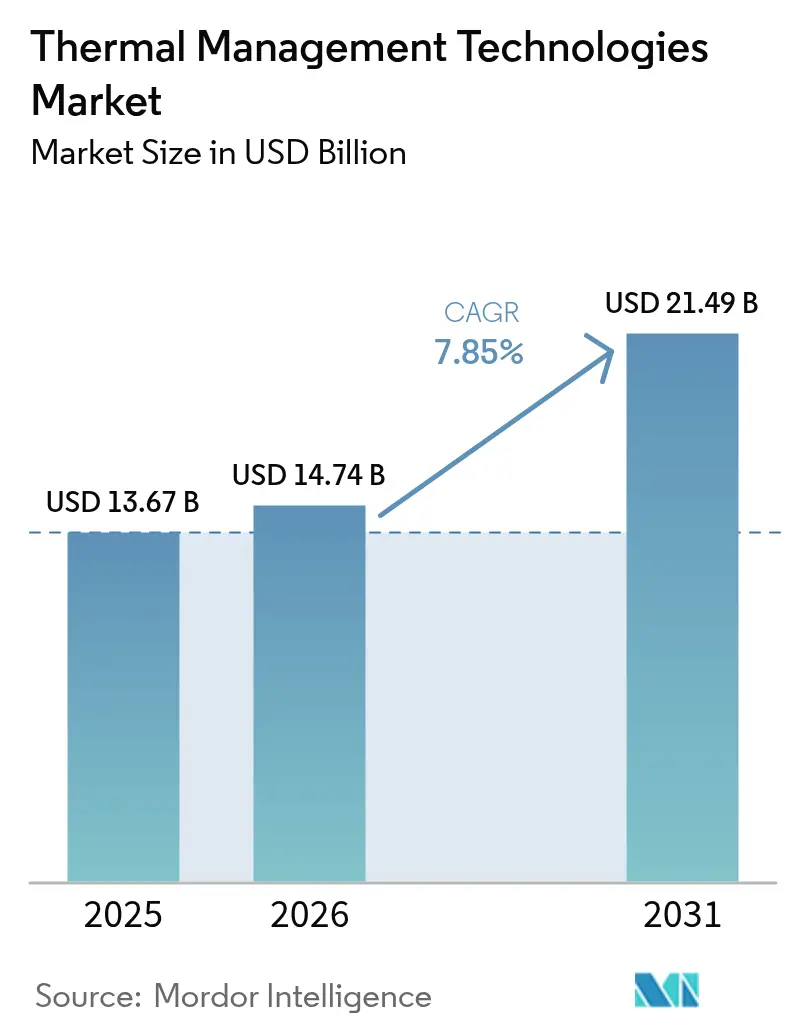
| Market Size (2026) | USD 14.74 Billion |
| Market Size (2031) | USD 21.49 Billion |
| Growth Rate (2026 - 2031) | 7.85 % |
| Fastest Growing Market | Asia Pacific |
| Largest Market | North America |
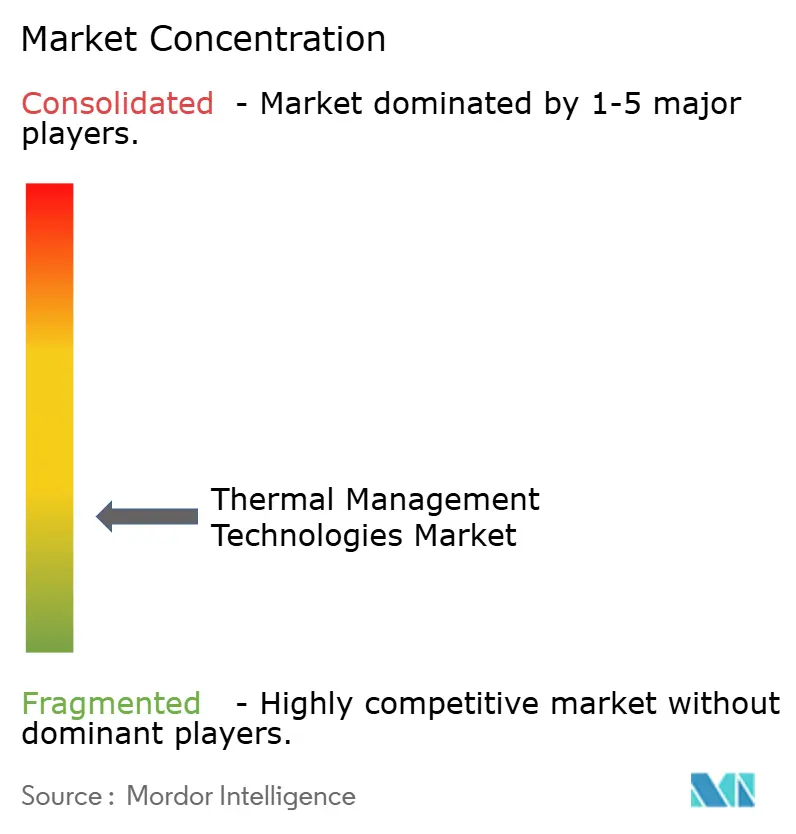
| Market Concentration | Low |
Major Players *Disclaimer: Major Players sorted in no particular order Image © Mordor Intelligence. Reuse requires attribution under CC BY 4.0. | |
Thermal Management Technologies Market Analysis by Mordor Intelligence
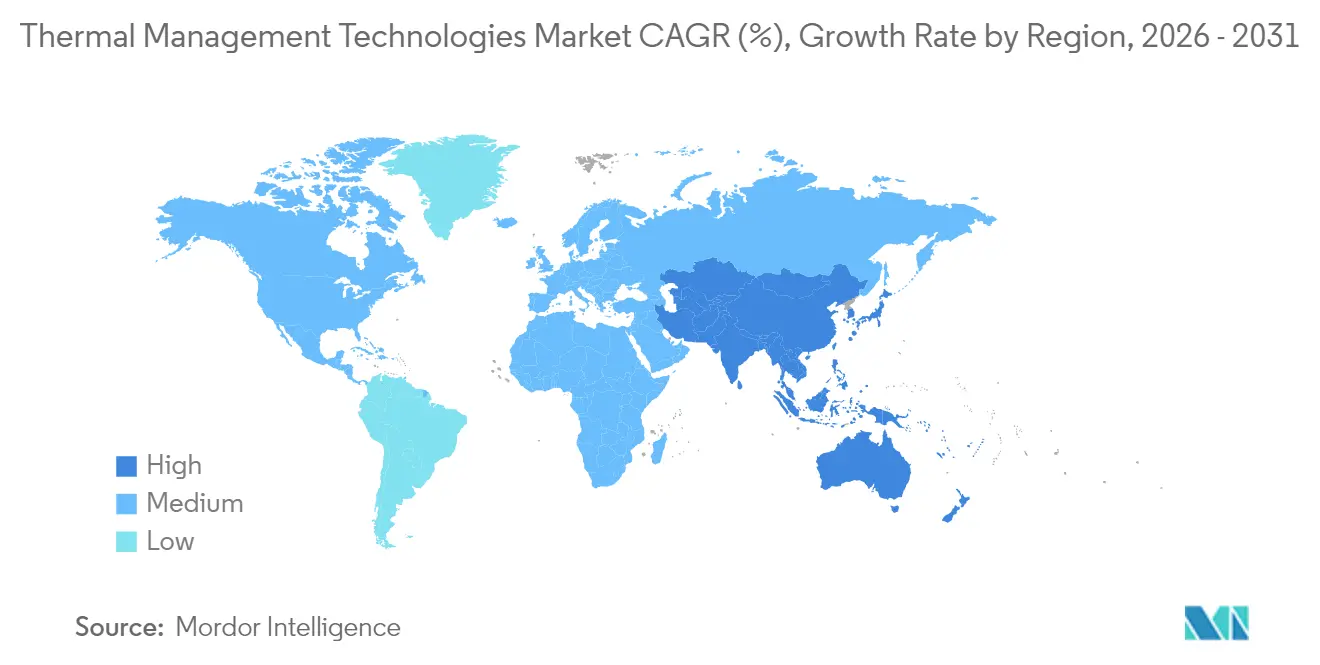
The thermal management technologies market size was valued at USD 13.67 billion in 2025 and estimated to grow from USD 14.74 billion in 2026 to reach USD 21.49 billion by 2031, at a CAGR of 7.85% during the forecast period (2026-2031). Strong demand for data-center efficiency, electrified transportation, and miniaturized consumer electronics underpins spending on advanced cooling architectures that actively regulate temperature instead of merely dissipating heat. Air cooling keeps a 47.62% revenue lead, yet two-phase systems are closing the gap as hyperscale operators seek sub-ambient performance ceilings.[1]Microsoft Research, “Microfluidics-Based Cooling Systems,” microsoft.com Software-defined control layers, supported by real-time sensors and predictive analytics, are emerging as differentiators that squeeze more performance per watt from existing hardware. Materials science progress is equally pivotal: graphite composites, phase-change media, and graphene-enhanced interfaces are redefining how fast and how far heat can be moved inside shrinking form factors. Regionally, North America leverages its hyperscale build-out and EV momentum to command 39.89% of 2024 revenue, while Asia-Pacific is on track for the fastest 8.84% CAGR thanks to dense electronics manufacturing clusters and accelerating EV output.
Key Report Takeaways
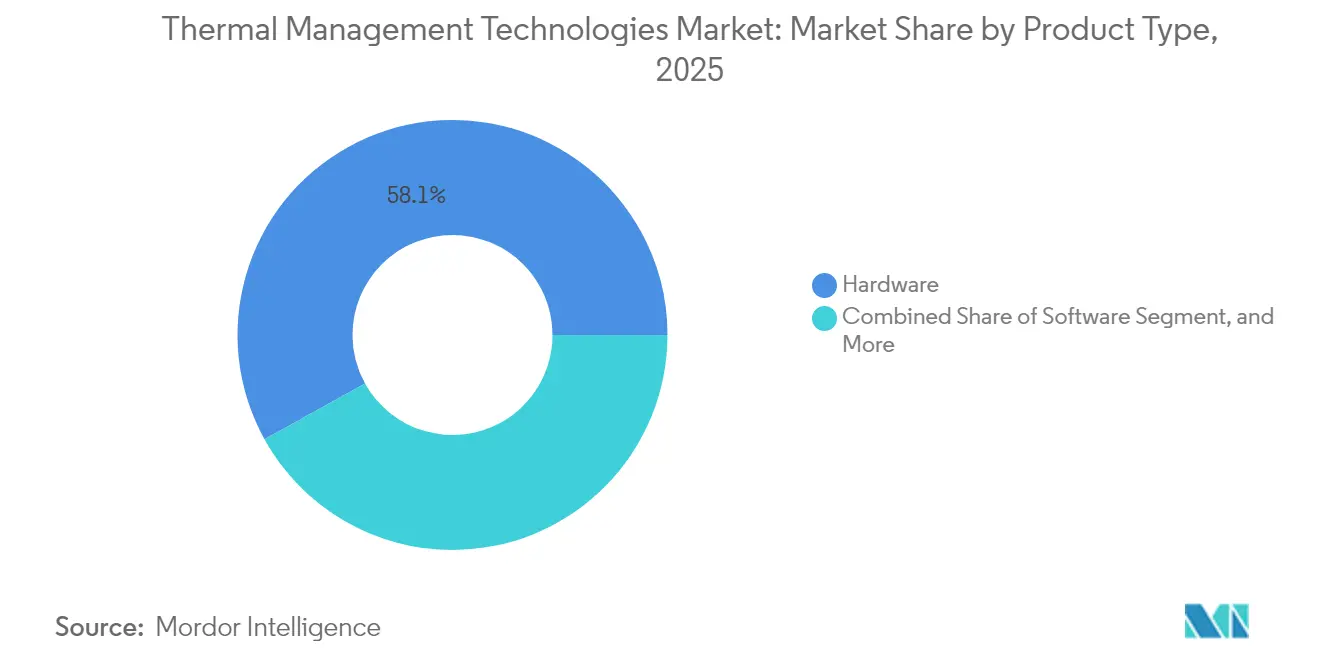
- By product type, hardware captured 58.05% of thermal management technologies market share in 2025; software solutions are projected to expand at a 9.05% CAGR through 2031.
- By cooling technology, air systems held 47.10% share of the thermal management technologies market size in 2025, while two-phase designs are advancing at a 8.86% CAGR through 2031.
- By material, metal-based (Al, Cu) accounted for 41.55% share in 2025 in the thermal management technologies market; graphite composites are forecast to grow at an 8.75% CAGR over the same horizon.
- By end-use, computers and data centers generated 28.10% revenue in 2025 in the thermal management technologies market, whereas automotive and EV applications are charting an 8.62% CAGR through 2031.
- By geography, North America led with 39.35% share in 2025 in the thermal management technologies market, and Asia-Pacific is on course for the highest 8.58% CAGR up to 2031.
Note: Market size and forecast figures in this report are generated using Mordor Intelligence’s proprietary estimation framework, updated with the latest available data and insights as of 2026.
Market Trends and Insights
Drivers Impact Analysis of Thermal Management Technologies Market*
| Driver | (~) % Impact on CAGR Forecast | Geographic Relevance | Impact Timeline |
|---|---|---|---|
| Growing demand for high-performance computing devices | +1.8% | Global, concentrated in North America and Asia-Pacific | Medium term (2-4 years) |
| Surging adoption of EV battery thermal management | +2.1% | Global, led by China, Europe, North America | Medium term (2-4 years) |
| Miniaturization of electronics increasing heat flux | +1.5% | Asia -Pacific manufacturing hubs, global consumer markets | Short term (≤ 2 years) |
| 5G rollout driving advanced thermal solutions | +1.2% | Asia-Pacific, North America, Europe | Short term (≤ 2 years) |
| AI data-center sustainability push toward liquid cooling | +1.4% | North America, Europe, select Asia-Pacific markets | Medium term (2-4 years) |
| Emerging thermal needs of solid-state batteries | +0.9% | Early adoption in Japan, Korea, expanding globally | Long term (≥ 4 years) |
| Source: Mordor Intelligence | |||
Growing Demand for High-Performance Computing Devices
Processors aimed at AI and graphics workloads now post thermal design power numbers above 400 W, overwhelming legacy air fins and pushing operators toward liquid loops that deliver higher convective coefficients. Denser transistor stacking, on-chip accelerators, and edge boxes packed into fan-less enclosures intensify the hunt for software-defined cooling that modulates flow rates on the fly. Quantum systems raise the bar further by requiring sub-Kelvin environments that blur lines between IT and cryogenics. Regulatory energy caps give CIOs a financial incentive to adopt predictive thermal orchestration that balances power draw against uptime. Together these factors lift the thermal management technologies market by expanding both the unit count of cooling subsystems and the bill of materials per rack.
Surging Adoption of EV Battery Thermal Management
Liquid loops threaded through prismatic and cylindrical cells keep pack temperatures inside the narrow 15–35 °C window that maximizes capacity retention while averting thermal runaway. Solid-state chemistries change heat generation profiles, forcing OEMs to rethink plate geometries and coolant viscosities. Embedded algorithms now parse driving style, ambient weather, and fast-charge currents to pre-empt hotspots, extending warranty cycles. Immersion solutions, once confined to servers, are being prototyped for track-oriented EVs seeking lighter plumbing. Each new platform pushes the thermal management technologies market deeper into automotive design cycles, turning battery cooling from a commodity into a core differentiator.
Miniaturization of Electronics Increasing Heat Flux
Flagship smartphones can hit heat flux densities above 10 W/cm² during gaming or generative AI tasks, exceeding what graphite sheets and vapor chambers alone can move.[2]xMEMS, “Piezo Micro-Cooling,” xmems.com Piezoelectric micro-blowers and 3D vapor channels unlock active airflow in enclosures thinner than 3 mm, a feat impossible for rotary fans. Flexible graphene interfaces slice interlayer resistance, stabilizing frame temperatures without bulky heat-spreaders. Designers supplement these advances with phase-change films that soak surplus joules during short spikes. Resulting gains in sustained performance feed demand for next-generation devices, expanding addressable revenue for the thermal management technologies market.
5G Rollout Driving Advanced Thermal Solutions
Macro and small-cell radios consume 3–4 times the power of 4G counterparts because of massive MIMO arrays and edge compute blades housed in the same cabinet.[3]Nokia, “5G Thermal Solutions,” nokia.com Outdoor units must shed heat under scorching roofs or sub-zero winds yet still meet telco uptime promises. Liquid cold plates are infiltrating the radio access network, trimming operational energy by double-digit percentages while keeping amplifiers within tight temperature windows. Urban densification multiplies node counts, and each node carries a thermal budget that ripples through the supply chain. The knock-on effect is steady volume growth for the thermal management technologies market tied directly to telecom capital expenditure.
Restraints Impact Analysis of Thermal Management Technologies Market*
| Restraint | (~) % Impact on CAGR Forecast | Geographic Relevance | Impact Timeline |
|---|---|---|---|
| Reliability concerns over two-phase immersion fluids | -0.8% | Global data center markets, concentrated in developed regions | Short term (≤ 2 years) |
| High cost of advanced PCMs and graphite composites | -1.1% | Cost-sensitive applications globally, emerging markets | Medium term (2-4 years) |
| Regulatory uncertainty around PFAS-based TIMs | -0.6% | North America, Europe, with spillover to Asia-Pacific | Medium term (2-4 years) |
| Design complexity in ultra-slim devices | -0.4% | Global consumer electronics, concentrated in Asia-Pacific manufacturing | Short term (≤ 2 years) |
| Source: Mordor Intelligence | |||
Reliability Concerns Over Two-Phase Immersion Fluids
Operators remain wary of chemical degradation and particulate contamination in dielectric baths that circulate around mission-critical boards.[4]3M, “Dielectric Fluids for Immersion Cooling,” 3m.com Replacement cycles and fluid conditioning equipment drive operating expenses higher than anticipated. Insurance underwriters and warranty providers have yet to publish definitive failure-rate data, contributing to a cautious stance among Fortune-500 IT teams. Environmental regulations on disposal add another layer of complexity, slowing mainstream adoption and trimming near-term growth for the thermal management technologies market.
High Cost of Advanced PCMs and Graphite Composites
Graphite composites retail at up to five times the price of machined aluminum parts, while high-density phase-change pellets demand tight process controls that push capex beyond many consumer-electronics budgets. Certification loops for aerospace and medical equipment lengthen payback periods. Supply chain concentration in a handful of regions introduces price volatility, nudging procurement teams back to incumbent metals. As a result, the thermal management technologies industry absorbs a measured drag that offsets some of the upside supplied by fast-growing segments.
*Our forecasts treat driver/restraint impacts as directional, not additive. The impact forecasts reflect baseline growth, mix effects, and variable interactions.
Thermal Management Technologies Market Segment Analysis
By Product Type:
Software Intelligence Amplifies Legacy HardwareHardware still underpins the thermal management technologies market with 58.05% revenue in 2025, spanning heat sinks, vapor chambers, liquid blocks, and interface pads. Yet the 9.05% CAGR logged by software orchestration layers signals a pivot toward data-driven optimization that ekes out more capacity from installed cooling assets. AI-based firmware now learns thermal signatures and pre-emptively tunes pump speed or fan rpm, slashing power draw and noise. At scale, these functions widen margins for OEMs and reduce total cost of ownership for end users, reinforcing the adoption loop that enlarges the thermal management technologies market.
Start-ups are integrating machine-vision sensors that map hotspot migration in real time, feeding neural nets that adjust airflow vectors within milliseconds. Interface materials are likewise evolving, with graphene-doped pastes outclassing legacy greases by an order of magnitude in conductivity. The interplay between smarter code and better surfaces yields compound gains: lower junction temperatures boost reliability metrics, permitting tighter design envelopes and lighter thermal envelopes. Each increment rolls up to expand thermal management technologies market size across consumer devices, EV packs, and industrial automation cells.



By Cooling Technology:
Two-Phase Gains but Air Holds VolumeAir-based assemblies delivered 47.10% of 2025 turnover, buoyed by universal compatibility and low upfront cost. Even so, two-phase solutions, spanning vapor chambers, heat pipes, and immersion frames, are on pace for a 8.86% CAGR to 2031, stealing share from legacy rack coolers in megawatt-class data halls. Direct-to-chip plates cut fluid path length and raise heat-flux thresholds, shrinking total rack footprint. For premium workstations and edge AI boxes, hybrid loops toggle between air and liquid modes based on workload intensity, ensuring thermal compliance without oversizing fans.
Immersion baths promise the steepest thermal gradient, yet capex and perceived risk still limit deployment beyond test labs. Meanwhile, thermoelectric modules find niche adoption where pinpoint temperature control outweighs efficiency penalties, such as lidar calibration units and sat-com phased arrays. Collectively, the widening palette of options lets designers right-size systems, reinforcing the growth arc of the thermal management technologies market.
By Material:
Carbon-Rich Formulations Challenge MetalsAluminum and copper together secured 41.55% of the 2025 pie thanks to entrenched supply chains and attractive price-performance economics. That comfort zone narrows as graphite composites, registering an 8.75% CAGR, match or exceed 1000 W/m·K conductivities at roughly one-third the weight. Phase-change slurries supplement rigid parts by storing bursts of heat, extending safe-operating windows without mechanical intervention. Ceramics step in where electrical isolation or corrosion resistance is mandatory, particularly in high-voltage EV inverters.
Cost remains the principal hurdle, but unit economics improve as automotive volumes swell. OEM appetite for lightweight, crash-worthy battery enclosures accelerates the shift, with each gigafactory ramping orders that enlarge thermal management technologies market share for graphite composites. Parallel R&D in nano-enhanced polymers targets flex circuits and wearable devices, marking another frontier where carbon beats metal on specific strength and thermal reach.

By End-Use Industry:
Mobility Electrification Drives Next WaveComputing infrastructure absorbed 28.10% of 2025 sales, yet growth is tilting toward mobility where unified motor-inverter-battery assemblies stack multiple heat sources in tight chassis spaces. Automotive and EV revenue is climbing at 8.62% CAGR as solid-state prototypes raise thermal stakes and over-the-air updates lengthen vehicle service life. Consumer electronics holds steady demand for wafer-thin vapor spreaders, but margin incentives favor vendors that can translate know-how from datacenters to dashboard CPUs.
Telecom base-stations present a parallel path: 5G rollouts need silent, vibration-free cooling to guarantee link stability. Renewable energy converters, mainly string inverters and battery storage racks, open another flank, counting on sealed liquid loops that endure dusty remote sites. Taken together, these vectors secure a diverse demand foundation that future-proofs the thermal management technologies market against cyclicality in any single vertical.
Geography Analysis
North America Thermal Management Technologies Market
North America booked 39.35% of global receipts in 2025, powered by hyperscale build-outs from cloud giants and generous EV incentives that bankroll next-generation battery cooling projects. A dense network of semiconductor fabs and research labs shortens the feedback loop between discovery and commercial rollout, keeping the region ahead on patents and pilot lines. Policymaker emphasis on energy independence and data-sovereignty strengthens investment in liquid-based datacenter retrofits, anchoring base demand for the thermal management technologies market.
APAC Thermal Management Technologies Market
Asia-Pacific, however, supplies the fastest 8.58% CAGR to 2031 as China, South Korea, and Taiwan integrate advanced cooling directly on the assembly line, eliminating aftermarket retrofits. Battery-gigafactory construction across coastal China pulls in kilometers of coolant channels and megatons of graphite sheets, while handset OEMs in Shenzhen and Seoul refine micro-blower adoption for AI-enhanced flagship phones. Parallel 5G densification adds thousands of radio units, each with bespoke cold plates, lifting regional volumes for the thermal management technologies market.
Europe Thermal Management Technologies Market
Europe balances mature automotive supply chains with aggressive carbon-reduction statutes that encourage high-efficiency thermal hardware in EV drivetrains and industrial motors. The continent’s aerospace and defense ecosystems specify ceramic and thermoelectric kits for high-altitude drones and satellite avionics, adding high-margin niches. Emerging data-center clusters in the Nordics run colder ambient air, yet still require smart controls to capitalize on free-cooling without risking condensation. These dynamics cement a steady, regulation-driven role for Europe within the global thermal management technologies market.

Regulatory Landscape
Thermal management technology design is increasingly shaped by energy-efficiency and refrigerant-transition rules that affect fans, chillers, and data center mechanical systems. In the European Union, ErP fan requirements under Regulation (EU) 2024/1834 set performance and information obligations with staged compliance extending through 2028, tightening the selection of high-efficiency fans used across IT cooling, telecom enclosures, and HVAC subsystems that support liquid loops.
In 2026, several policy moves added compliance complexity across geographies and end uses. The U.S. EPA Technology Transitions Program under the AIM Act advanced HFC phase-down requirements, with mandatory annual reporting deadlines starting March 31, 2026, influencing refrigerant choices for cooling infrastructure. In California, the Energy Commission Title 24 2025 Energy Code became effective January 1, 2026 and ties certain data center projects to ASHRAE 90.4 compliance, reinforcing metering, modeling, and performance-driven cooling design. China also expanded export-facing requirements, including WM/T 13-2025 for exported room air conditioners (effective January 1, 2026) and MIITs 2026-2028 plan for energy-saving equipment (effective April 1, 2026), raising documentation and efficiency alignment requirements for thermal-related equipment in cross-border supply chains. The EU also adopted Commission Implementing Regulation (EU) 2026/286 on February 10, 2026, providing temporary fluorinated-gas exemptions for certain semiconductor-manufacturing chiller uses, highlighting the need for application-specific compliance strategies in high-tech facilities.
Value Chain Analysis
The value chain spans upstream materials and working fluids (aluminum and copper, graphite composites, ceramics, phase-change media, and dielectric fluids), midstream component manufacturing (heat sinks, vapor chambers, cold plates, CDUs, pumps, valves, sensors, and control electronics), and downstream integration into IT racks, EV battery packs, telecom radios, and industrial equipment. System differentiation is shifting toward software and controls, where orchestration layers tune flow, fan curves, and heat-exchanger operation using real-time sensing, which increases the role of firmware, analytics, and validation services alongside traditional thermal hardware.
Recent ecosystem moves show the chain being reconfigured around liquid and two-phase cooling for high-density compute. Chemours ran a full-scale Opteon 2P50 two-phase immersion fluid trial with NTT DATA and Hibiya Engineering (March 2025), then expanded supply readiness through a manufacturing agreement with Navin Fluorine International Limited that supports added capacity beginning in 2026 (May 2025). On the integration side, LG Electronics signed an MoU with SK Enmove and Green Revolution Cooling to advance liquid immersion cooling for AI data centers (October 2025), and Flex partnered with LG to co-develop modular cooling solutions, including CDUs and chillers, for gigawatt-class data centers (November 2025). These collaborations address bottlenecks around specialized subsystems, notably CDUs and compatible fluids, and support repeatable designs that can be deployed across new builds and retrofits.
Competitive Landscape
Global supply is moderately consolidated, with diversified conglomerates such as Honeywell and Parker-Hannifin sharing the stage with agile innovators like Frore Systems and xMEMS. Legacy players capitalize on bulk purchasing of aluminum billets and global service crews, whereas newcomers exploit patents around solid-state airflow and piezoelectric fans to win sockets that demand millimeter-scale profiles. Microsoft’s microfluidic research further blurs boundaries between OEM and end user, signaling an era in which hyperscalers design bespoke coolers to fit proprietary silicon.
Partnerships dominate go-to-market strategies. Hyundai Mobis collaborates with battery makers to co-develop heat pipes tuned for 800-V packs, cutting validation timelines. Boyd Corporation and 3M marry interface materials with immersion fluids, bundling consumables and hardware under unified service contracts. Acquisition activity remains brisk as Tier-1 automotive suppliers snap up niche PCB-cooling firms to secure in-house expertise ahead of 2030 fleet mandates. The result is a dynamic equilibrium in which no single vendor exceeds one-third share, positioning the thermal management technologies market at a middle-level concentration.
Thermal Management Technologies Industry Leaders
Honeywell International Inc.
Gentherm Incorporated
Autoneum Holding AG
Parker-Hannifin Corporation
Advanced Cooling Technologies, Inc.
- *Disclaimer: Major Players sorted in no particular order
Thermal Management Technologies Market Companies Covered in this Report
- Parker-Hannifin Corporation
- Advanced Cooling Technologies, Inc.
- Honeywell International Inc.
- Gentherm Incorporated
- Autoneum Holding AG
- Hydro Extruded Solutions AS (formerly Sapa Extrusions Inc.)
- AllCell Technologies LLC
- Thermacore, Inc.
- Laird Thermal Systems Ltd.
- Pentair plc
- Outlast Technologies LLC
- Boyd Corporation
- Celsia Inc.
- Aavid Thermalloy LLC
- Furukawa Electric Co., Ltd.
- Henkel AG and Co. KGaA
- Rogers Corporation
- 3M Company
- Panasonic Holdings Corporation
- Dow Inc.
- TTM Technologies, Inc.
- CoolIT Systems Inc.
- Delta Electronics, Inc.
- Noctua GmbH
- Sunonwealth Electric Machine Industry Co., Ltd.

Market Opportunities and Future Outlook
A whitespace is forming around retrofit-friendly liquid cooling and standardizable facility thermal architectures as AI compute pushes power density beyond what traditional air cooling can manage in many deployments. Google Cloud introduced Brazos in June 2026, a rack-mounted liquid-to-air system designed to bring high-density liquid-cooled equipment into legacy air-cooled data centers, creating an upgrade path for adding liquid-cooled racks without rebuilding entire sites. Johnson Controls published Reference Design Guide 401 in May 2026, outlining thermal architecture approaches for large compute clusters, including mixed air-liquid strategies and warm-water loops, which supports faster replication of proven designs across multi-site programs.
Opportunities are also emerging around warm-water and water-conserving heat-rejection strategies, plus advanced cold plate and on-chip microchannel geometries that reduce pumping power and improve heat-flux handling. NVIDIA detailed a 45C liquid-cooling architecture in June 2026 for its Rubin platform positioning, enabling broader use of dry coolers and reducing dependence on evaporative cooling in many climates, which shifts design targets for heat exchangers, controls, and coolant loops. Manufacturing innovations, including electrochemical additive manufacturing of copper cold plates (reported in 2026 work with Fabric8Labs and university researchers) and research progress on embedded microchannels in silicon chips, expand the addressable space for high-performance cold plates, microfluidic modules, and next-generation interface materials, particularly for data centers, advanced telecom edge nodes, and electrified mobility power electronics.
Recent Industry Developments in Thermal Management Technologies Market
- June 2026: Google Cloud introduced Brazos, a rack-mounted liquid-to-air cooling system designed to deploy high-density, liquid-cooled equipment into legacy air-cooled data center environments. The approach targets upgrade paths where operators need liquid cooling at the rack without rebuilding facility infrastructure. It increases demand for compatible CDUs, cold plates, and controls that integrate with mixed air-liquid rooms.
- October 2025: LG Electronics signed an MoU with SK Enmove and Green Revolution Cooling to advance liquid immersion cooling solutions for AI data centers. The collaboration aligns fluid know-how and immersion platform expertise to accelerate commercialization and deployment readiness. It also reinforces ecosystem-driven procurement, where operators favor validated stacks of fluids, tanks, filtration, and service support.
- December 2024: xMEMS launched the XMC-2400 piezo micro-blower aimed at enabling active airflow inside ultra-thin devices around 3 mm. The product broadens the thermal toolkit for compact consumer electronics facing higher heat flux from on-device AI workloads. It also pressures incumbent rotary fan and passive heat-spreader designs by offering an alternative path to sustained performance in constrained form factors.


Thermal Management Technologies Market Report Scope and Research Methodology
Market Definition and Coverage
This market covers technologies and solutions used to remove, spread, or control heat so electronic and electro-mechanical systems can run safely and reliably. It includes thermal management hardware, substrates and interface materials, and software used to monitor and optimize temperature behavior.
Scope exclusions: The sizing excludes general insulation and non-thermal control products that are not designed mainly for active temperature management.
Segments Covered in This Report
- By Product Type
- Software
- Hardware
- Substrate
- Interface
- By Cooling Technology
- Air Cooling
- Liquid Cooling
- Two-Phase Cooling
- Hybrid Cooling
- Thermoelectric Cooling
- By Material
- Metal-Based (Al, Cu)
- Non-Metal (Ceramic, Graphite, Polymer)
- Phase-Change Materials
- Composites
- By End-Use Industry
- Computers and Data Centers
- Consumer Electronics
- Automotive and EVs
- Telecommunications
- Renewable Energy
- Aerospace and Defense
- Industrial Equipment
- Other End-User Industries
- By Geography
- North America
- South America
- Europe
- Asia Pacific
- Middle East and Africa
Data Sources, Market Sizing, and Validation
Desk Research
Desk research was used to set market boundaries, build the early demand map, and collect base indicators to keep the model anchored. We referenced public sources such as US Energy Information Administration energy and electricity data, International Energy Agency demand outlooks, US International Trade Commission trade statistics, and US Patent and Trademark Office patent publications to track technology direction and adoption speed.
Company filings, investor presentations, and press coverage were then used to translate these signals into practical assumptions, including how cooling architectures are changing in electronics, vehicles, and telecom equipment. Where available, paid database subscriptions were used only for company financials and intelligence, patent lookups at scale, and import-export shipment level checks. The sources listed here are illustrative, and we also consulted other public references for data collection, clarification, and cross-checking.
Primary Interviews and Surveys
Primary work focused on validating what is actually being bought and deployed, and how pricing and technology mix are shifting by end use. We spoke with a mix of material suppliers, thermal solution providers, integrators, and demand-side teams, then pressure-tested inputs across APAC, EMEA, and the Americas so regional adoption patterns were not over-generalized.
Distribution of primary research fieldwork respondents
| Company type | Respondent position | Region |
|---|---|---|
| Top tier: 31% | CXOs: 17% | APAC: 49% |
| Mid tier: 51% | Functional/Unit leaders: 26% | EMEA: 30% |
| Smaller Players: 18% | Managers: 57% | Americas: 21% |
Market-Sizing & Forecasting
Our sizing logic starts with a top-down build that reconstructs the demand pool using end-use activity and equipment proliferation, then converts that activity into thermal solution spend. In practice, the model links electronics output and shipment trends, EV and conventional vehicle electronics content, data center and telecom network expansion, and renewable power electronics deployment into an addressable thermal load that needs management.
To keep the totals realistic, results are corroborated with selective bottom-up approximations, such as sampled supplier revenue splits by thermal product category, channel checks on mix shifts between air, liquid, and two-phase solutions, and spot checks using average selling price ranges multiplied by unit volumes for common use cases. Key inputs used in the model include cooling technology mix (air, liquid, two-phase, hybrid, and thermoelectric), material and interface adoption rates, application-level volume growth in computers and consumer electronics, automotive electronics penetration, and regional manufacturing concentration that influences pricing and sourcing. When a bottom-up view is incomplete for a niche interface or substrate category, the gap is handled by applying validated share-of-spend ratios from interviews, followed by a consistency check against the overall end-use spend envelope.
For forecasting, we mainly use scenario analysis supported by short-run time-series smoothing on the most stable indicators, then adjust the path based on what experts expect for adoption timing and price progression. This keeps the forecast reproducible without assuming perfect visibility into every supplier shipment line.
Data Validation & Update Cycle
Outputs are validated through triangulation across independent signals, then stress-tested for unrealistic jumps at the region and application level. We run variance checks against related metrics, such as electronics production cycles, vehicle output, and infrastructure build rates, and unusual results are flagged for a second review before sign-off.
If a new regulation, a large capacity addition, or a visible technology shift changes the spend profile, analysts re-contact selected participants to confirm direction and magnitude. Reports are refreshed annually, with interim updates when material events occur, and a final pre-delivery review is completed so clients receive the latest updated view.
Mordor Intelligence's Thermal Management Technologies Market Size Compared Against Other Published Estimates
Published market sizes for thermal management technologies often differ because the underlying demand evidence used is not the same, and inclusion rules can shift the counted revenue pool. Differences also show up when one publisher anchors to a single end market or uses a faster price ramp without checking whether the mix is moving that quickly.
Electronics shipment signals, cooling technology mix splits, and application spend checks are the validation evidence that ties Mordor Intelligence's estimate to a defined set of thermal hardware, interface materials, substrates, and control software counted only when they are used for active temperature control. The gap usually comes from scope choices, such as whether services are counted broadly, whether adjacent insulation-type products are included, and whether older base years are carried forward without a fresh pass on currency timing and recent adoption changes in liquid and two-phase cooling.
Benchmark comparison
| Source | Market Size | Gaps in Research Methodology |
|---|---|---|
| Mordor Intelligence | USD 14.74 B (2026) | |
| Global Consultancy A | USD 14.17 B (2023) | Uses an earlier base year and a broader revenue lens that can blend materials, devices, and services without clearly separating active thermal control items from adjacent non-core spending, which changes the counted pool. |
| Industry Publisher B | USD 11.30 B (2024) | Starts from a narrower base-year estimate and appears to apply faster growth assumptions through the forecast window, with limited visibility on how cooling technology mix and price progression were validated across regions. |
The spread in values is mainly explained by base-year selection and how tightly the counted products are tied to active thermal management use cases. By keeping inputs traceable to end-use activity, mix shifts, and practical pricing ranges, the model stays transparent and can be repeated when new data and interviews are added.


Key Questions Answered in the Report
What is the current value of the thermal management technologies market?
The thermal management technologies market size stands at USD 14.74 billion in 2026, on track for USD 21.49 billion by 2031.
How fast is demand for EV battery cooling projected to grow?
Automotive and EV applications are registering an 8.62% CAGR through 2031, the fastest among all end-use segments.
Which cooling technology is gaining traction over air systems?
Two-phase solutions, including immersion and vapor-chamber designs, are expanding at a 8.86% CAGR as data-center and HPC operators seek sub-ambient performance.
Why are graphite composites important in next-generation thermal design?
They deliver conductivity above 1000 W/m·K at roughly one-third the weight of copper, supporting lightweight EV packs and high-performance electronics.
Which region is expected to be the fastest-growing market for thermal management technologies?
Asia Pacific leads growth with an 8.58% CAGR to 2031, driven by electronics manufacturing and EV production scale-up.
Page last updated on:





