Thermal Analysis Software Market Size and Share
Market Overview
| Study Period | 2020 - 2031 |
|---|---|
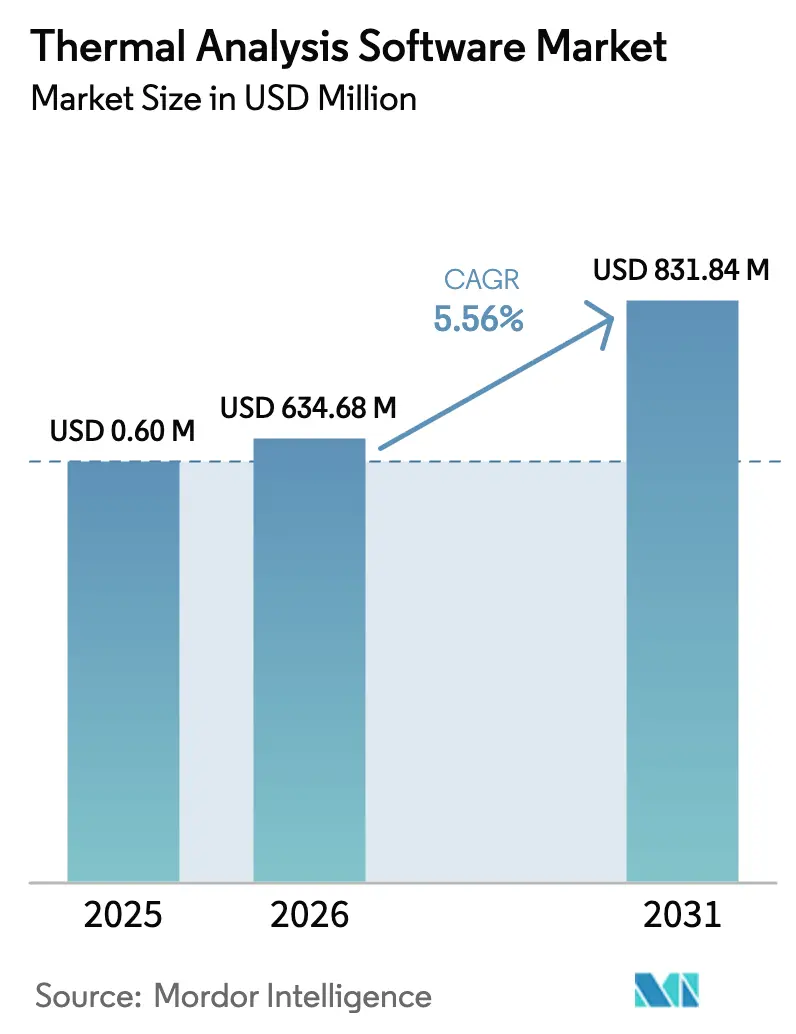
| Market Size (2026) | USD 634.68 Million |
| Market Size (2031) | USD 831.84 Million |
| Growth Rate (2026 - 2031) | 5.56% CAGR |
| Fastest Growing Market | Asia Pacific |
| Largest Market | North America |
| Market Concentration | Medium |
Major Players *Disclaimer: Major Players sorted in no particular order Image © Mordor Intelligence. Reuse requires attribution under CC BY 4.0. | |
Thermal Analysis Software Market Analysis by Mordor Intelligence
The Thermal Analysis Software Market size was valued at USD 0.60122 billion in 2025 and estimated to grow from USD 0.63468 billion in 2026 to reach USD 0.83184 billion by 2031, at a CAGR of 5.56% during the forecast period (2026-2031). Adoption is shifting from pure laboratory research toward mission-critical industrial workflows in electric vehicle, aerospace, and pharmaceutical operations, where thermal safety compliance is non-negotiable. Artificial intelligence, combined with multi-physics solvers, is shortening simulation cycles, unlocking real-time design iteration, and reducing prototype costs for complex multi-material assemblies. Cloud-based high-performance computing is broadening access for cost-conscious laboratories, especially in the Asia Pacific, while hybrid physics-informed neural networks are opening white-space opportunities in solid-state battery analysis. Competitive intensity is rising as AI-first vendors challenge instrument-centric incumbents and as operating-system flexibility becomes a key purchase criterion.
Key Report Takeaways
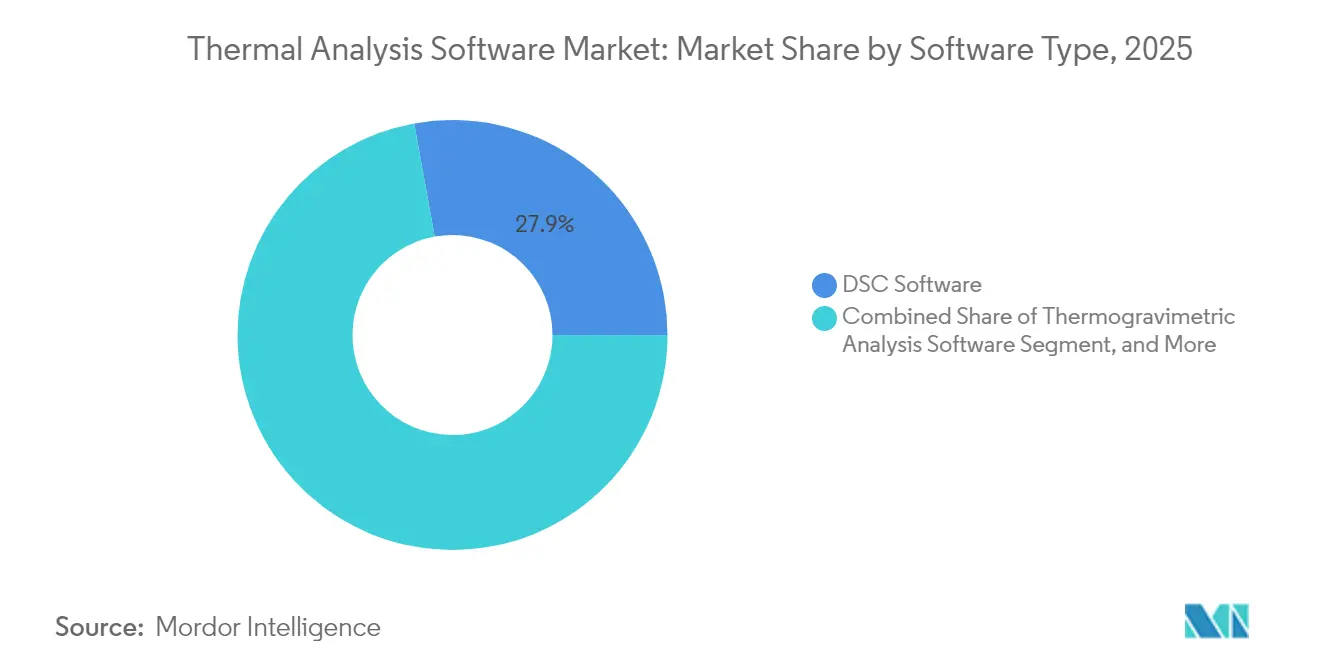
- By software type, Differential Scanning Calorimetry solutions held 27.85% of the thermal analysis software market share in 2025, while Cloud-Native Thermogravimetric Analysis is projected to advance at a 7.32% CAGR through 2031.
- By application, energy and utilities represent the fastest-growing application segment, expanding at a 7.55% CAGR through 2031 as grid-scale battery storage projects drive demand for advanced thermal safety validation.
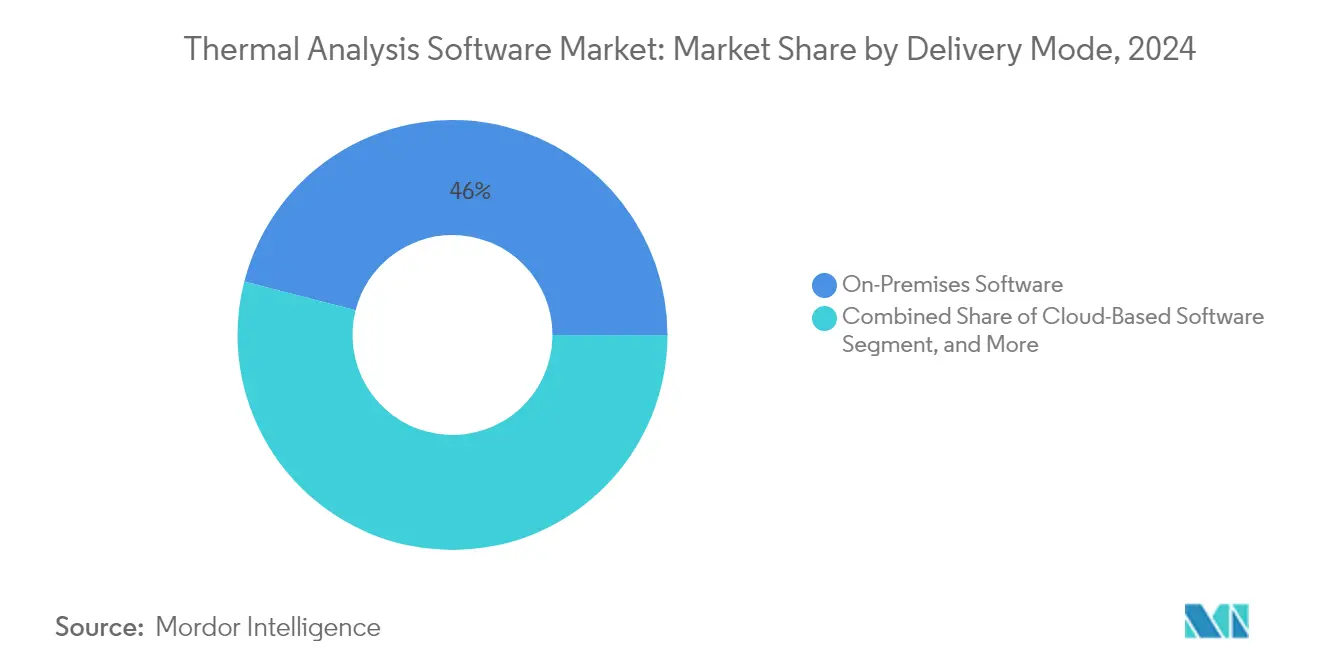
- By delivery mode, on-premises deployments accounted for 45.30% of the thermal analysis software market size in 2025, while cloud-based platforms are projected to grow at a 6.98% CAGR through 2031.
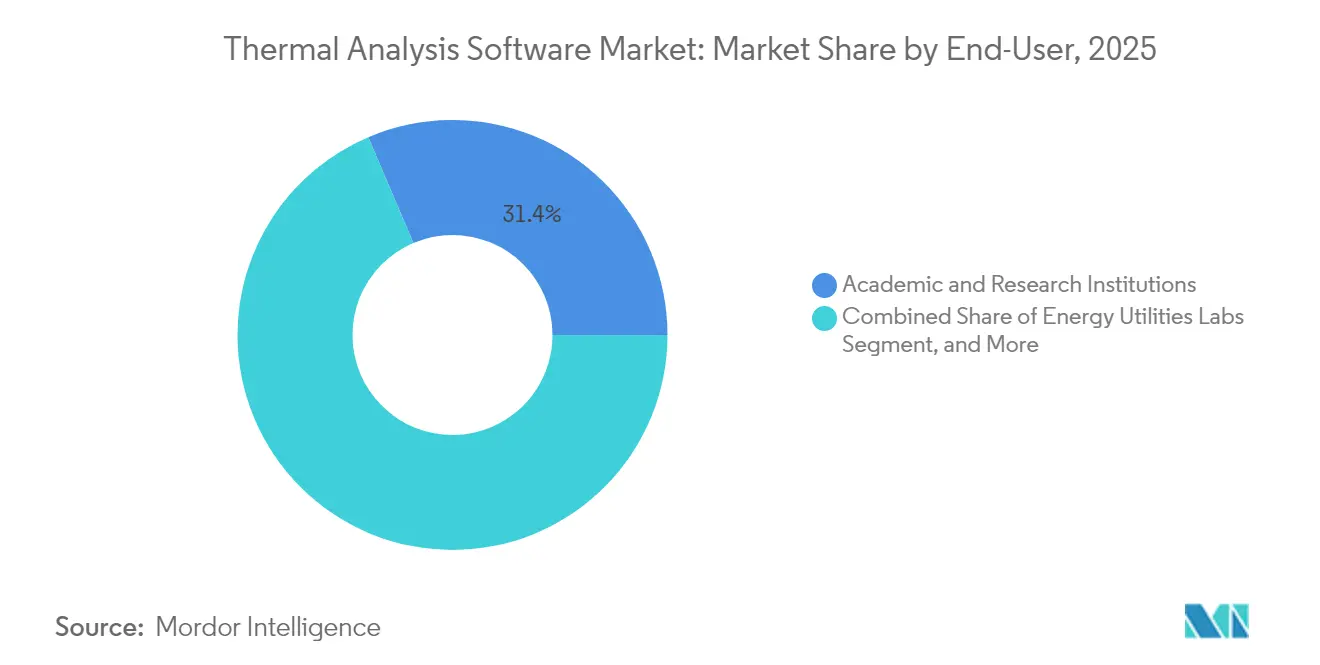
- By end user, academic and research institutions led with a 31.40% share in 2025, but energy-utility laboratories are projected to record the highest CAGR at 5.96% through 2031.
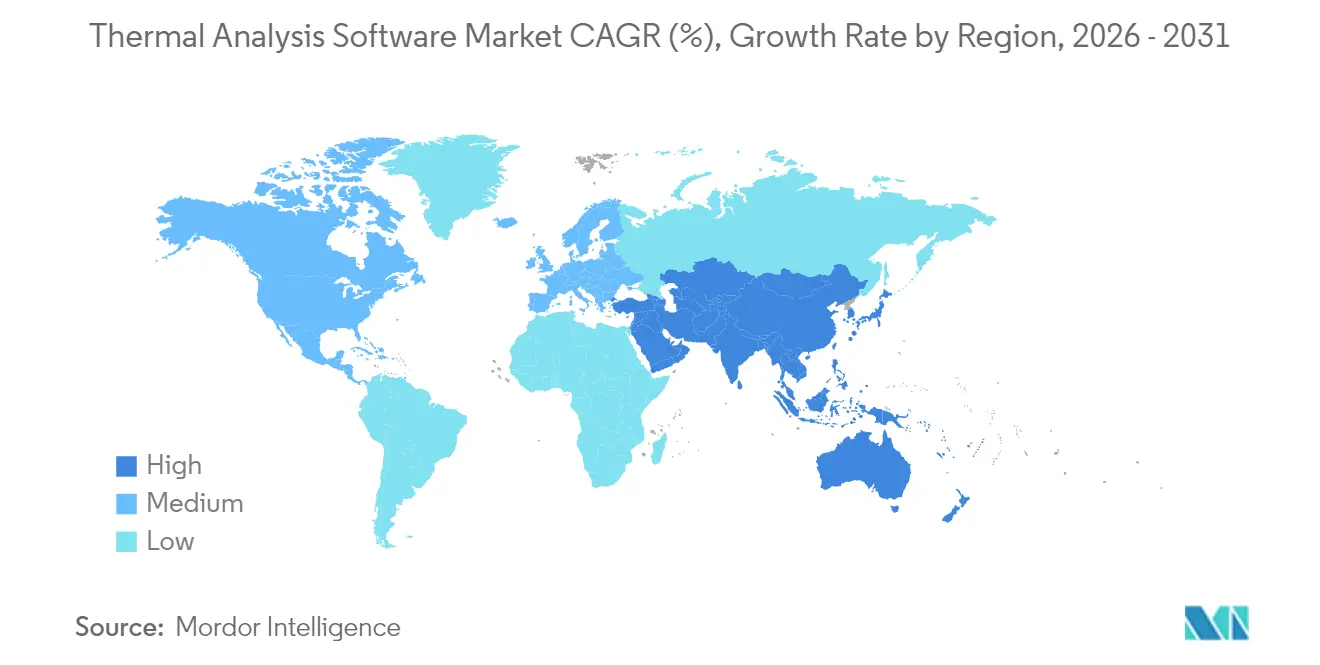
- By geography, North America commanded a 34.60% revenue share in 2025, whereas the Asia Pacific is forecast to expand at a 6.68% CAGR to 2031.
Note: Market size and forecast figures in this report are generated using Mordor Intelligence’s proprietary estimation framework, updated with the latest available data and insights as of 2026.
Global Thermal Analysis Software Market Trends and Insights
Drivers Impact Analysis*
| Driver | (~) % Impact on CAGR Forecast | Geographic Relevance | Impact Timeline |
|---|---|---|---|
| Increasing complexity of multi-material product design in EVs and lightweight aerospace components | +1.80% | Global, with concentration in North America and Asia Pacific | Medium term (2-4 years) |
| Regulatory push for thermal safety compliance across pharmaceuticals and battery manufacturing | +1.50% | Global, with emphasis on North America and Europe | Short term (≤ 2 years) |
| Shift toward digital twins and virtual prototyping reducing physical testing costs | +1.20% | Global, early adoption in North America and Europe | Medium term (2-4 years) |
| Integration of AI-driven predictive analytics into thermal analysis workflows | +1.00% | Global, led by North America and Asia Pacific | Long term (≥ 4 years) |
| Cloud-native HPC availability democratizing access for small and medium laboratories | +0.80% | Global, strongest impact in Asia Pacific and emerging markets | Short term (≤ 2 years) |
| Emerging need for thermal characterization of novel solid-state battery chemistries | +0.70% | Asia Pacific core, spill-over to North America and Europe | Long term (≥ 4 years) |
| Source: Mordor Intelligence | |||
Multi-Material EV and Aerospace Design Complexity Drives Simulation Demand
The shift to electric powertrains and lightweight aerospace components is creating multi-scale thermal gradients that legacy single-material tools cannot simulate with sufficient fidelity. Battery modules combine aluminium plates, polymer separators, and ceramic-coated electrodes within millimetre distances, demanding coupled electro-thermal models that respect the physics of material interfaces. Aerospace composites exhibit dissimilar thermal expansion among carbon fiber, thermoplastic matrices, and metallic fasteners, and require fine-mesh thermal prediction during curing and service. Next-generation software embeds machine-learning material databases to automatically update conductivity and heat capacity values across temperature ranges, reducing setup time by 60% and improving accuracy in multi-material assemblies. Physics-informed neural networks enable near-real-time field prediction, guiding laser-path optimization in additive manufacturing and preventing defect formation.[1]Youngjoon Suh, Yoonjin Won et al., “Recent progress of artificial intelligence for liquid-vapor phase change heat transfer,” npj Computational Materials, nature.com
Regulatory Thermal Safety Compliance Accelerates Software Adoption
FDA 21 CFR Part 11 mandates electronic records and audit trails, driving pharmaceutical labs toward validated platforms that guarantee data integrity. Lithium-ion cell makers must document the thermal runaway characteristics under abuse scenarios for transport certification, requiring electrochemical-thermal solvers that can estimate gas generation rates and temperature propagation. European regulators are demanding Monte Carlo-based uniformity checks for sterilization processes of medical devices, thereby promoting the adoption of statistical simulation modules. Blockchain-backed verification within software assures immutable compliance records, enabling real-time inspection readiness and cross-site laboratory harmonization.[2]European Commission Joint Research Centre, “Clean Energy Technology Observatory: Solar Thermal Energy in the European Union,” europa.eu
Digital Twin Integration Transforms Physical Testing Paradigms
Manufacturers are reducing prototype builds by 40% after implementing digital twins that merge finite-element models with live sensor feedback. Cloud-hosted twins stream field data into thermal solvers, continuously refining material properties and boundary conditions to reflect actual service environments. Predictive-maintenance dashboards utilize thermal signatures to identify early degradation, thereby avoiding unplanned downtime. Subscription-based twin platforms lower the entry barriers for small and medium-sized enterprises that previously lacked access to supercomputing clusters, thereby accelerating the global adoption of virtual prototyping.
AI-Driven Predictive Analytics Revolutionizes Thermal Workflows
Machine-learning algorithms now predict material behavior under untested thermal conditions, reducing bench validation by up to 70%. Physics-informed neural networks incorporate conservation laws to maintain 95% accuracy while achieving 100 times speedup over mesh-based finite-element runs. Computer-vision modules automatically extract boiling heat transfer nucleation data from high-speed imagery, and reinforcement learning agents dynamically adjust heating profiles to achieve target microstructures while minimizing energy consumption.[3]Zhenyu Kong, “Sub-surface thermal measurement in additive manufacturing via machine learning-enabled fiber optic sensing,” Nature Communications, nature.com
Restraints Impact Analysis*
| Restraint | (~) % Impact on CAGR Forecast | Geographic Relevance | Impact Timeline |
|---|---|---|---|
| High licensing and training costs for comprehensive software suites | -1.20% | Global, with stronger impact in emerging markets | Short term (≤ 2 years) |
| Limited interoperability between legacy lab instruments and modern software platforms | -0.80% | Global, particularly affecting established laboratories | Medium term (2-4 years) |
| Scarcity of skilled thermal analysis specialists in developing regions | -0.60% | Asia Pacific, Middle East, and Africa | Long term (≥ 4 years) |
| Data integrity concerns in cloud-based deployments within highly regulated industries | -0.40% | North America and Europe, pharmaceutical and aerospace sectors | Medium term (2-4 years) |
| Source: Mordor Intelligence | |||
High Licensing Costs Limit SME Market Penetration
Annual seat fees between USD 50,000 and USD 200,000 deter small labs from adopting full-featured suites. Specialist training programs, lasting 6-12 months, add USD 25,000 per engineer, thereby increasing the total cost of ownership. Cloud subscriptions starting at around USD 500 per month are emerging, but concerns about IP protection are slowing migration. Open-source tools, such as PyBaMM, serve niche battery use cases but lack broad feature depth and vendor support, leaving functionality gaps for end-to-end workflows.[4]PyBaMM Development Team, “PyBaMM: open-source battery modelling,” pybamm.org
Legacy Instrument Interoperability Constrains Modernization
Labs often rely on hardware with 15-year lifespans that output proprietary formats incompatible with modern software. The absence of common data standards leads to duplicate software installations, manual transfers, and error-prone conversions. Cloud platforms struggle with on-premises device firewalls, which curbs the benefits of remote high-performance computing. Industry-wide standardization initiatives remain fragmented across pharmaceuticals, materials science, and electronics verticals, delaying the rollout of unified protocols.
*Our forecasts treat driver/restraint impacts as directional, not additive. The impact forecasts reflect baseline growth, mix effects, and variable interactions.
Segment Analysis
By Software Type: DSC Dominance and Cloud-Native TGA Upswing
Differential Scanning Calorimetry solutions contributed 27.85% of the thermal analysis software market share in 2025, benefiting from regulatory reliance in drug polymorphism and polymer stability studies. The segment continues to attract incremental investment through plug-and-play AI modules that auto-detect phase-change peaks. Cloud-native thermogravimetric analysis packages are growing at a 7.32% CAGR, driven by subscription pricing and elastic compute resources that enable complex kinetic modeling without the need for capital hardware outlay. Simultaneous Thermal Analysis platforms that combine DSC and TGA in one environment are favoured by academic consortia seeking to maximize sample throughput and minimize data harmonization tasks.
The Dynamic Mechanical Analysis and Thermomechanical Analysis modules occupy specialized niches in structural elastomer and electronics packaging design, respectively, but gain relevance as additive manufacturing drives demand for viscoelastic and expansion coefficient insights. AI-guided baseline correction across these modules reduces operator variability and cuts data processing time in half.


By Application: Material Science Leadership Meets Energy Sector Acceleration
Materials science research retained a 24.10% share of the thermal analysis software market size in 2025, underpinned by university grants and corporate discovery projects that mandate exhaustive mapping of thermal properties. Yet, energy and utilities labs are expanding fastest at a 7.55% CAGR, as renewable-energy storage assets require rigorous thermal validation to secure insurance approvals and grid connection permits. Pharmaceuticals maintain stable demand for polymorph screening and lyophilization design, while chemicals and petrochemicals utilize advanced solvers for catalyst aging and polymer process windows.
Food and beverage companies focus on thermal-processing validation to ensure microbial safety, and electronics fabricators target packaging reliability improvements by modelling thermal interface materials under power-cycle loads. Automotive and aerospace engineers are increasingly embedding software in model-based systems engineering stacks to co-optimize structural and thermal performance during electrification programs.
By Delivery Mode: On-Premises Hold Yet Cloud Surges
On-premises deployments accounted for 45.30% of revenue in 2025, as data-sovereignty mandates within the pharmaceutical and defense sectors favor local compute clusters. However, cloud-based solutions are scaling at a 6.98% CAGR, as pay-per-use elasticity offsets capital expenditures, and as cybersecurity certifications (FedRAMP, ISO 27001) reassure risk-averse buyers.
Hybrid models that keep sensitive IP behind the firewall while bursting simulations into cloud GPUs are gaining traction, allowing laboratories to overcome hardware bottlenecks for peak workloads. Automatic cloud software updates also release users from upgrade labour, accelerating adoption in budget-constrained institutions.
By End User: Academic Leadership and Energy Utility Momentum
Universities and public research centers accounted for 31.40% of total demand in 2025, reflecting their role as hubs of materials characterization and method development. Energy-utility laboratories are posting the swiftest trajectory at a 5.96% CAGR, as grid-scale battery farms, concentrated solar thermal arrays, and hydrogen storage facilities necessitate predictive models for thermal safety and life-cycle performance.
Industrial manufacturing, pharmaceutical, and chemical companies maintain a solid market share due to their ongoing commitment to quality assurance. Electronics and semiconductor fabs strengthen demand as advanced packaging density increases heat-flux challenges. Government and standards agencies utilize the software for compliance audits and forensic investigations, underscoring the importance of obtaining validated, traceable results.
Geography Analysis
North America generated 34.60% of global revenue in 2025, anchored by rigorous FDA and FAA validation chains that require documented thermal characterization for drugs and aerospace components. The region also hosts major software vendors clustering around academic powerhouses, enabling tight feedback loops between R&D and product development. The Asia Pacific is projected to record a 6.68% CAGR from 2026 to 2031, driven by the rapid expansion of battery gigafactories in China, Korea, and India, as well as government incentives supporting the integration of digital twins within smart manufacturing zones. Local software start-ups are leveraging cloud platforms to undercut licensing costs, further accelerating adoption among small laboratories.
Europe exhibits steady yet slower growth as a mature adopter, with demand driven by automotive electrification programs, sustainability mandates, and high-end chemical processing. European Union initiatives promoting circular economy practices are spurring investment in thermal modeling of recycling and bio-based materials.
Middle East and Africa markets are at earlier adoption stages yet benefit from massive petrochemical capex and emerging pharmaceutical fill-finish operations; skills shortages and capital constraints temper near-term growth but create long-run upside once training gaps close. South America demonstrates expanding usage in mining, agriculture, and food processing, though currency volatility and limited supercomputing infrastructure restrict the pace of premium-license purchases.

Competitive Landscape
The market remains moderately fragmented. The top five vendors control an estimated 45%-55% share, reflecting vertical integration between instrument hardware and proprietary software, yet leaving room for nimble AI-native challengers. Incumbents such as TA Instruments, NETZSCH, and Mettler-Toledo embed software in instrument bundles, creating switching costs through proprietary data protocols.
Cadence’s Celsius Studio exemplifies the hybrid AI-physics approach that incumbents adopt to defend share, combining thermal network extraction with reinforcement learning-driven design space exploration. Emerging competitors differentiate via cloud-native subscriptions and domain-specific toolkits for solid-state batteries and additive manufacturing.
Open-source initiatives like PyBaMM intensify price pressure in the battery segment but still lack the broad compliance features demanded by regulated industries. Strategic alliances with hyperscale cloud providers help vendors democratize access to GPU clusters and drive revenue models based on consumption. Mergers focus on augmenting material-property databases and adding AI accelerators that cut solve times while maintaining regulatory-grade accuracy.
Thermal Analysis Software Industry Leaders
TA Instruments – Waters Corporation
NETZSCH-Gerätebau GmbH
Mettler-Toledo International Inc.
PerkinElmer Inc.
Shimadzu Corporation
- *Disclaimer: Major Players sorted in no particular order


Recent Industry Developments
- August 2025: Streamline Solutions launched ELEMENTS 4.4.0, featuring enhanced battery thermal-runaway models and porous-media radiation, to support automotive design workflows.
- June 2025: Thermo-Calc Software released 2025b, expanding elastic-property databases and extending steel strength models to full flow-stress prediction.
- June 2024: Cadence introduced Sigrity and Systems Analysis 2024.0, featuring Celsius Studio, an AI-enabled electro-thermal platform for electronics design.
- April 2024: Siemens rolled out Simcenter FloTherm 2404 and FloTherm XT 2404, along with the Material Map SmartPart, for faster PCB simulation.


Global Thermal Analysis Software Market Report Scope
The Thermal Analysis Software Market Report is Segmented by Software Type (DSC, TGA, STA, DMA, TMA, Others), Application (Material Science, Pharmaceuticals, Chemicals, Food, Electronics, Automotive, Aerospace, Energy, Others), Delivery Mode (On-Premises, Cloud-Based, Hybrid), End User (Academic, Industrial, Pharmaceutical, Chemical, Food, Electronics, Government, Others), Deployment Platform (Windows, Linux, Mac OS), and Geography (North America, Europe, Asia-Pacific, Middle East, Africa, South America). The Market Forecasts are Provided in Terms of Value (USD).
| Differential Scanning Calorimetry (DSC) Software |
| Thermogravimetric Analysis (TGA) Software |
| Simultaneous Thermal Analysis (STA) Software |
| Dynamic Mechanical Analysis (DMA) Software |
| Thermomechanical Analysis (TMA) Software |
| Others Software Types (E.g., Dilatometry Software, Creep Analysis Software) |
| Material Science and Research |
| Pharmaceuticals and Biotechnology |
| Chemicals and Petrochemicals |
| Food and Beverage Industry |
| Electronics and Semiconductors |
| Automotive |
| Aerospace |
| Energy and Utilities |
| Other Applications |
| On-Premises Software |
| Cloud-Based Software |
| Hybrid Solutions |
| Academic and Research Institutions |
| Industrial and Manufacturing Laboratories |
| Pharmaceutical Companies |
| Chemical Manufacturers |
| Food and Beverage Companies |
| Electronics and Semiconductor Manufacturers |
| Government and Regulatory Bodies |
| Other End-Users |
| North America | United States |
| Canada | |
| Mexico | |
| Europe | United Kingdom |
| Germany | |
| France | |
| Italy | |
| Rest of Europe | |
| Asia-Pacific | China |
| Japan | |
| India | |
| South Korea | |
| Rest of Asia | |
| Middle East | Israel |
| Saudi Arabia | |
| United Arab Emirates | |
| Turkey | |
| Rest of Middle East | |
| Africa | South Africa |
| Egypt | |
| Rest of Africa | |
| South America | Brazil |
| Argentina | |
| Rest of South America |
| By Software Type | Differential Scanning Calorimetry (DSC) Software | |
| Thermogravimetric Analysis (TGA) Software | ||
| Simultaneous Thermal Analysis (STA) Software | ||
| Dynamic Mechanical Analysis (DMA) Software | ||
| Thermomechanical Analysis (TMA) Software | ||
| Others Software Types (E.g., Dilatometry Software, Creep Analysis Software) | ||
| By Application | Material Science and Research | |
| Pharmaceuticals and Biotechnology | ||
| Chemicals and Petrochemicals | ||
| Food and Beverage Industry | ||
| Electronics and Semiconductors | ||
| Automotive | ||
| Aerospace | ||
| Energy and Utilities | ||
| Other Applications | ||
| By Delivery Mode | On-Premises Software | |
| Cloud-Based Software | ||
| Hybrid Solutions | ||
| By End User | Academic and Research Institutions | |
| Industrial and Manufacturing Laboratories | ||
| Pharmaceutical Companies | ||
| Chemical Manufacturers | ||
| Food and Beverage Companies | ||
| Electronics and Semiconductor Manufacturers | ||
| Government and Regulatory Bodies | ||
| Other End-Users | ||
| By Geography | North America | United States |
| Canada | ||
| Mexico | ||
| Europe | United Kingdom | |
| Germany | ||
| France | ||
| Italy | ||
| Rest of Europe | ||
| Asia-Pacific | China | |
| Japan | ||
| India | ||
| South Korea | ||
| Rest of Asia | ||
| Middle East | Israel | |
| Saudi Arabia | ||
| United Arab Emirates | ||
| Turkey | ||
| Rest of Middle East | ||
| Africa | South Africa | |
| Egypt | ||
| Rest of Africa | ||
| South America | Brazil | |
| Argentina | ||
| Rest of South America | ||


Key Questions Answered in the Report
How large is the thermal analysis software market in 2026?
The thermal analysis software market size is USD 634.68 million in 2026, with a 5.56% CAGR forecast to 2031.
Which region will grow fastest through 2031?
Asia Pacific leads growth with a 6.68% CAGR thanks to battery manufacturing expansion and cloud-native adoption.
Which software type currently dominates spending?
Differential Scanning Calorimetry software holds 27.85% market share due to its role in pharmaceutical and polymer applications.
Why are cloud-based platforms gaining traction?
Subscription pricing and elastic GPU resources cut capital costs and accelerate large simulations, propelling a 6.98% CAGR for cloud deployments.
What is the biggest barrier for small laboratories?
High licensing and training fees, which can exceed USD 200,000 per seat plus USD 25,000 per engineer, limit adoption among small and medium enterprises.
How is AI changing thermal analysis workflows?
Physics-informed neural networks deliver 100x faster solve times while maintaining accuracy, enabling real-time design iteration and predictive maintenance.
Page last updated on:


