Energy Measurement IC Market Size and Share
Market Overview
| Study Period | 2020 - 2031 |
|---|---|
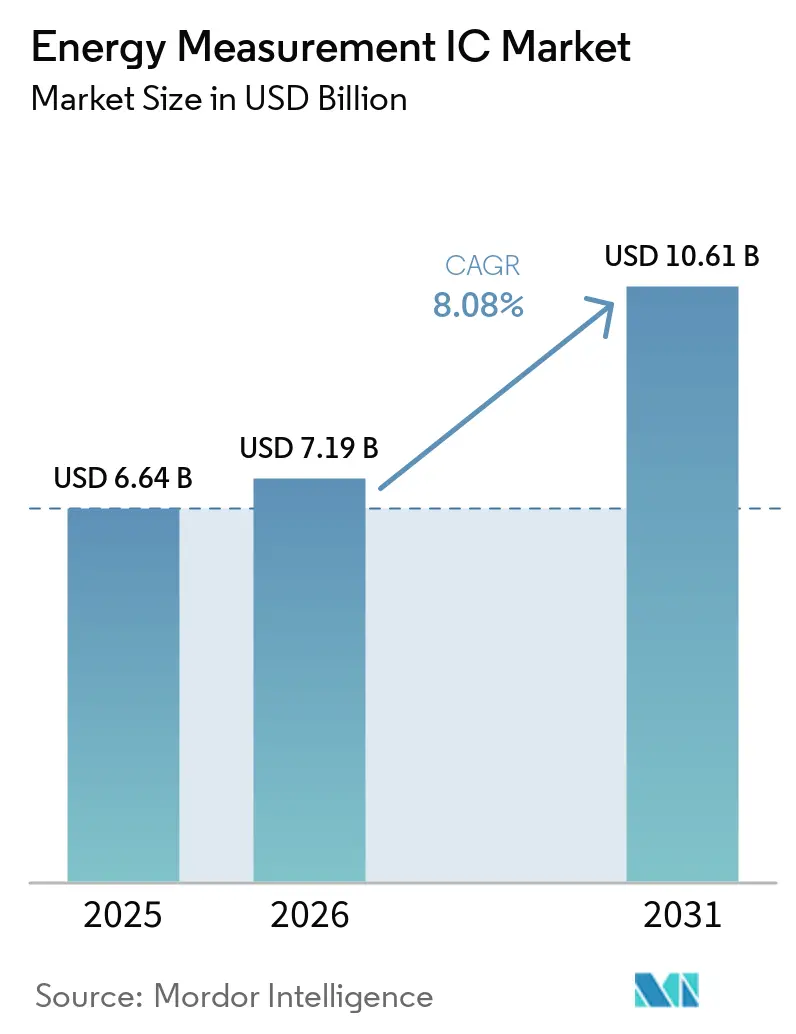
| Market Size (2026) | USD 7.19 Billion |
| Market Size (2031) | USD 10.61 Billion |
| Growth Rate (2026 - 2031) | 8.08% CAGR |
| Fastest Growing Market | Middle East |
| Largest Market | Asia Pacific |
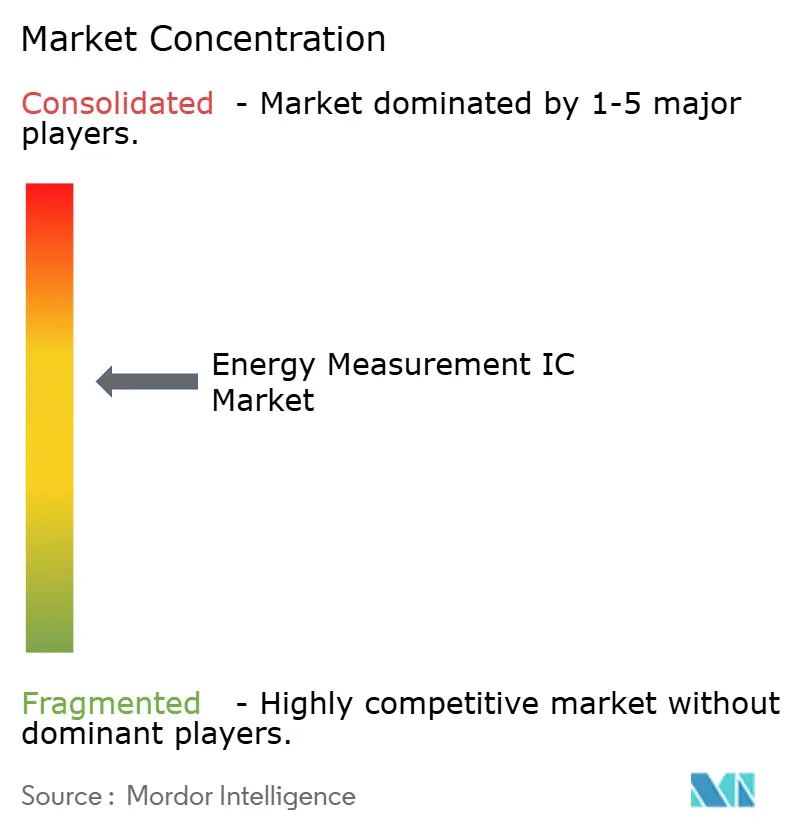
| Market Concentration | Medium |
Major Players *Disclaimer: Major Players sorted in no particular order Image © Mordor Intelligence. Reuse requires attribution under CC BY 4.0. | |
Energy Measurement IC Market Analysis by Mordor Intelligence
The Energy Measurement IC market size is projected to be USD 6.64 billion in 2025, USD 7.19 billion in 2026, and reach USD 10.61 billion by 2031, growing at a CAGR of 8.08% from 2026 to 2031. Multiple policy mandates, the electrification of transportation, and deepening IoT penetration are accelerating device demand as utilities, industrials, and building owners converge on real-time, revenue-grade metrology solutions. Rapid smart-meter installations in India, Brazil, and the European Union have compressed decade-long replacement cycles into five-year windows, straining foundry capacity and reshaping semiconductor supply chains. Electric-vehicle (EV) charging networks now specify Class 0.1 accuracy to satisfy public-utility commission tariff rules, lifting the performance bar for both alternating-current and direct-current stations. Meanwhile, microcontroller manufacturers are embedding metrology analog front-ends into low-power SoCs, shrinking board footprints for smart plugs, submeters, and prepaid meters, and opening new volume layers across the Energy Measurement IC market. Utilities and building managers are also deploying power-quality analytics that capture harmonics, power factor, and total harmonic distortion, extending chip revenue beyond basic kilowatt-hour billing.
Key Report Takeaways
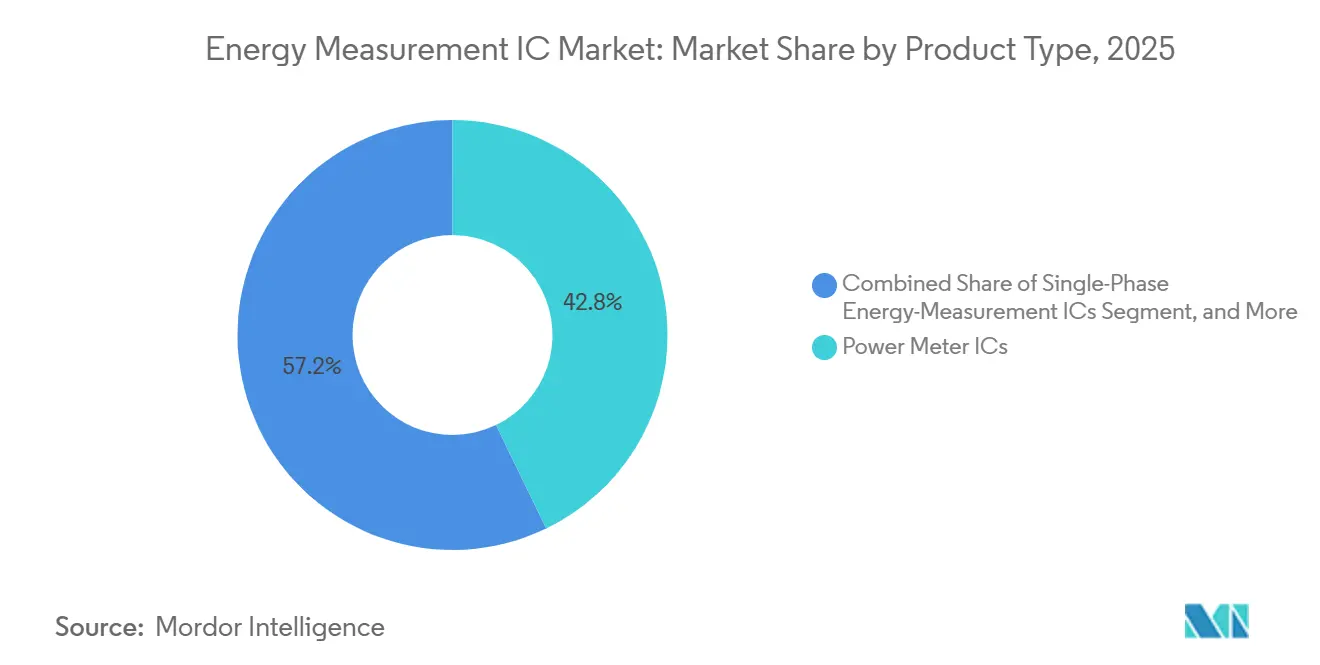
- By product type, poly-phase devices led with 42.85% of the Energy Measurement IC market share in 2025; system-on-chip devices are forecast to expand at an 8.55% CAGR through 2031.
- By communication interface, Serial Peripheral Interface captured 46.67% of the Energy Measurement IC market size in 2025, while UART is projected to grow at an 8.97% CAGR between 2026 and 2031.
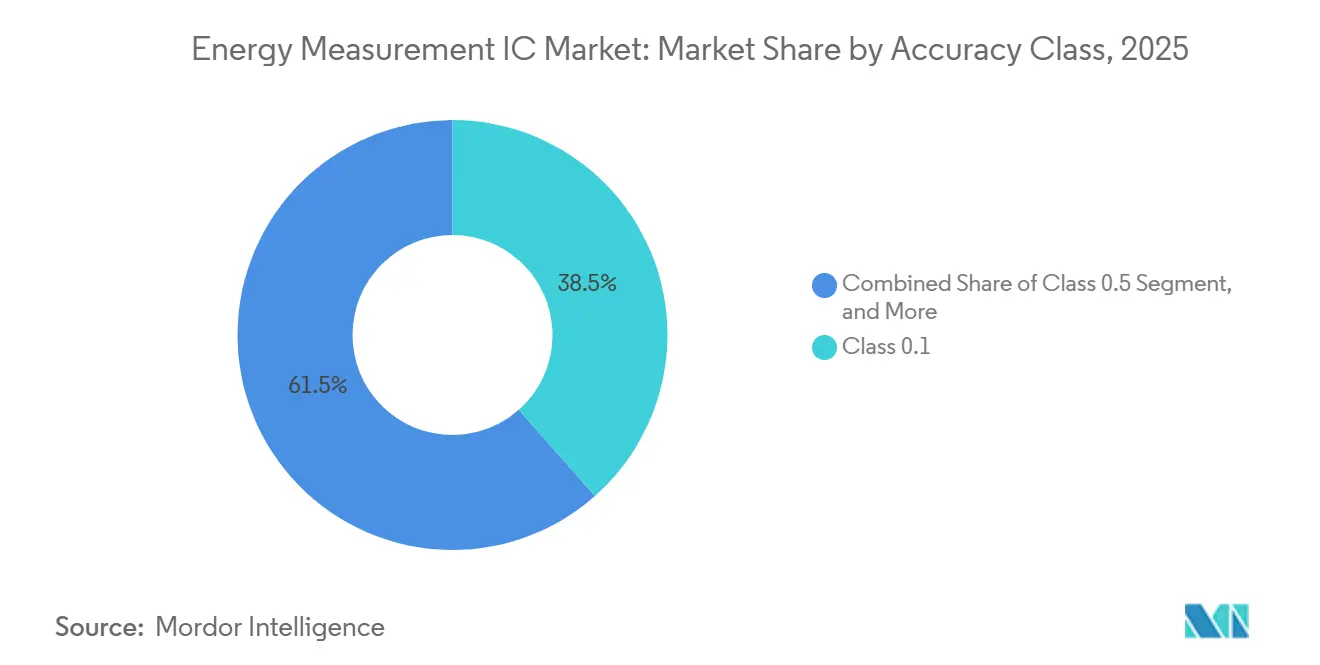
- By accuracy class, Class 0.1 devices held 38.46% share of the Energy Measurement IC market size in 2025 and are advancing at an 8.75% CAGR through 2031.
- By end use, smart electricity meters accounted for 55.91% of the Energy Measurement IC market in 2025; EV charging stations are the fastest-growing end use, expanding at an 8.79% CAGR to 2031.
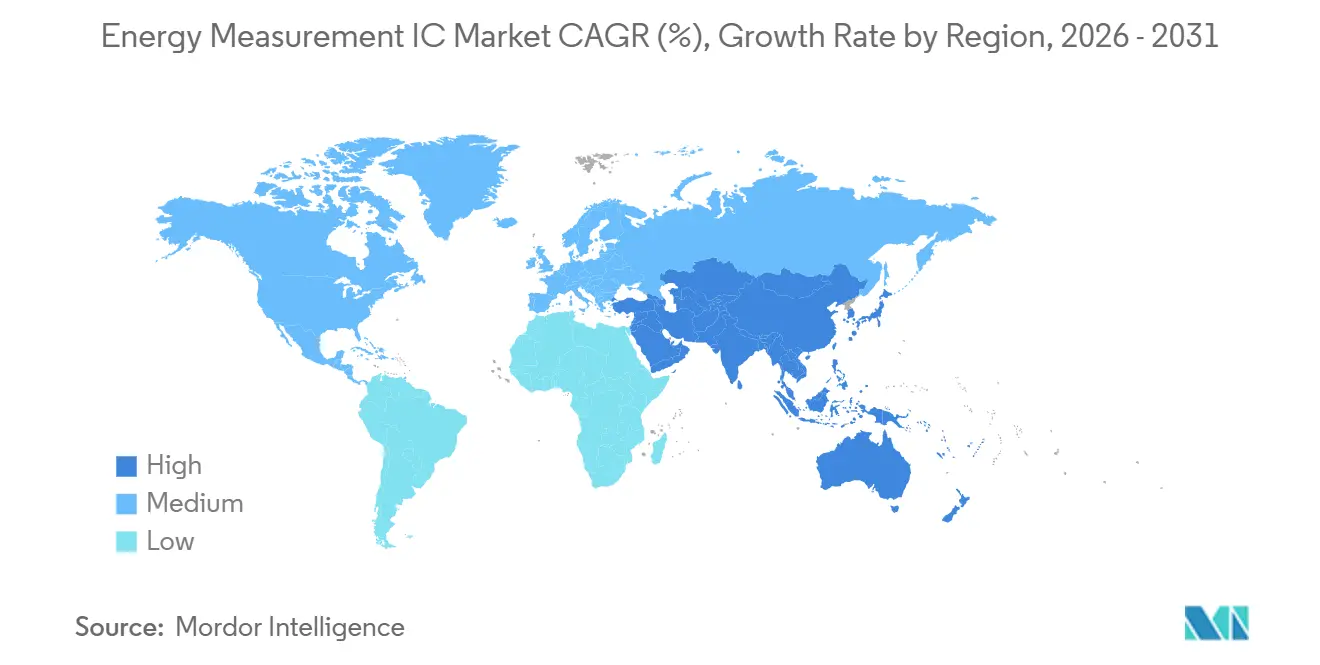
- By geography, Asia-Pacific commanded 41.78% of the Energy Measurement IC market in 2025, whereas the Middle East is forecast to record an 8.86% CAGR over 2026-2031.
Note: Market size and forecast figures in this report are generated using Mordor Intelligence’s proprietary estimation framework, updated with the latest available data and insights as of January 2026.
Global Energy Measurement IC Market Trends and Insights
Drivers Impact Analysis*
| Driver | (~) % Impact on CAGR Forecast | Geographic Relevance | Impact Timeline |
|---|---|---|---|
| Proliferation of Advanced Smart-Meter Roll-Outs in India, Brazil, and the EU | +2.1% | Asia-Pacific, South America, Europe | Medium term (2-4 years) |
| Rapid Electrification of EV Charging Infrastructure Needs Class 0.1 Billing Accuracy | +1.8% | North America, Europe, China | Medium term (2-4 years) |
| Mandatory Appliance-Level Sub-Metering in Commercial Buildings | +1.4% | North America, Europe | Short term (≤ 2 years) |
| Utility Push Toward Real-Time Power-Quality Analytics, Harmonics, PF, THD | +0.9% | Global | Long term (≥ 4 years) |
| Integration of Energy-Measurement IP into MCU/SoC for Battery-Powered IoT Nodes | +0.7% | Global | Long term (≥ 4 years) |
| Silicon-On-Insulator Processes Enabling Sub-Milli-Watt Standby Current ICs | +0.5% | Global | Long term (≥ 4 years) |
| Source: Mordor Intelligence | |||
Proliferation of Advanced Smart-Meter Roll-Outs In India, Brazil and EU
Mandatory programs are pushing utilities to install millions of meters with tamper detection, multi-tariff billing, and remote firmware capability within five-year windows, pulling forward semiconductor demand and swelling order books for leading suppliers. India’s Revamped Distribution Sector Scheme requires 203 million units with 60% domestic content, a clause that fuels local assembly partnerships and affects pricing leverage.[1]Power Grid Corporation of India, “Revamped Distribution Sector Scheme Progress Update,” powergrid.in Brazil’s portaria requires 2% smart-meter penetration by March 2028, prompting CPFL Energia to earmark BRL 1.2 billion (USD 240 million) for 1.6 million devices and to seek bank financing for broader coverage.[2]CPFL Energia, “Plano de Investimentos em Medição Inteligente,” cpfl.com.br The European Union’s Energy Performance of Buildings Directive sets a December 2026 deadline for sub-metering in commercial buildings, multiplying single-phase IC volume.[3]European Commission, “Energy Performance of Buildings Directive 2024/XXX,” europa.eu Collectively, these rollouts compress normal replacement cycles, stress foundry allocation, and incentivize dual-sourcing from both Western and Chinese vendors to secure supply continuity.
Mandatory Appliance-Level Sub-Metering In Commercial Buildings
United States codes, including ASHRAE 90.1-2019, and local ordinances such as New York City Local Law 88 now force interval metering for floor plates and equipment loads, multiplying the number of chips per building tenfold.[4]American Society of Heating, Refrigerating and Air-Conditioning Engineers, “Standard 90.1-2019 Submetering Requirements,” ashrae.org Parallel rules in the EU extend metering to heating, cooling, and domestic hot water, requiring 15-minute data granularity under the Building Automation and Control Systems framework. Owners adopt compact, low-cost single-phase ICs with UART or I²C links, embedding them in DIN-rail modules and smart plugs, thereby broadening the addressable base of the Energy Measurement IC market. ESG reporting and ISO 50001 certification further encourage deployments that connect electricity, water, and gas data on unified dashboards. Because building owners order in smaller lots than utilities, suppliers must serve a long-tail customer set, yet the cumulative volume outweighs the added sales complexity.
Rapid Electrification Of EV Charging Infrastructure Needing Class 0.1 Billing Accuracy
Public and commercial chargers must meet NIST Handbook 44 ±1% for AC and ±2% for DC, coupled with Germany’s Eichrecht calibration law, which requires device makers to adopt Class 0.1 chips capable of wide-dynamic-range precision. Fast chargers above 350 kW, vehicle-to-grid systems, and fleets using time-of-use tariffs cannot tolerate energy miscounts that erode narrow profit margins. ICs with 24-bit sigma-delta ADCs and on-chip DSPs now dominate charger reference designs, enabling simultaneous capture of bidirectional flows, harmonics, and reactive power. With more than 3 million charging points under construction globally, each dispenser represents multiple metering channels, magnifying silicon demand across the Energy Measurement IC market. Regulations from state public-utility commissions accelerate convergence toward IEC 62053-22 Class 0.2S for AC and emerging IEC 62053-24 requirements for DC energy, effectively raising the floor on accuracy for new hardware.
Utility Push Toward Real-Time Power-Quality Analytics, Harmonics, PF, THD
Grid operators need continuous visibility into voltage sag, harmonic distortion, and poor power factor to protect transformers and manage distributed energy resources. IEEE 519-2022 caps total harmonic distortion at 5% for voltage, prompting utilities to embed waveform analytics in smart meters. ICs such as Analog Devices’ ADE9000 resample waveforms to 128 points per cycle, calculating up to the 50th harmonic while maintaining Class 0.1 energy accuracy. Deployments of over one million edge sensors in the United States already stream sub-second data for predictive maintenance, illustrating revenue models beyond simple billing. As distributed solar, EV chargers, and variable-frequency drives proliferate, utilities shift from monthly reads to real-time alarms, turning metering ICs into mini-phasor measurement units at the grid edge. This qualitative leap enlarges functional content per meter and makes analytics capability an upsell feature in the Energy Measurement IC market.
Restraints Impact Analysis*
| Restraint | (~) % Impact on CAGR Forecast | Geographic Relevance | Impact Timeline |
|---|---|---|---|
| Volatility in 6-Inch and 8-Inch Fab Capacity for Legacy Analog Process Nodes | -1.2% | Global | Short term (≤ 2 years) |
| Dependence on Third-Party Calibration Labs Prolongs Time-to-Market | -0.8% | Global | Medium term (2-4 years) |
| Fragmented Global Standards, IEC 62053 and ANSI C12, Increase Design-In Complexity | -0.5% | Global | Long term (≥ 4 years) |
| Intellectual-Property Litigation Around Delta-Sigma ADC Topologies | -0.3% | Global | Medium term (2-4 years) |
| Source: Mordor Intelligence | |||
Volatility In 6-Inch and 8-Inch Fab Capacity for Legacy Analog Nodes
Most metering SoCs are built on 180 nm–350 nm processes, the same lines serving automotive microcontrollers and power-management ICs. In 2025, wafer lead times ballooned to 52 weeks as foundries prioritized higher-margin automotive commitments, forcing metering suppliers to pre-pay for capacity or redesign around second-source dies. The geographic concentration of analog fabs in Taiwan and the United States introduces earthquake, drought, and geopolitical risks, making diversification an executive-level priority. Utilities are reluctant to requalify meters around alternative chips because recertification under IEC 62053 and ANSI C12 can exceed USD 0.5 million and twelve months, muting elasticity and amplifying supply-chain risk. As new 8-inch fabs remain economically unattractive, the imbalance will persist, capping short-term output in several product families and tempering Energy Measurement IC market growth.
Dependence on Third-Party Calibration Labs Prolongs Time-To-Market
Accredited laboratories linked to national metrology institutes must certify each new IC or meter design, yet testing backlogs stretch six to twelve months due to limited benches and a surge in globally bound models. The European Union’s Measurement Instruments Directive adds another conformity layer, compelling vendors to navigate dual approval loops for North America and Europe. Smaller suppliers lacking in-house labs struggle to shoulder parallel projects, delaying release cadences relative to diversified incumbents. Because utilities cannot order uncertified hardware, slippages cascade into procurement cycles and revenue forecasts, softening near-term Energy Measurement IC market expansion, especially for niche entrants.
*Our forecasts treat driver/restraint impacts as directional, not additive. The impact forecasts reflect baseline growth, mix effects, and variable interactions.
Segment Analysis
By Product Type: System-On-Chip ICs Gain As Meter Makers Consolidate Components
Poly-phase ICs controlled 42.85% of 2025 revenue, reflecting industrial and utility preference for integrated harmonic analysis and simultaneous multi-line sampling. The segment’s leadership underscores how three-phase feeders dominate transmission and large commercial loads in China, India, and Western Europe. Vendors differentiate through deep-buffer waveform capture, phase calibration engines, and cybersecurity co-processors, features that command premium pricing while preserving gross margins even as average selling prices for single-phase chips compress. System-on-chip (SoC) solutions are positioned to outgrow discrete architectures at an 8.55% CAGR because they integrate metrology, microcontroller, and communication onto a single die, shaving printed-circuit-board area by 30% and bills of materials by USD 2–3 per residential meter.
Meter manufacturers targeting cost-sensitive programs in Africa and Southeast Asia increasingly favor SoCs, trading flexibility in sensor topology for lower stock-keeping-unit complexity. Poly-phase devices retain primacy in revenue-grade installations, especially where utilities reward power-quality functions and Class 0.1 accuracy with higher tariffs. Hall-effect and Rogowski configurations represent an emerging niche for clamp-on retrofits and panel-level monitors. Their transformer-free design enables non-invasive current sensing, a value proposition that resonates with building managers who cannot interrupt power to install CTs. Collectively, these dynamics illustrate the diverse yet complementary product strata sustaining the Energy Measurement IC market.


By Communication Interface: UART Ascends With Wireless Module Proliferation
Serial Peripheral Interface (SPI) dominated legacy meters because synchronous four-wire buses delivered 20 MHz transfer rates, vital for full-waveform capture. In 2025, SPI held 46.67% share, but its footprint is plateauing as LoRaWAN, NB-IoT, and LTE-M modules prefer asynchronous links that reduce pin count and simplify firmware. UART adoption is thus projected to rise at an 8.97% CAGR, mirroring the expanded use of plug-in cellular modems in rural electrification projects and grid-edge retrofits.
Developers also leverage UART in smart plugs and consumer appliances that host Bluetooth Low Energy or Wi-Fi chips lacking native SPI slave modes. I²C persists in sub-meter clusters where addressable multi-drop topologies outweigh its slower clock, while RS-485 and M-Bus linger in industrial automation and district heating. The interface mosaic obliges IC vendors to offer pin-compatible variants or multiplexed peripherals, complicating design-for-cost initiatives. Nonetheless, UART’s rise signals how wireless backhaul is redrawing reference architectures and propelling new unit volumes across the Energy Measurement IC market.
By Accuracy Class: Class 0.1 Leads As EV Charging Demands Revenue-Grade Precision
Electric-vehicle legislation and premium industrial billing propelled Class 0.1 devices to 38.46% share in 2025, and the category is set to grow at 8.75% annually as more jurisdictions adopt revenue-grade definitions mirroring IEC 62053-22 and ANSI C12.20. Chipsets with 24-bit sigma-delta converters, programmable gain amplifiers, and multi-point self-calibration now span 5,000:1 dynamic ranges, satisfying both 3 A residential dribble loads and 600 A DC fast chargers without per-unit factory adjustment.
Class 0.2 and Class 0.5 ICs remain relevant in markets where tariff structures tolerate wider tolerances or where subsidies cap hardware budgets. Class 1.0 and above survive in prepaid meters, but even here regulatory drift suggests an eventual migration upward, especially as mobile-money ecosystems enable micro-billing that magnifies cumulative error. Consequently, performance skews are compressing, and vendors unable to uplift accuracy risk commoditization. Elevated precision thresholds anchor long-term differentiation and intensify R&D outlays, reinforcing the competitive moat of incumbents in the Energy Measurement IC market.
By End-Use Application: EV Charging Stations Outpace Legacy Meter Replacement
Smart electricity meters still represented 55.91% of 2025 shipments, a testament to large-scale mandates in populous nations. Yet EV chargers are the fastest-growing segment, expanding at an 8.79% CAGR as carmakers, fleet operators, and energy retailers race to monetize kilowatt-hours on forecourts, apartment blocks, and highway corridors. Each fast-charging cabinet can embed six or more metering channels, multiplying silicon content relative to a single-phase home meter.
Industrial monitoring, data centers, and building-management systems adopt multi-channel chips for ISO 50001 compliance and asset-level load shedding, increasing demand for Rogowski-ready designs. Smart plugs and consumer IoT accessories amplify unit counts even when individual ASPs are low, reinforcing a long-tail consumption pattern. Renewable-energy inverters and microgrids require bidirectional accuracy to manage export tariffs, widening the scope for dual-direction firmware. This diversified field underpins a balanced yet upward demand trajectory for the Energy Measurement IC market.
Geography Analysis
Asia-Pacific held 41.78% of 2025 revenue, underpinned by China’s multi-billion-dollar grid-modernization budgets and Southern Power Grid’s purchase of 60 million security chips, which lifted local fab utilization and created scale leverage for domestic chipmakers. India’s 60% local-content mandate is redirecting final assembly and calibration work to indigenous contractors, stimulating joint ventures between global IP owners and regional meter assemblers. Mature installations in Japan and South Korea concentrate on replacement cycles that specify higher accuracy and cybersecure links, nudging ASPs upward.
North America combines entrenched smart-meter networks with aggressive EV infrastructure spending, as California, Texas, and New York approve utility tariffs that require Class 0.1 meters at public charge points. Public-utility commissions also impose power-quality reports, encouraging upgrades across secondary feeders. Europe remains a dual-growth arena: retrofits for appliance-level sub-metering in commercial real estate and expansion of residential chargers in Norway, Germany, and the United Kingdom. The Energy Measurement IC market size linked to these European deployments gains momentum from building-code revisions effective December 2026.
The Middle East and Africa show the highest forward CAGR at 8.86%, buoyed by Saudi Arabia’s Vision 2030 and the United Arab Emirates’ demand-side management rules that cap peak consumption for clients above 100 kW. South America’s acceleration pivots on Brazil’s financing packages for utilities, which draw on development-bank credit lines to meet portaria targets. Elsewhere, prepaid meter programs in Nigeria, Kenya, and Tanzania continue to favor single-phase low-cost ICs with LoRaWAN or NB-IoT backhaul, sustaining baseline volume and exposing vendors to currency fluctuation risk.

Competitive Landscape
Analog Devices, Texas Instruments, and STMicroelectronics collectively anchor the premium echelon through decades of delta-sigma ADC expertise, robust calibration libraries, and committee participation that shapes IEC and ANSI standards. Their portfolios span standalone 7-channel front-ends to integrated MCU combinations, enabling tiered pricing and differentiation across customer segments. Vertical-integrated Chinese groups, including Hangzhou Holley Technology, Jiangsu Holin Microelectronics, and HiTrend Technology, captured around one-third of the domestic three-phase slice in 2025 by pairing cost advantages with local technical support and utility-specific firmware. Holley, for instance, maintained roughly 33% share of China’s electricity-meter domain while exporting to more than 60 countries through localized factories, underscoring how manufacturing scale can double as export leverage.
Emerging specialized challengers play in white-space niches such as Hall-effect or Rogowski-coil front-ends, where transformer-less sensing benefits cramped enclosures. Analog Devices’ ADE7816 exemplifies this trajectory, integrating six digital integrators that directly interface with Rogowski coils to retrofit legacy panels without outage. Shanghai Belling’s BL0942 offers <0.1% error without factory calibration and targets gigahertz-volume smart-plug demand. Infineon’s 2026 purchase of ams OSRAM’s analog sensor portfolio adds temperature and position devices that complement its power semiconductor line, signaling cross-selling intent into Energy Measurement IC market accounts.
Strategy blueprints converge on deeper SoC integration, silicon-on-insulator process migration for sub-milliwatt standby, and on-chip DSPs that push analytics up to the 50th harmonic. Firms unable to secure long-term 8-inch capacity or fund multipoint gain-error trimming risk relegation to low-margin tiers. Certification bottlenecks further privilege incumbents that maintain in-house test tracks with national metrology traceability. Overall, the top five players collectively control more than 50% of global revenue, supporting a market concentration score of 6.
Energy Measurement IC Industry Leaders
Analog Devices, Inc.
Texas Instruments Incorporated
Cirrus Logic, Inc.
Silicon Laboratories Inc.
Renesas Electronics Corporation
- *Disclaimer: Major Players sorted in no particular order

Recent Industry Developments
- March 2026: Holley Technology launched the Huali Technology AI initiative to embed artificial-intelligence-driven quality control and supply-chain optimization across its smart-meter factories.
- February 2026: Infineon Technologies agreed to acquire ams OSRAM’s non-optical analog and mixed-signal sensor assets for EUR 570 million (USD 640 million) in a deal expected to close in Q2 2026.
- February 2026: STMicroelectronics closed the acquisition of NXP Semiconductors’ MEMS sensors business, adding automotive and industrial motion sensors to its portfolio.
- January 2026: STMicroelectronics expanded its portfolio of integrated metering ICs with embedded processing and communication interfaces, targeting smart meters and IoT-based energy monitoring systems.


Global Energy Measurement IC Market Report Scope
The scope of the report includes a comprehensive analysis of the Energy Measurement IC market, focusing on integrated circuits designed to measure and monitor energy consumption across various applications. These ICs are widely used in smart meters, industrial equipment, and consumer electronics to ensure accurate energy usage tracking and efficient power management. The study covers market dynamics, trends, and forecasts, providing insights into the factors driving market growth during the forecast period.
The Energy Measurement IC Market Report is Segmented by Product Type (Single-Phase Energy-Measurement ICs, Poly-Phase Energy-Measurement ICs, System-on-Chip (MCU-Integrated) Energy-Measurement ICs, and Hall-Effect / Rogowski-Based Energy-Measurement ICs), Communication Interface (SPI, I²C, UART, and More), Accuracy Class (Class 0.1, Class 0.2, Class 0.5, and Class 1.0 and Above), End-Use Application (Smart Electricity Meters, Industrial Energy-Monitoring Equipment, Smart Plugs and Connected Appliances, EV Charging Stations, Renewable-Energy Inverters and Microgrids, Data Centers and Building-Management Systems), and Geography (North America, Europe, Asia-Pacific, Middle East and Africa, and South America). The Market Forecasts are Provided in Terms of Value (USD).
| Single-Phase Energy-Measurement ICs |
| Poly-Phase Energy-Measurement ICs |
| System-on-Chip (MCU-Integrated) Energy-Measurement ICs |
| Hall-Effect / Rogowski-Based Energy-Measurement ICs |
| SPI |
| I²C |
| UART |
| Other Communication Interfaces |
| Class 0.1 |
| Class 0.2 |
| Class 0.5 |
| Class 1.0 and Above |
| Smart Electricity Meters |
| Industrial Energy-Monitoring Equipment |
| Smart Plugs and Connected Appliances |
| EV Charging Stations |
| Renewable-Energy Inverters and Microgrids |
| Data Centers and Building-Management Systems |
| North America | United States | |
| Canada | ||
| Mexico | ||
| Europe | Germany | |
| United Kingdom | ||
| France | ||
| Russia | ||
| Rest of Europe | ||
| Asia-Pacific | China | |
| Japan | ||
| India | ||
| South Korea | ||
| Australia | ||
| Rest of Asia-Pacific | ||
| Middle East and Africa | Middle East | Saudi Arabia |
| United Arab Emirates | ||
| Rest of Middle East | ||
| Africa | South Africa | |
| Egypt | ||
| Rest of Africa | ||
| South America | Brazil | |
| Argentina | ||
| Rest of South America | ||
| By Product Type | Single-Phase Energy-Measurement ICs | ||
| Poly-Phase Energy-Measurement ICs | |||
| System-on-Chip (MCU-Integrated) Energy-Measurement ICs | |||
| Hall-Effect / Rogowski-Based Energy-Measurement ICs | |||
| By Communication Interface | SPI | ||
| I²C | |||
| UART | |||
| Other Communication Interfaces | |||
| By Accuracy Class | Class 0.1 | ||
| Class 0.2 | |||
| Class 0.5 | |||
| Class 1.0 and Above | |||
| By End-Use Application | Smart Electricity Meters | ||
| Industrial Energy-Monitoring Equipment | |||
| Smart Plugs and Connected Appliances | |||
| EV Charging Stations | |||
| Renewable-Energy Inverters and Microgrids | |||
| Data Centers and Building-Management Systems | |||
| By Geography | North America | United States | |
| Canada | |||
| Mexico | |||
| Europe | Germany | ||
| United Kingdom | |||
| France | |||
| Russia | |||
| Rest of Europe | |||
| Asia-Pacific | China | ||
| Japan | |||
| India | |||
| South Korea | |||
| Australia | |||
| Rest of Asia-Pacific | |||
| Middle East and Africa | Middle East | Saudi Arabia | |
| United Arab Emirates | |||
| Rest of Middle East | |||
| Africa | South Africa | ||
| Egypt | |||
| Rest of Africa | |||
| South America | Brazil | ||
| Argentina | |||
| Rest of South America | |||


Key Questions Answered in the Report
What is the projected value of the Energy Measurement IC market in 2031?
The Energy Measurement IC market is expected to reach USD 10.61 billion by 2031.
Which product type currently leads revenue share?
Poly-phase devices led with a 42.85% share in 2025.
Why are Class 0.1 devices gaining popularity?
EV charging stations and utility revenue meters now require revenue-grade precision, driving adoption of Class 0.1 chips.
Which communication interface is forecast to grow fastest?
UART is projected to expand at an 8.97% CAGR due to its compatibility with wireless modules.
What region is expected to post the highest growth rate?
The Middle East is forecast to grow at an 8.86% CAGR through 2031, fueled by smart-city initiatives.
How concentrated is the competitive landscape?
The combined share of the top five players is about 55%, yielding a market concentration score of 6.
Page last updated on:


