Trade Management Market Size and Share
Market Overview
| Study Period | 2020 - 2031 |
|---|---|
| Market Size (2026) | USD 2.84 Billion |
| Market Size (2031) | USD 3.43 Billion |
| Growth Rate (2026 - 2031) | 3.87% CAGR |
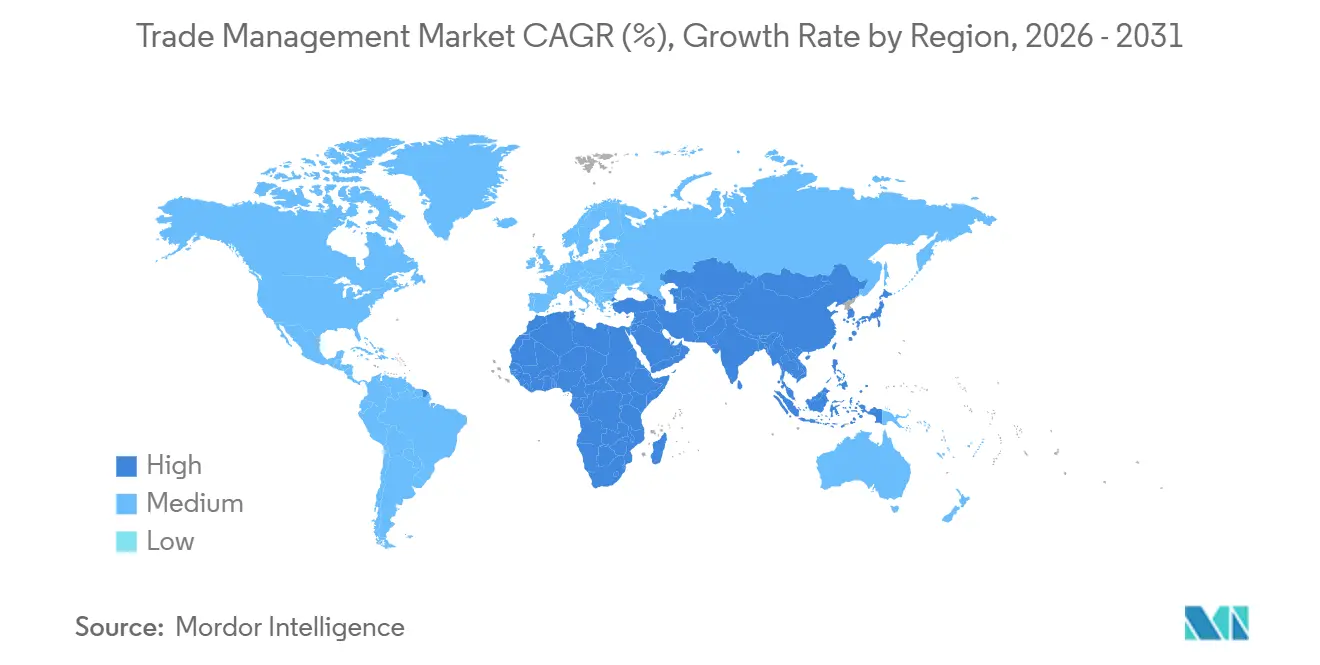
| Fastest Growing Market | Asia Pacific |
| Largest Market | North America |
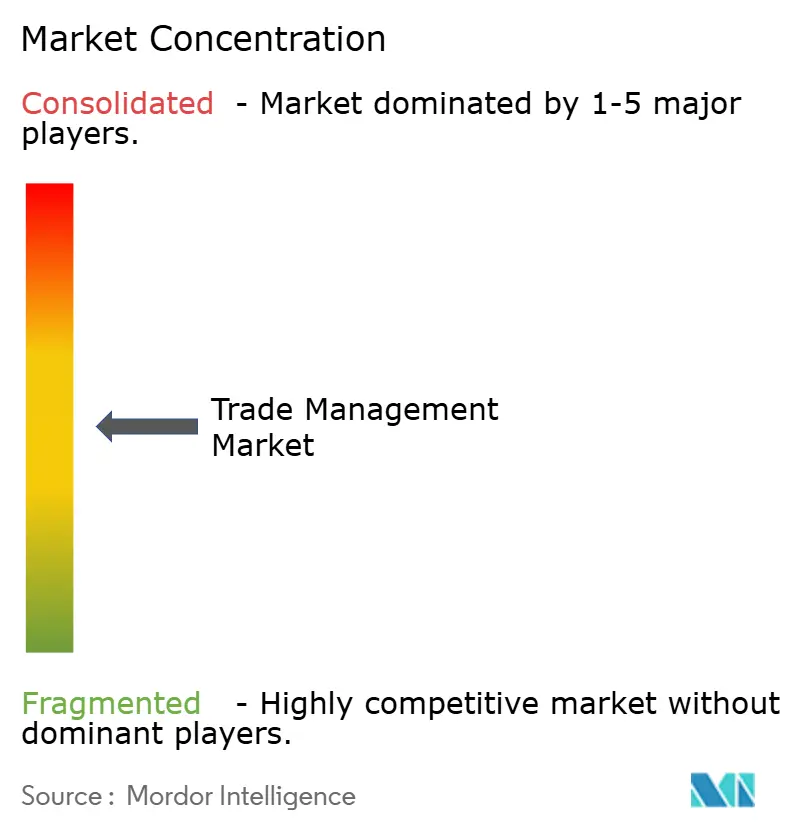
| Market Concentration | Medium |
Major Players *Disclaimer: Major Players sorted in no particular order Image © Mordor Intelligence. Reuse requires attribution under CC BY 4.0. | |
Trade Management Market Analysis by Mordor Intelligence
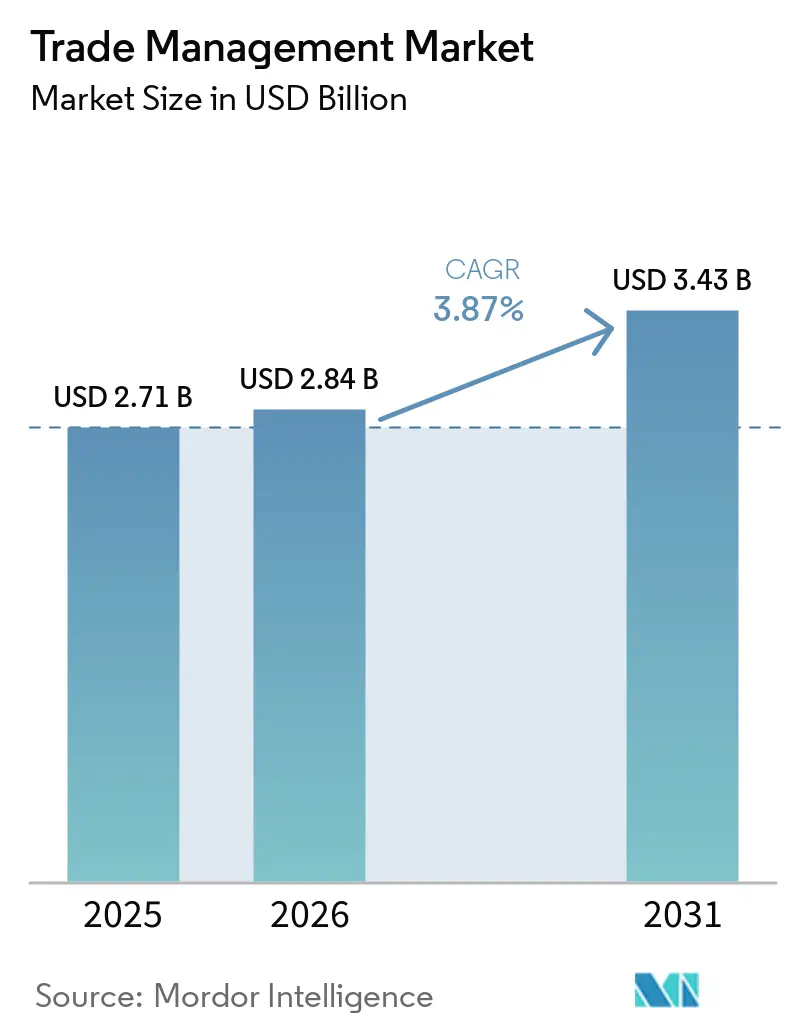
The Global Trade Management market size is projected to expand from USD 2.71 billion in 2025 and USD 2.84 billion in 2026 to USD 3.43 billion by 2031, registering a CAGR of 3.87% between 2026 and 2031.
The expansion reflects how tariff volatility, mandatory e-documentation, and next-generation free-trade agreements elevate compliance software from a cost center to a supply-chain control tower. Cloud-first customs portals in Canada and the United Kingdom sharpen digital expectations, while logistics software convergence allows shippers to optimize duty exposure and physical routing in one workflow. As governments link trade data to carbon and labor regulations, platforms that integrate environmental accounting with tariff management gain strategic importance. Consolidation among logistics leaders, illustrated by DSV’s Schenker purchase, intensifies competition on global reach and deep integration capabilities.
Key Report Takeaways
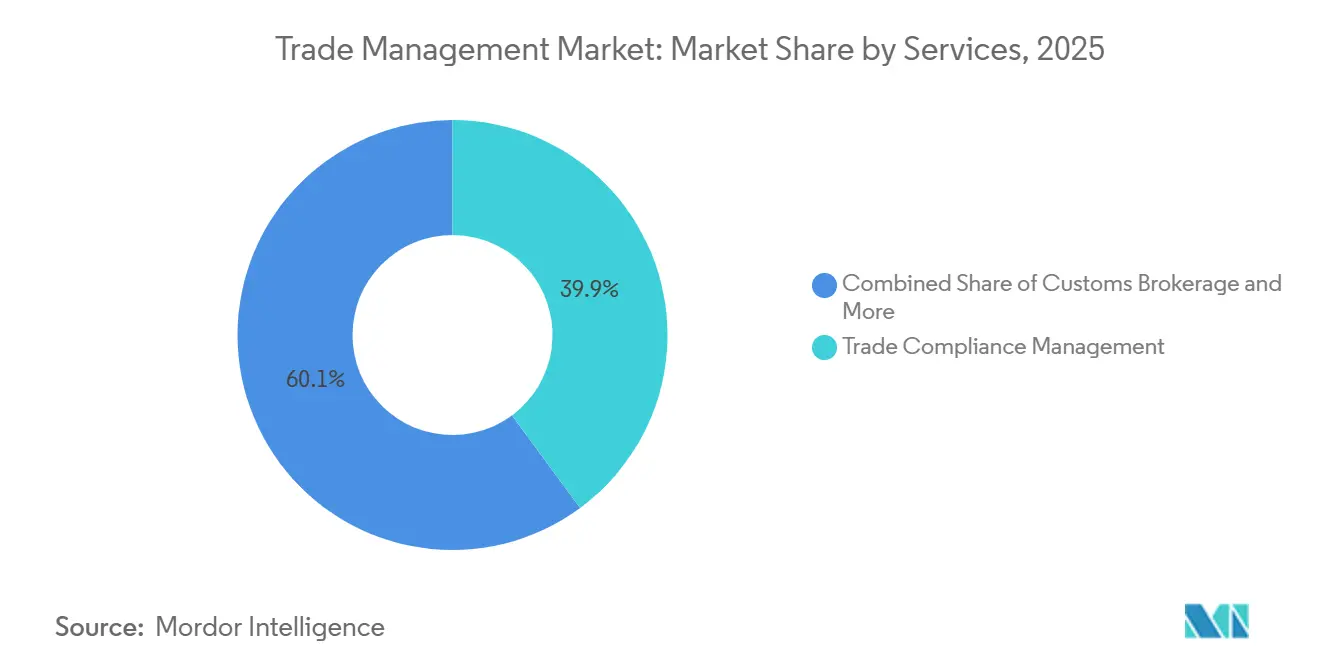
- By services, trade compliance management held 39.88% of the Global Trade Management market share in 2025; logistics and transportation management is projected to advance at a 5.51% CAGR through 2031.
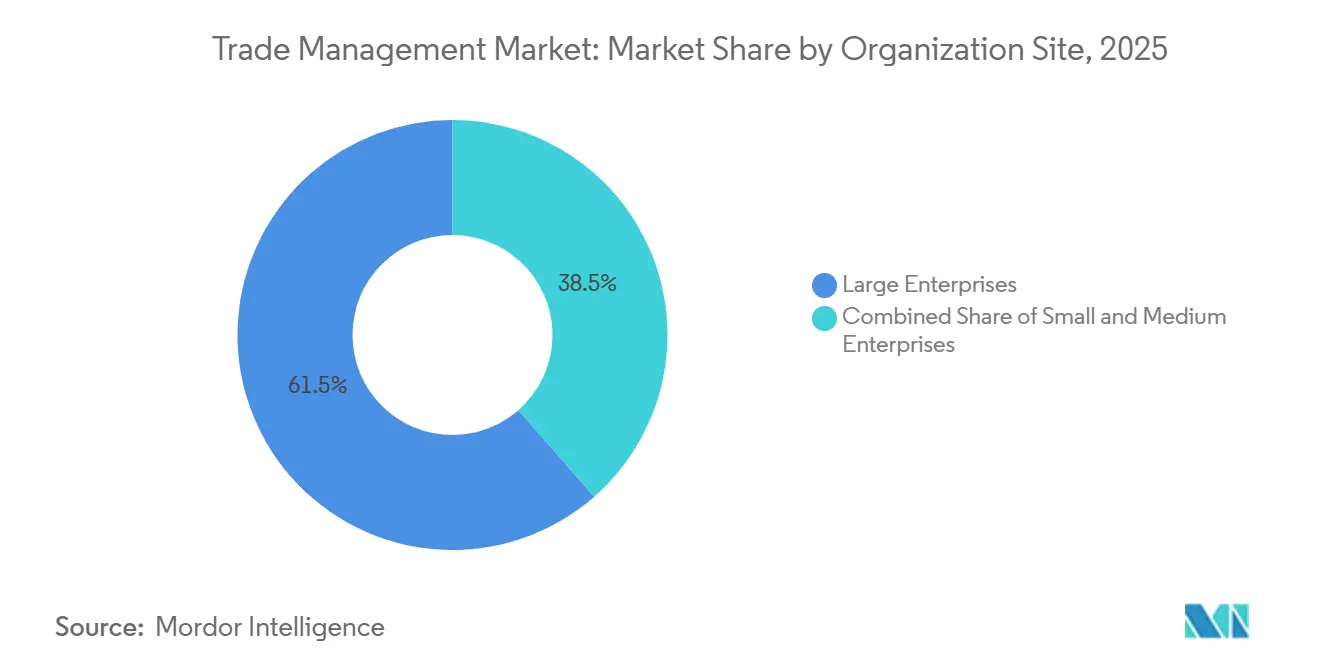
- By organization size, large enterprises accounted for 61.46% of the Global Trade Management market in 2025, small & medium enterprises recorded the fastest growth at a 4.27% CAGR during 2026-2031.
- By end-user, manufacturing commanded 28.32% of the Global Trade Management market size in 2025, whereas retail and e-commerce are forecast to expand at a 6.03% CAGR to 2031.
- By geography, North America led with 37.24% of the Global Trade Management market in 2025, while Asia-Pacific is the fastest-growing region at a 6.15% CAGR through 2031.
Note: Market size and forecast figures in this report are generated using Mordor Intelligence’s proprietary estimation framework, updated with the latest available data and insights as of January 2026.
Global Trade Management Market Trends and Insights
Drivers Impact Analysis*
| Driver | (~) % Impact on CAGR Forecast | Geographic Relevance | Impact Timeline |
|---|---|---|---|
| Proliferation of next-generation FTAs | +0.9 % | APAC & Africa | Medium term (2-4 years) |
| Escalating tariff & trade-remedy volatility | +0.7 % | US-China-EU corridors | Short term (≤ 2 years) |
| Cloud-native customs modernization programs | +0.6 % | North America & Europe | Medium term (2-4 years) |
| Global e-invoicing / e-document mandates | +0.5 % | EU, Latin America, APAC | Short term (≤ 2 years) |
| ESG-linked product-level traceability | +0.4 % | EU & North America | Long term (≥ 4 years) |
| Tokenized digital product passports | +0.3 % | EU pilots, select APAC | Long term (≥ 4 years) |
| Source: Mordor Intelligence | |||
Proliferation Of Next-Generation FTAs (CPTPP, AfCFTA, DEPA)
Mega-regional agreements reshape duty structures, requiring engines that can test multiple tariff scenarios in real time. RCEP alone is modeled to deliver USD 245 billion in annual income gains by 2030 and create 2.8 million jobs, proving the monetary incentive for automated agreement matching. CPTPP enlargement multiplies the “noodle-bowl” of overlapping preference rules, while AfCFTA’s 54-country customs alignment stimulates demand for adaptable platforms across Africa. DEPA pilots paperless trade norms that ripple into wider regulatory blueprints. Japan’s rapid spike in RCEP certificates during 2024 validates enterprise urgency for technology that traces component sourcing across multi-tier chains. Collectively, these agreements elevate Global Trade Management market adoption as firms pivot from passive compliance to revenue optimization.
Escalating Tariff & Trade-Remedy Volatility Since 2022
Unpredictable levies now move quicker than product-development cycles. Fifty-seven percent of supply-chain executives ranked changing policies as their top 2024 challenge. Section 301 actions, EU safeguards, and India’s sliding duties force companies to model landed-cost swings weekly. Duty-savings scenarios outshine clearance-time benefits, yet both depend on unified data. As multilateral consensus fades, enterprises view Global Trade Management market software less as a cost to avoid fines and more as analytics needed for sourcing shifts.
Cloud-Native Customs Modernization Programs (UK CDS, Canada CARM)
Government platforms now demand API-first connections that legacy systems cannot meet. The UK CDS processes over 250 million declarations annually through real-time risk scoring, enabling firms with modern trade platforms to clear goods 40 % faster than rivals. Canada’s phased CARM rollout mandates electronic bonds and detailed valuation logic, extending compliance into finance. These shifts accelerate Global Trade Management market upgrades as shippers prefer solutions already allowed by customs authorities.
Global E-Invoicing / E-Document Mandates Accelerating Digitization
The EU’s ViDA plan and Latin American precedents push structured data over PDFs, compelling platforms to support country-specific schemas. Digital documentation reduces courier spend and mismatched entries but raises audit exposure when invoice data links instantly to customs filings. The WTO projects up to a 2-percentage-point trade lift from such digitization. Vendors bundling compliant e-invoices within Global Trade Management market suites gain an advantage.
Restraints Impact Analysis*
| Restraint | (~) % Impact on CAGR Forecast | Geographic Relevance | Impact Timeline |
|---|---|---|---|
| Fragmented trade-data standards among ports & customs systems | -0.6 % | Emerging markets | Long term (≥ 4 years) |
| Rising cybersecurity & ransomware risks | -0.5 % | Digitally advanced markets | Medium term (2-4 years) |
| Protectionist export controls & FDI screening | -0.4 % | US, EU, China | Short term (≤ 2 years) |
| Lag in quantum-secure cryptography readiness | -0.2 % | Global | Long term (≥ 4 years) |
| Source: Mordor Intelligence | |||
Fragmented Trade-Data Standards Among Ports & Customs Systems
Despite EDIFACT and WCO data models, port-level deviations force vendors to code hundreds of bespoke adapters. Asia-Pacific Trade Facilitation Report 2024 argues harmonization could shave 13 % off trade costs, yet voluntary uptake slows progress. Vendors create abstraction layers, inflating development budgets and causing lock-in, tempering Global Trade Management market velocity.
Rising Cyber-Security & Ransomware Risks Across Connected Stacks
Manufacturers are prime ransomware targets, and integrated GTM-ERP links enlarge attack surfaces. Data-sovereignty laws complicate cloud deployment, as China and Russia restrict foreign server use. Security certifications raise cost barriers for SME buyers, pausing some upgrades despite clear functional need.
*Our forecasts treat driver/restraint impacts as directional, not additive. The impact forecasts reflect baseline growth, mix effects, and variable interactions.
Segment Analysis
By Services: Logistics Integration Reshapes Value Proposition
Trade Compliance Management garnered 39.88 % of the Global Trade Management market share in 2025, confirming its role as baseline functionality for every buyer. Nevertheless, Logistics and Transportation Management is set to outpace all other services at a 5.51 % CAGR through 2031, signaling customer appetite for unified duty, carrier, and milestone control. DHL’s Trend Radar cites generative AI and computer vision as edge technologies now embedded in shipment-level compliance workflows. Customs brokerage margins face compression where government portals enable direct filing, driving brokers toward higher-value consultancy[1]Asian Development Bank, “Economic Implications of the Regional Comprehensive Economic Partnership,” adb.org.
Secondarily, “Others” services chiefly supply-chain visibility and risk analytics gain traction because real-time geopolitical shifts demand continuous routing recalculations. Integrated dashboards that show tariff swings alongside vessel ETAs accelerate decision timeliness, further merging operational and regulatory data layers. As convergence rises, solution differentiation now tilts toward AI-powered classification engines and out-of-the-box FTA optimizers, nudging legacy standalone offerings down the value ladder within the Global Trade Management market


By Organization Size: Cloud Economics Accelerate SME Adoption
Large Enterprises contributed 61.46 % of the Global Trade Management market in 2025 due to global footprints and budgets that absorb USD 100 million deployments. Their configurations exploit duty-drawback modules and advanced analytics to re-sequence sourcing strategies quarterly. The Global Trade Management market size for small & medium enterprises represents the steeper growth curve at 4.27 % CAGR, swelling their revenue share as subscription models align cost with transaction counts.
API-first architecture lets SMEs bolt trade functions onto accounting platforms without middleware, slashing integration timelines from months to weeks. Asian Development Bank data show MSMEs form 98.9 % of firms in Central and West Asia but trail productivity; affordable compliance technology narrows this gap. European SMEs carry EUR 53 billion (USD 62.1 billion) in first-year digital-rule costs, prompting urgency for low-touch GTM packages. Consequently, cloud-native vendors focusing on SME onboarding enjoy the highest logo-count velocity in the Global Trade Management market[2]European Parliament Research Service, “Impact of EU legislation on SMEs,” europarl.europa.eu .
By End-User Industry: E-Commerce Velocity Demands New Architectures
Manufacturing held 28.32 % of the 2025 spend because multi-tier bills of material require granular origin tracking. Duty-drawback automation and foreign-trade-zone management remain the core rationale for software investment. Conversely, retail and e-commerce register the fastest CAGR at 6.03 %. High-volume, low-value parcel flows require millisecond duty calculation and automated return-refund logic, performance metrics that legacy freight-batch systems cannot meet.
Pharmaceuticals and Healthcare pay price premiums for validated temperature and FDA import modules, while Energy & Utilities riders need embedded carbon computations to meet CBAM disclosures. Food & Beverage buyers demand rapid sanitary-permit filing, illustrating how compliance depth, not shipment count, drives spend intensity. Across segments, duty optimization algorithms and integrated carbon accounting stand out as deal-winning features in the Global Trade Management market.
Geography Analysis
North America generated 37.24 % of 2025 revenue, powered by USMCA stability and deep export-control content libraries. The region’s large-enterprise dominance ensures high recurring license values, and Canada’s CARM shift prompts a wave of in-place upgrades. Asia-Pacific, however, posts a 6.15 % CAGR on the back of RCEP’s operational use and China’s AI-driven customs benchmarks. Japan’s certificate-issuance boom validates rapid ROI for FTA-aware platforms, underscoring how tariff savings finance software spend[3]World Customs Journal, “Application of Artificial Intelligence Technology in the Supervision of Customs Clearance,” worldcustomsjournal.org.
Europe sustains balanced growth as CBAM and ViDA force companies to overlay carbon metrics and real-time VAT reporting onto customs duties. Scandinavian early adopters pull ESG modules into mainstream tenders, setting a reference design for upcoming UK CBAM rules in 2027.
South America and the Middle East & Africa still trail on infrastructure, yet AfCFTA and modernization funds unlock incremental demand. Overall, regional digital readiness, not trade volume alone, predicts Global Trade Management market penetration.

Competitive Landscape
The Global Trade Management market remains moderately concentrated: the top five providers account for roughly 48% of 2025 revenue. DSV’s EUR 14.3 billion (USD 16.76 billion) Schenker buyout creates a logistics-plus-software giant operating across 90 countries and exemplifies the strategic push to pair physical networks with compliance engines. DHL leverages generative AI to cleanse data and draft customer quotes, trimming administrative cycles. Kuehne + Nagel redirects capital spend toward digital platforms, balancing cost control with innovation[4]Trans.info Reports, “Kuehne+Nagel eases cost-cutting program,” trans.info .
Mid-tier vendors pursue scale through M&A; Korber’s 2025 purchase of MercuryGate melds transportation and warehouse execution under one roof, offering end-to-end orchestration. API-native disruptors target SMEs with flat-rate subscriptions, but heavy certification costs and security audits create barriers.
Talent scarcity in trade analytics 64% of executives note shortages, which favors providers offering managed-service layers atop software. Overall, feature depth, government integration credentials, and cybersecurity posture determine win rates across the Global Trade Management market.
Trade Management Industry Leaders
Expeditors International of Washington, Inc.
Kuehne + Nagel
DHL Group
DSV
UPS
- *Disclaimer: Major Players sorted in no particular order

Recent Industry Developments
- March 2026: GXO Logistics (2026) advanced warehouse automation by deploying AI-driven systems and autonomous industrial trucks to improve supply chain productivity.
- February 2026: DHL Group expanded its global airfreight cold-chain network for pharmaceuticals (end-to-end temperature-controlled logistics visibility).
- June 2025: Dachser opened a new logistics center in Ingolstadt, Germany, expanding its European network capacity and strengthening cross-border distribution and contract logistics services.
- April 2025: DSV Completed acquisition of DB Schenker after EU approval, creating one of the world’s largest logistics and freight forwarding networks.


Global Trade Management Market Report Scope
| Trade Compliance Management |
| Customs Brokerage |
| Logistics and Transportation Management |
| Others (Supply Chain Visibility, Risk Management etc) |
| Large Enterprises |
| Small & Medium Enterprises (SMEs) |
| Manufacturing |
| Retail & E-commerce |
| Pharmaceuticals and Healthcare |
| Energy & Utilities |
| Food & Beverage |
| Other Industries |
| North America | United States |
| Canada | |
| Mexico | |
| South America | Brazil |
| Peru | |
| Chile | |
| Argentina | |
| Rest of South America | |
| Asia-Pacific | India |
| China | |
| Japan | |
| Australia | |
| South Korea | |
| South East Asia (Singapore, Malaysia, Thailand, Indonesia, Vietnam, and Philippines) | |
| Rest of Asia-Pacific | |
| Europe | United Kingdom |
| Germany | |
| France | |
| Spain | |
| Italy | |
| BENELUX (Belgium, Netherlands, and Luxembourg) | |
| NORDICS (Denmark, Finland, Iceland, Norway, and Sweden) | |
| Rest of Europe | |
| Middle East and Africa | United Arab of Emirates |
| Saudi Arabia | |
| South Africa | |
| Nigeria | |
| Rest of Middle East And Africa |
| By Services | Trade Compliance Management | |
| Customs Brokerage | ||
| Logistics and Transportation Management | ||
| Others (Supply Chain Visibility, Risk Management etc) | ||
| By Organization Size | Large Enterprises | |
| Small & Medium Enterprises (SMEs) | ||
| By End-User Industry | Manufacturing | |
| Retail & E-commerce | ||
| Pharmaceuticals and Healthcare | ||
| Energy & Utilities | ||
| Food & Beverage | ||
| Other Industries | ||
| By Geography | North America | United States |
| Canada | ||
| Mexico | ||
| South America | Brazil | |
| Peru | ||
| Chile | ||
| Argentina | ||
| Rest of South America | ||
| Asia-Pacific | India | |
| China | ||
| Japan | ||
| Australia | ||
| South Korea | ||
| South East Asia (Singapore, Malaysia, Thailand, Indonesia, Vietnam, and Philippines) | ||
| Rest of Asia-Pacific | ||
| Europe | United Kingdom | |
| Germany | ||
| France | ||
| Spain | ||
| Italy | ||
| BENELUX (Belgium, Netherlands, and Luxembourg) | ||
| NORDICS (Denmark, Finland, Iceland, Norway, and Sweden) | ||
| Rest of Europe | ||
| Middle East and Africa | United Arab of Emirates | |
| Saudi Arabia | ||
| South Africa | ||
| Nigeria | ||
| Rest of Middle East And Africa | ||


Key Questions Answered in the Report
What is the projected value of the Global Trade Management market in 2031?
The market is forecast to reach USD 3.43 billion by 2031.
Which service segment is growing the fastest?
Logistics and Transportation Management is expected to grow at a 5.51 % CAGR through 2031.
Why are SMEs adopting trade-management software more quickly than large enterprises?
Cloud subscriptions reduce upfront costs, enabling SMEs to access advanced compliance tools without major infrastructure spend.
How does ESG regulation influence platform adoption?
Carbon border taxes and product-level traceability rules push companies to embed emissions accounting inside trade-management workflows.
What major acquisition reshaped the competitive landscape in 2025?
DSV’s EUR 14.3 billion (USD 16.72 billion) purchase of Schenker created a global logistics-compliance powerhouse.
Page last updated on:


