Neem Extract Market Size and Share
Market Overview
| Study Period | 2021 - 2031 |
|---|---|
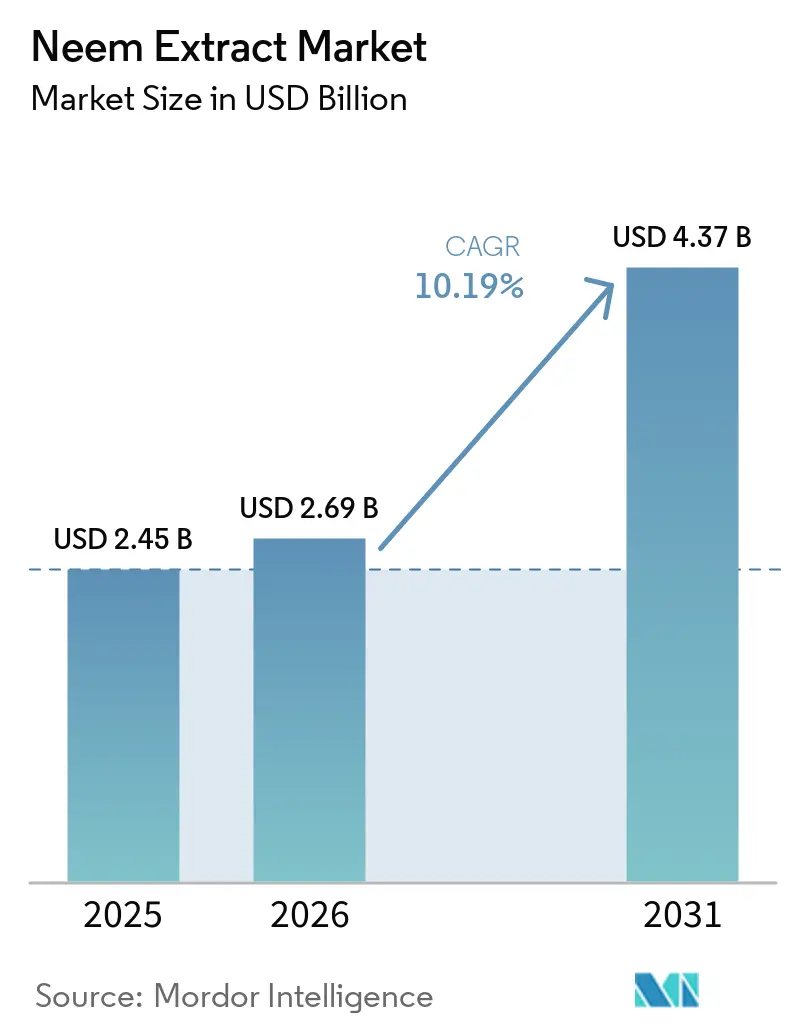
| Market Size (2026) | USD 2.69 Billion |
| Market Size (2031) | USD 4.37 Billion |
| Growth Rate (2026 - 2031) | 10.19% CAGR |
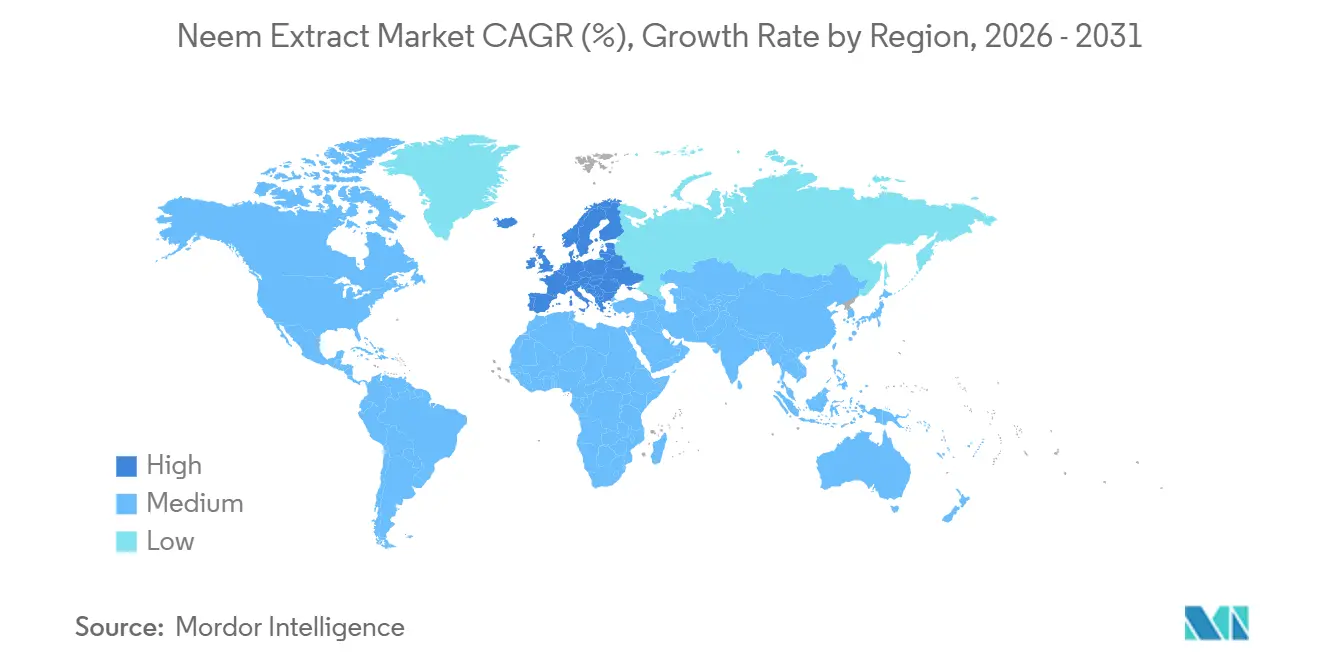
| Fastest Growing Market | Europe |
| Largest Market | Asia Pacific |
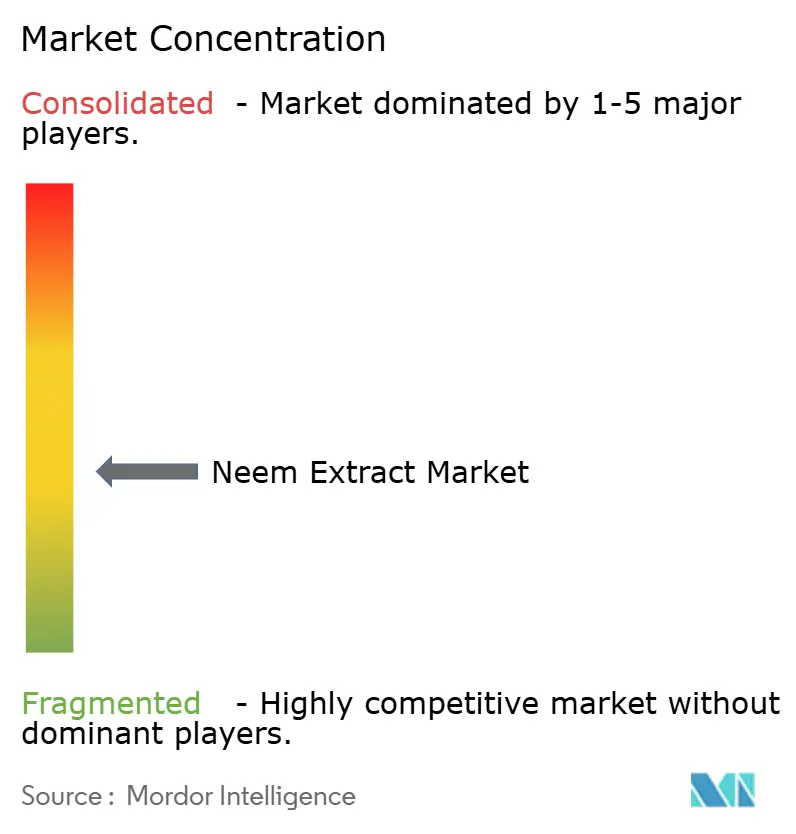
| Market Concentration | Medium |
Major Players *Disclaimer: Major Players sorted in no particular order Image © Mordor Intelligence. Reuse requires attribution under CC BY 4.0. | |
Neem Extract Market Analysis by Mordor Intelligence
The Neem Extract Market size was valued at USD 2.45 billion in 2025 and is estimated to grow from USD 2.69 billion in 2026 to reach USD 4.37 billion by 2031, at a CAGR of 10.19% during the forecast period (2026-2031). Heightened demand for botanical actives in cosmetics, tight raw-material supplies caused by India’s chronic neem-oil shortfall, and government mandates that lock in 17,000 tons of annual neem-oil consumption for fertilizer coating are reinforcing structural growth drivers for the neem extract market. At the same time, dieback disease wiped out more than 60% of mature neem trees in Telangana by December 2025, suppressing domestic seed availability and amplifying dependence on imports from East Africa. In Europe, the Green Deal objective of cutting synthetic pesticide use by 50% by 2030 is accelerating product registrations for neem-based biopesticides and is drawing investment into supercritical CO₂ extraction facilities that deliver solvent-free grades demanded by premium cosmetic brands. Competitive strategies are clustering around capacity expansion, controlled-release delivery technologies, and backward integration into seed procurement, ensuring that the neem extract market remains moderately concentrated yet innovation-oriented.
Key Report Takeaways
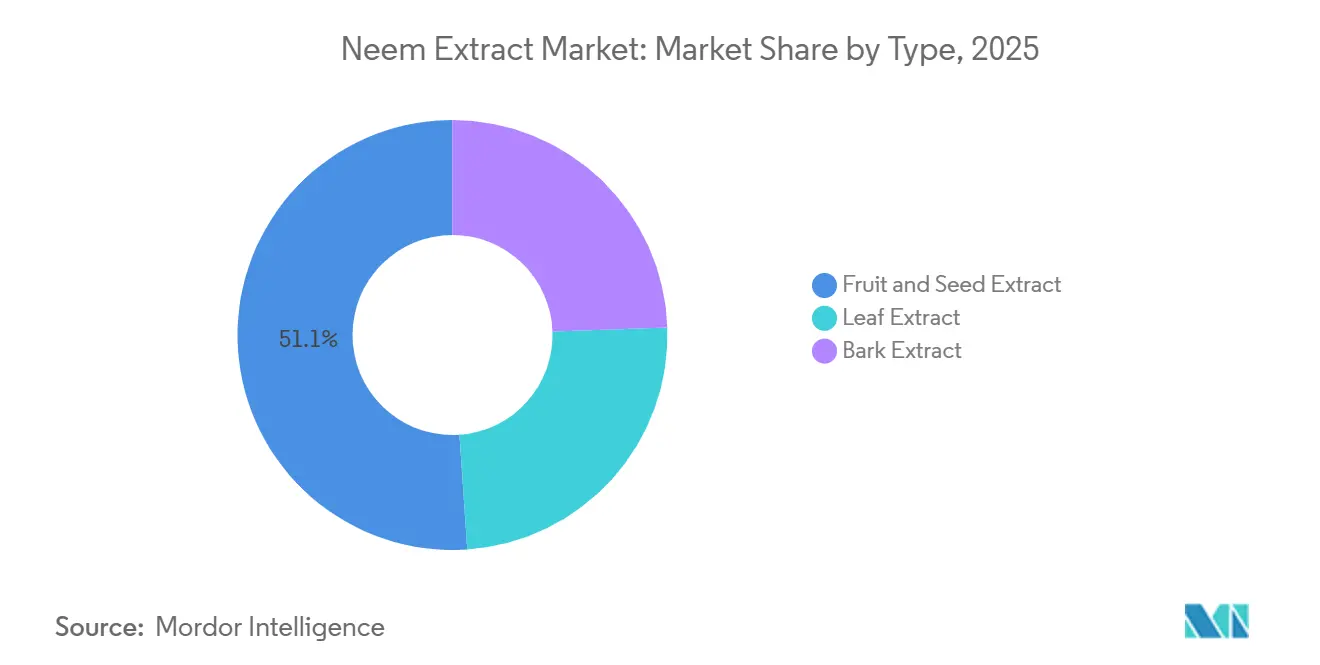
- By type, fruit and seed extract held 51.10% of the neem extract market share in 2025, while bark extract is anticipated to post an 11.34% CAGR through 2031.
- By application, pharmaceuticals and nutraceuticals accounted for 40.17% of 2025 revenue, whereas personal care and cosmetics is forecast to expand at an 11.87% CAGR to 2031.
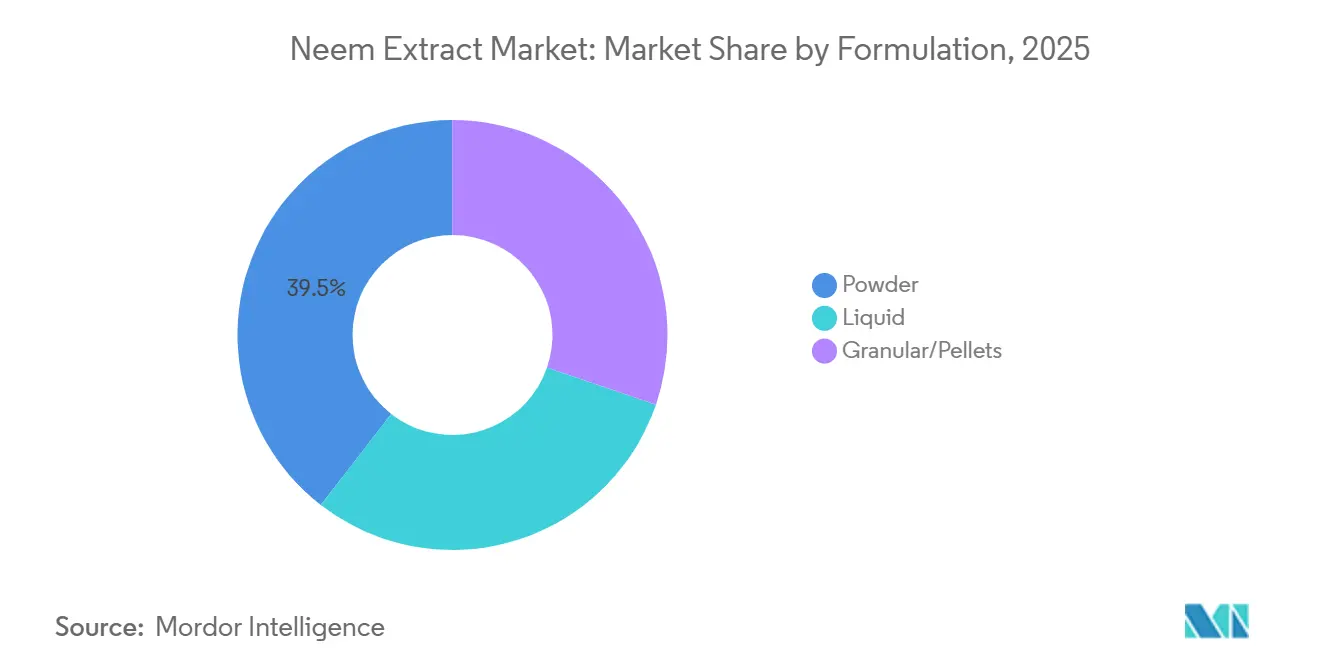
- By formulation, powder captured 39.50% of the neem extract market size in 2025 and is projected to grow at an 11.45% CAGR through 2031, aided by spray-drying advances that extend shelf life.
- By geography, Asia-Pacific contributed 54.20% of the 2025 volume, but Europe is projected to grow fastest at an 11.76% CAGR through 2031 on the back of Farm-to-Fork incentives.
Note: Market size and forecast figures in this report are generated using Mordor Intelligence’s proprietary estimation framework, updated with the latest available data and insights as of January 2026.
Global Neem Extract Market Trends and Insights
Driver Impact Analysis*
| Drivers | (~) % Impact on CAGR Forecast | Geographic Relevance | Impact Timeline |
|---|---|---|---|
| Rising demand for natural and organic personal-care products | +2.3% | Global, with concentration in North America and EU | Medium term (2-4 years) |
| Adoption of neem-based biopesticides in sustainable agriculture | +3.1% | APAC core, spill-over to Latin America and MEA | Long term (≥ 4 years) |
| Government mandates for neem-coated urea and other organic inputs | +2.7% | India (national), with pilot programs in Bangladesh and Nepal | Short term (≤ 2 years) |
| Surging awareness of neem's broad-spectrum medicinal benefits | +1.8% | Global, early gains in India, China, and Southeast Asia | Medium term (2-4 years) |
| Supercritical CO₂ extraction unlocking premium cosmetic grades | +1.5% | Europe and North America, technology transfer to APAC | Long term (≥ 4 years) |
| Source: Mordor Intelligence | |||
Rising Demand for Natural and Organic Personal-Care Products
Global clean-beauty reformulation cycles are intensifying as brands eliminate controversial preservatives. In vitro assays show neem extract inhibits Staphylococcus aureus and Candida albicans at minimum inhibitory concentrations below 500 µg/mL, allowing formulators to replace parabens and triclosan in cleansers and deodorants. European Union Regulation 2019/2164 now permits azadirachtin in certified organic cosmetics up to 0.1%, removing a regulatory bottleneck for the neem extract market. Supercritical CO₂ extraction yields 3.4 mg of azadirachtin per gram of seed, 40% higher than hexane methods, and avoids residual solvents that jeopardize safety compliance. Sustainability narratives also resonate: a mature neem tree sequesters about 20 kg of CO₂ annually while requiring minimal irrigation[1]Ministry of Agriculture of China, “List of Approved Biopesticides 2025,” moa.gov.cn. Reflecting this momentum, Himalaya Wellness launched new neem face-wash variants in 15 Southeast Asian markets in 2025 after recording double-digit growth in Indonesia and Vietnam.
Adoption of Neem-Based Biopesticides in Sustainable Agriculture
Integrated pest-management programs increasingly specify neem-based sprays as first-line interventions on organic acreage. Cotton trials in India’s Maharashtra region showed azadirachtin at 1,500 ppm cut bollworm infestation by 75% when applied every 10 days, matching pyrethroid performance without inducing resistance. The European Farm-to-Fork strategy offers subsidies that offset up to 60% of input costs for certified organic farmers, a direct stimulus to the neem extract market. China approved 12 new neem formulations for vegetables in 2025 as part of residue-reduction goals. Terramera’s Actigate™ delivery platform triples azadirachtin uptake and has captured 8% of the North American organic-vegetable sector since its 2018 EPA approval. Despite efficacy gains, azadirachtin photodegrades within seven days, compelling more frequent sprays and raising labor costs.
Government Mandates for Neem-Coated Urea and Other Organic Inputs
India’s 100% neem-coating requirement for subsidized urea consumes roughly 17,000 tons of oil each year, anchoring baseline demand for the neem extract market. The coating slows nitrogen release by up to 15%, boosting paddy and wheat yields 5-8% in field trials. Bangladesh introduced a 500,000 tons coated-urea pilot in 2024, and Nepal plans a 200,000 tons rollout by 2027. India, however, produces only 3,000 tons of neem oil annually, forcing processors to import from Benin, Ghana, and Tanzania—sources still free of the dieback pathogen devastating South Asian plantations. Domestic seed prices swung between INR 1,650 and INR 2,512 per quintal (USD 0.20–0.30 per kg) in 2025, complicating procurement forecasting.
Surging Awareness of Neem's Broad-Spectrum Medicinal Benefits
A 2024 randomized controlled trial with 80 type-2 diabetes patients showed that 500 mg of neem leaf extract twice daily for 12 weeks lowered HbA1c by 0.8 percentage points and fasting glucose by 22 mg/dL without serious events,. Nimbidiol isolated from neem bark cut urinary albumin excretion 40% in a diabetic-nephropathy rat model, underscoring pharmaceutical opportunities in the neem extract market. Neem-synthesized silver nanoparticles inhibited multidrug-resistant E. coli at 10 µg/mL, paving the way for antimicrobial dressings. The WHO Traditional Medicine Strategy 2024-2034 lists neem among priority botanicals for pharmacopoeia standardization, which will streamline regulatory reviews globally. Riding this wave, Himalaya Wellness placed neem-turmeric capsules in 12,000 Indian pharmacies within six months of their 2025 launch.
Restraint Impact Analysis*
| Restraints | (~) % Impact on CAGR Forecast | Geographic Relevance | Impact Timeline |
|---|---|---|---|
| Cheaper synthetic substitutes eroding price competitiveness | -1.9% | Global, most acute in price-sensitive APAC and Latin America markets | Short term (≤ 2 years) |
| Inconsistent quality and fragmented raw-material supply chains | -1.4% | India (national), with ripple effects in East Africa sourcing | Medium term (2-4 years) |
| Regulatory uncertainty on azadirachtin residue limits in food | -0.8% | European Union and North America | Long term (≥ 4 years) |
| Source: Mordor Intelligence | |||
Cheaper Synthetic Substitutes Eroding Price Competitiveness
Pyrethroids cost USD 8–12 per hectare versus USD 18–25 for neem sprays delivering similar pest control, undercutting neem adoption among price-sensitive farmers in India, Indonesia, and sub-Saharan Africa. Neonicotinoids achieve 30-45 days of systemic protection after a single soil dose, whereas azadirachtin degrades within a week under UV light, driving up application frequency and labor outlays 40-60%. In mass-market cosmetics, phenoxyethanol costs USD 3–5 per kg, yet standardized neem extract retails for USD 25–40 per kg, limiting inclusion rates to 1% or less in the neem extract market. The gap narrows inside the organic segment, where synthetic chemistry is barred, and consumers absorb a 15-20% premium, but certified acreage still accounts for under 2% of global cropland. UPL’s PlasmaNeem leverages cold-plasma activation to raise azadirachtin potency 30%, enabling lower field doses and partially offsetting cost disadvantages.
Inconsistent Quality and Fragmented Raw-Material Supply Chains
Laboratory audits show 30-40% of Indian neem-oil lots adulterated with palm or soybean oil, diluting azadirachtin and eroding purchaser trust. Dieback disease that ravaged Telangana plantations in 2025 is forecast to linger for a decade, shrinking seed supply and pushing processors toward Benin, Ghana, and Tanzania, where traceability protocols remain nascent. Price swings of 50% within a single harvest year complicate inventory hedging for formulators in the neem extract industry. Extraction yields vary 20-30% depending on seed maturity and storage, making batch-to-batch standardization arduous. Coromandel International’s 2024 acquisition of NACL Industries added 500 collection centers to stabilize seed origin tracking.
*Our forecasts treat driver/restraint impacts as directional, not additive. The impact forecasts reflect baseline growth, mix effects, and variable interactions.
Segment Analysis
By Type: Kernel Dominance Meets Bark's Cosmetic Surge
Fruit and seed extract secured 51.10% of 2025 revenue, anchoring the neem extract market, while bark extract is slated for an 11.34% CAGR to 2031, propelled by tannin-rich anti-aging serums. Kernel oils deliver 3,000–5,000 ppm azadirachtin, the backbone for biopesticides and pharma-grade inputs, whereas bark yields nimbidin profiles coveted by dermatology labs. Supercritical output fetches USD 80–120 per kg among prestige brands, contrasting with USD 15–25 for commodity hexane oil, illustrating price stratification inside the market.
India’s mandatory neem-coated urea program alone locks in structural demand for kernel oil, guaranteeing throughput even as dieback crimps local seed supply in the neem extract industry. Leaf extract, broadly used in nutraceutical tea bags with polyphenol content above 15%, is receiving interest from poultry formulators after studies showed 30% coccidiosis reduction at 1% inclusion. Nano-emulsion patents quadruple nimbidin skin penetration, letting formulators cut bark inclusion from 3% to 0.75% without efficacy loss, reinforcing bark extract’s premium trajectory.


By Application: Pharma's Dominance Challenged by Personal Care's Velocity
Pharmaceuticals and nutraceuticals commanded 40.17% of 2025 income, yet personal care and cosmetics is racing ahead at an 11.87% CAGR to 2031, underpinned by EU clearance for azadirachtin in organic cosmetics. Agrochemicals are riding Farm-to-Fork subsidies that pay up to 60% of neem product costs, driving acreage conversion across Spain, France, and Germany, and widening the neem extract market size in crop-protection use cases.
Food-and-beverage applications remain hamstrung by residue-limit ambiguity, although in-grain aflatoxin control tests are encouraging. Veterinary feed formulations continue to niche-scale as neem improves feed-conversion ratios by 8% in broilers, giving integrators a cost-effective alternative to antibiotics. Terramera’s Actigate™ illustrates innovation crossover: its delivery platform, initially built for agrochemicals, now informs high-bioavailability nutraceutical prototypes, underscoring convergence inside the neem extract industry.
By Formulation: Powder's Dual Advantage in Stability and Logistics
Powder captured 39.50% of 2025 revenue and is forecast to climb at an 11.45% CAGR through 2031, as spray-drying at 150-180 °C retains over 95% azadirachtin, eliminating cold-chain expense for the neem extract market. Liquids remain preferred for personal-care emulsions, yet they suffer seven-day photodegradation, prompting opaque bottles and refrigeration that add USD 2–4 per kg to logistics.
Granular products, notably neem-coated urea, slow nitrogen release by up to 15%, improving fertilizer efficiency in monsoon-fed paddy systems. Nano-encapsulation patent volumes rose 60% between 2022 and 2025; graphene-oxide carriers stretch field life from seven to 21 days, potentially shifting demand back to liquids for high-value fruit orchards.
Geography Analysis
Asia-Pacific generated 54.20% of 2025 revenue for the neem extract market, anchored by India’s fertilizer-coating mandate and China’s 12 new vegetable-crop registrations[2]FAO, “Agro-forestry Carbon Sequestration Data,” fao.org . Yet India’s output of just 3,000 tons of oil annually covers 15% of domestic needs, forcing imports from East Africa, whose plantations remain disease-free. ASEAN momentum is visible in Indonesia and Vietnam, where Himalaya face-wash volumes grew double digits in 2025. Japan’s specialty-crop exporters deploy neem to meet EU residue ceilings despite organic farmland totaling only 0.5% of arable land.
Europe is on track for the fastest growth at an 11.76% CAGR through 2031. Farm-to-Fork subsidies, plus Regulation 2019/2164’s cosmetic clearance, are spurring extraction-plant investments in Germany and Italy. Organic acreage here is expanding 8-12% annually, raising baseline neem demand, while firms such as Rovensa Next register neem blends in Latin America to ensure residue compliance for EU-bound fruit. North America’s uptake is led by the certified-organic strongholds of California and Oregon, where Certis USA’s Neemix 4.5 sells at a 30% premium.
Latin America leverages neem to clear EU and U.S. residue hurdles for export grapes and avocados. Brazil’s organic acreage jumped 20% in 2024, with neem forming 12% of the biopesticide mix. Argentina pilots neem-coated urea on alkaline Pampas soils to curb 25-30% nitrogen volatilization, though uptake is under 5% due to premium pricing. In the Middle East and Africa, Sudan, Kenya, and Tanzania supply seeds, while Saudi Arabia and South Africa incentivize biological imports, slowly widening regional participation in the neem extract market.

Competitive Landscape
The neem extract market is moderately fragmented. Raw material access is the primary moat; incumbents like Coromandel International and UPL Ltd. secured preferential seed pipelines through backward integration. Capacity expansion is a headline strategy: Coromandel earmarked INR 8 billion (USD 96 million) in 2024 to lift crop-protection turnover to INR 100 billion in five years. Technology differentiation follows: Terramera’s nano-delivery raises field efficacy threefold, targeting the displacement of 80% synthetic pesticides by 2030. UPL’s 2026 reorganization folded PlasmaNeem into a biologicals mega-division, signaling synergy between botanicals and synthetics.
Patent filings for nano-encapsulation and controlled release climbed 60% between 2022 and 2025, reaching 480 global families, suggesting sustained research and development spend inside the neem extract market. Compliance with ISO 9001 and tri-region organic certifications (USDA, EU, India) is now the baseline for exporters, as multinationals intensify supplier audits to weed out adulteration risk. White-space opportunities are emerging in food-grade antimicrobials, yet residue-limit ambiguity continues to delay fast-moving-consumer-goods launches.
Neem Extract Industry Leaders
E.I.D. Parry (India) Ltd.
Certis USA L.L.C.
Trifolio-M GmbH
PJ Margo Private Limited
FORTUNEBIOTECH
- *Disclaimer: Major Players sorted in no particular order

Recent Industry Developments
- November 2025: Andermatt Group partnered with Provivi to co-market pheromone and neem solutions in East Africa, expanding its biologicals roster.
- March 2025: Neeming Australia Pty Ltd. secured Australian Certified Organic status for its cold-pressed oil, unlocking distribution to certified farms.


Global Neem Extract Market Report Scope
Neem extract is derived from the seeds of the Neem tree (Azadirachta indica), recognized for its natural medicinal, pesticidal, and fungicidal properties. It is widely utilized in the agricultural industry to protect crops from pests and diseases.
The neem extract market is segmented by type, application, formulation, and geography. By type, the market is segmented into fruit and seed extract, leaf extract, and bark extract. By application, the market is segmented into agrochemicals (nbiopesticides, fertilizers), personal care and cosmetics, pharmaceuticals and nutraceuticals, food and beverage additives, animal feed and veterinary, and other industrial uses. By formulation, the market is segmented into liquid, powder, and granular/pellets. The report also covers the market size and forecasts for the neem extract market in 17 countries across major regions. For each segment, the market sizing and forecasts have been done based on revenue (USD).
| Fruit and Seed Extract |
| Leaf Extract |
| Bark Extract |
| Agrochemicals (Biopesticides, Fertilizers) |
| Personal Care and Cosmetics |
| Pharmaceuticals and Nutraceuticals |
| Food and Beverage Additives |
| Animal Feed and Veterinary |
| Other Industrial Uses |
| Liquid |
| Powder |
| Granular/Pellets |
| Asia-Pacific | India |
| China | |
| Japan | |
| Australia | |
| ASEAN Countries | |
| Rest of Asia-Pacific | |
| North America | United States |
| Canada | |
| Mexico | |
| Europe | Germany |
| United Kingdom | |
| France | |
| Italy | |
| Spain | |
| Russia | |
| Rest of Europe | |
| South America | Brazil |
| Argentina | |
| Rest of South America | |
| Middle-East and Africa | Saudi Arabia |
| South Africa | |
| Rest of Middle-East and Africa |
| By Type | Fruit and Seed Extract | |
| Leaf Extract | ||
| Bark Extract | ||
| By Application | Agrochemicals (Biopesticides, Fertilizers) | |
| Personal Care and Cosmetics | ||
| Pharmaceuticals and Nutraceuticals | ||
| Food and Beverage Additives | ||
| Animal Feed and Veterinary | ||
| Other Industrial Uses | ||
| By Formulation | Liquid | |
| Powder | ||
| Granular/Pellets | ||
| By Geography | Asia-Pacific | India |
| China | ||
| Japan | ||
| Australia | ||
| ASEAN Countries | ||
| Rest of Asia-Pacific | ||
| North America | United States | |
| Canada | ||
| Mexico | ||
| Europe | Germany | |
| United Kingdom | ||
| France | ||
| Italy | ||
| Spain | ||
| Russia | ||
| Rest of Europe | ||
| South America | Brazil | |
| Argentina | ||
| Rest of South America | ||
| Middle-East and Africa | Saudi Arabia | |
| South Africa | ||
| Rest of Middle-East and Africa | ||


Key Questions Answered in the Report
How large is the neem extract market expected to be by 2031?
The Neem Extract Market size was valued at USD 2.45 billion in 2025 and is estimated to grow from USD 2.69 billion in 2026 to reach USD 4.37 billion by 2031, at a CAGR of 10.19% during the forecast period (2026-2031).
Which segment grows fastest in neem extract applications?
Personal care and cosmetics is projected to expand at an 11.87% CAGR, overtaking pharmaceutical growth.
Why does India import neem oil despite vast tree coverage?
Dieback disease and a structural shortfall mean India produces 3,000 tons annually against a 20,000 tons domestic requirement.
What limits neem’s adoption versus synthetic pesticides?
Higher per-hectare costs and shorter field persistence make neem less competitive where price sensitivity is high.
How does supercritical CO₂ extraction benefit cosmetic-grade neem?
It boosts azadirachtin yield by 40% and removes solvent residues, meeting clean-beauty safety demands.
Page last updated on:


