Freight Brokerage Services Market Size and Share
Market Overview
| Study Period | 2020 - 2031 |
|---|---|
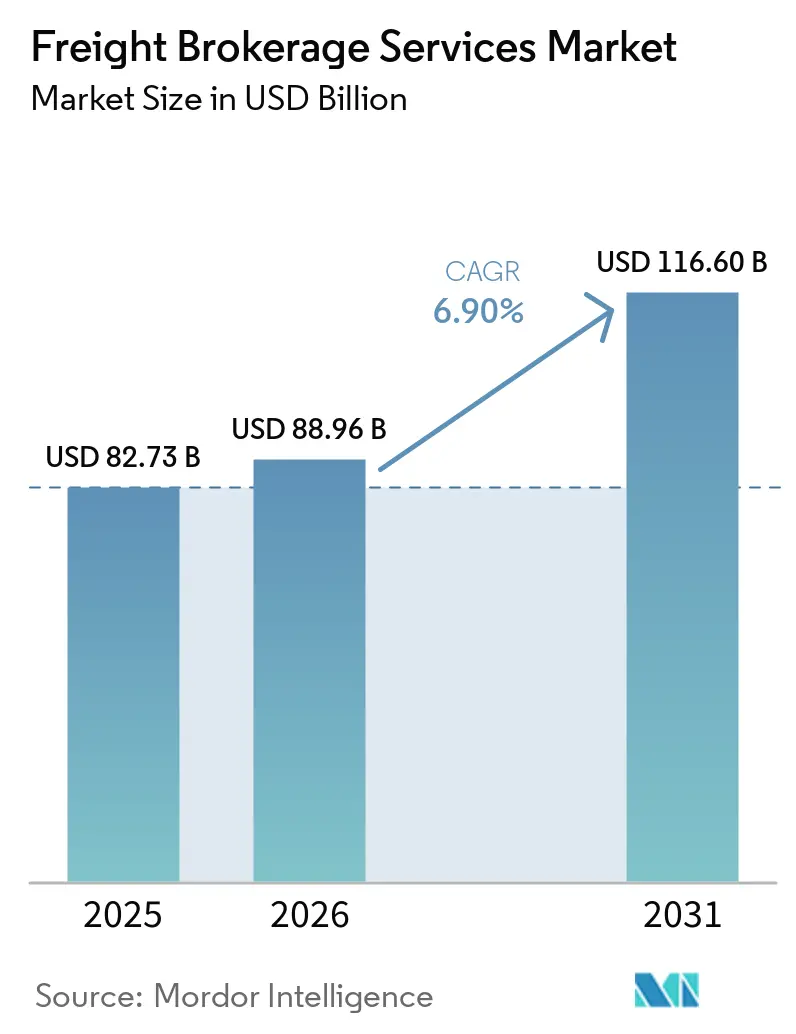
| Market Size (2026) | USD 88.96 Billion |
| Market Size (2031) | USD 116.60 Billion |
| Growth Rate (2026 - 2031) | 6.90% CAGR |
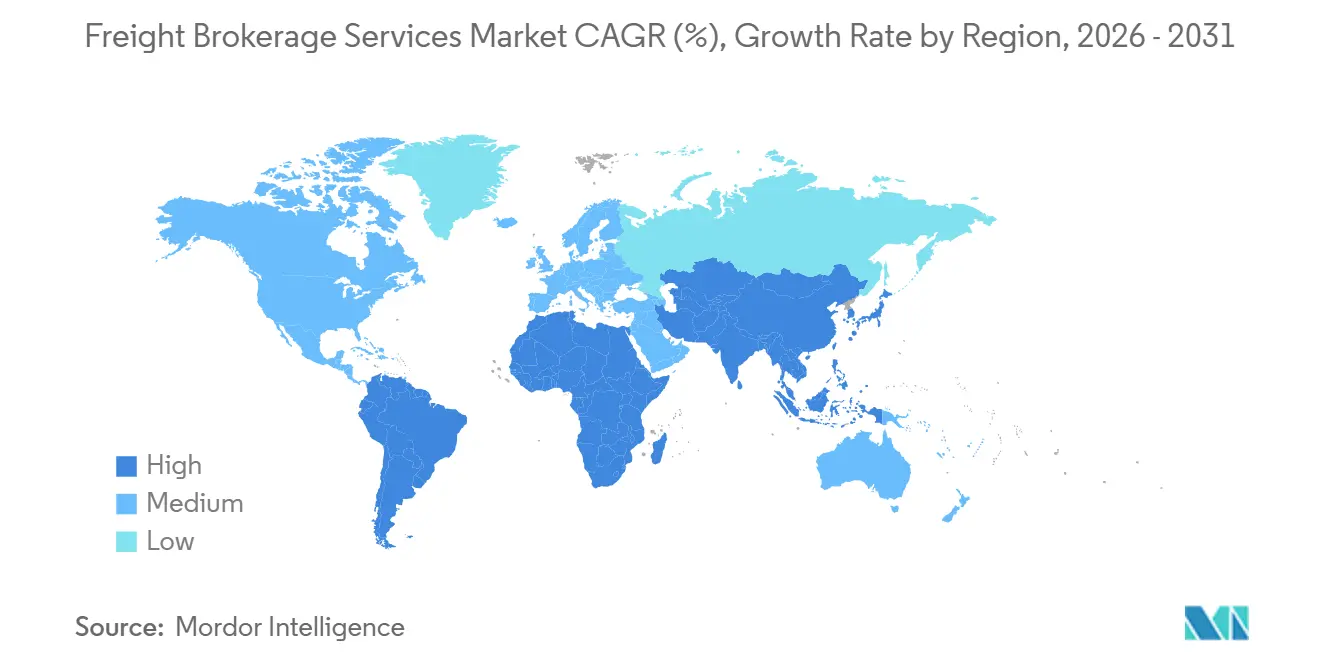
| Fastest Growing Market | Asia Pacific |
| Largest Market | Asia Pacific |
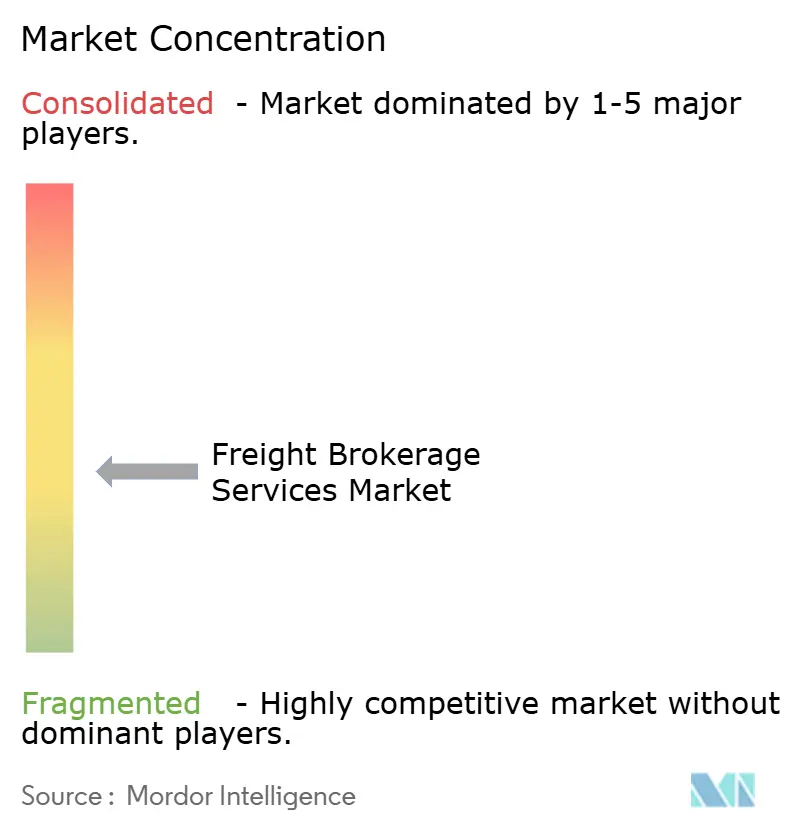
| Market Concentration | Medium |
Major Players *Disclaimer: Major Players sorted in no particular order Image © Mordor Intelligence. Reuse requires attribution under CC BY 4.0. | |
Freight Brokerage Services Market Analysis by Mordor Intelligence
The Freight Brokerage Services Market Size is expected to increase from USD 82.73 billion in 2025 to USD 88.96 billion in 2026 and reach USD 116.60 billion by 2031, growing at a CAGR of 6.90% over 2026-2031.
Nearshoring is shortening average haul lengths, omni-channel retail is fragmenting shipment lots, and mega-mergers between brokers and global 3PLs are redefining competitive boundaries. Brokers now balance relationship-driven enterprise contracts with algorithmic self-service portals that capture long-tail shippers at scale. Asia-Pacific leads current demand thanks to regulatory harmonization across ASEAN corridors, while North America is the testing ground for bilingual cross-border platforms that manage US-Mexico trade. Consolidation, illustrated by the DSV-DB Schenker tie-up, allows large players to amortize technology costs and secure preferential carrier pricing, yet venture-funded digital entrants keep pressure on margins by automating quoting, booking, and cargo-insurance attachment. Headline risks include container-rate whiplash, inventory destocking through 2026, and cybersecurity mandates that demand multi-factor authentication upgrades.
Key Report Takeaways
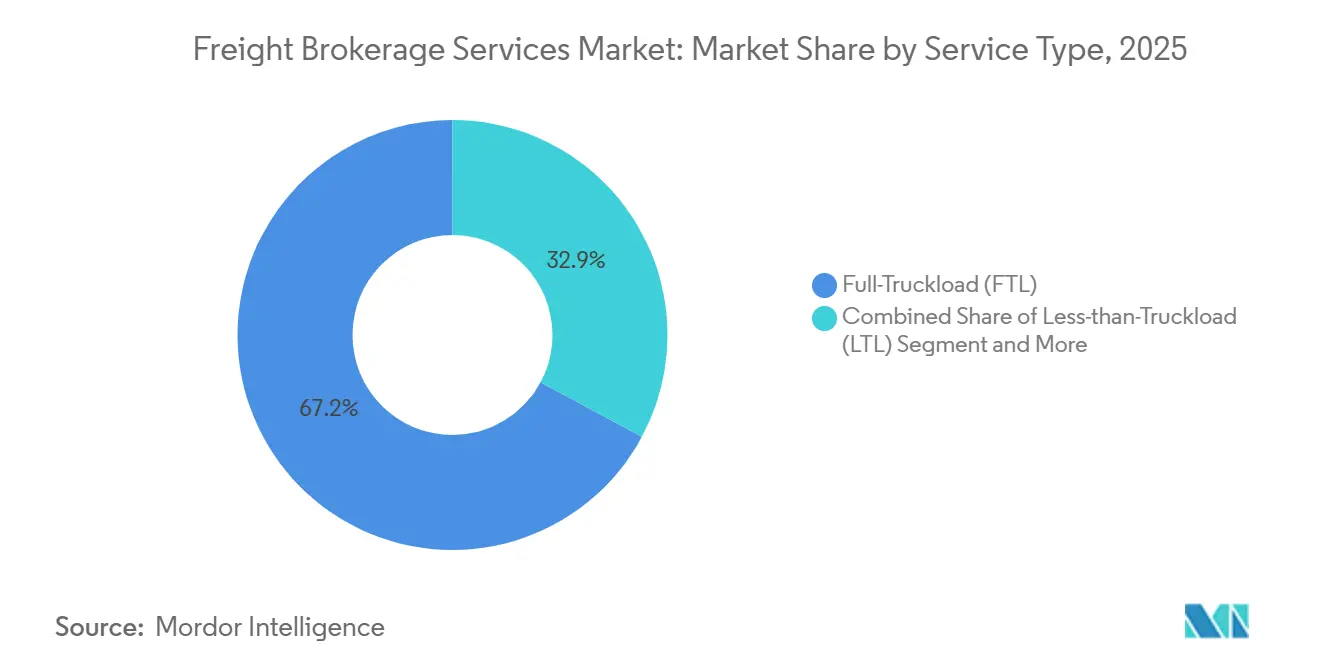
- By service, Full-Truckload held 67.15% of the freight brokerage services market share in 2025, whereas Less-than-Truckload shipments are projected to expand at a 10.05% CAGR to 2031.
- By equipment/trailer type, Dry Van commanded 46.04% share of the freight brokerage services market size in 2025, while Refrigerated Van is advancing at an 11.15% CAGR through 2031.
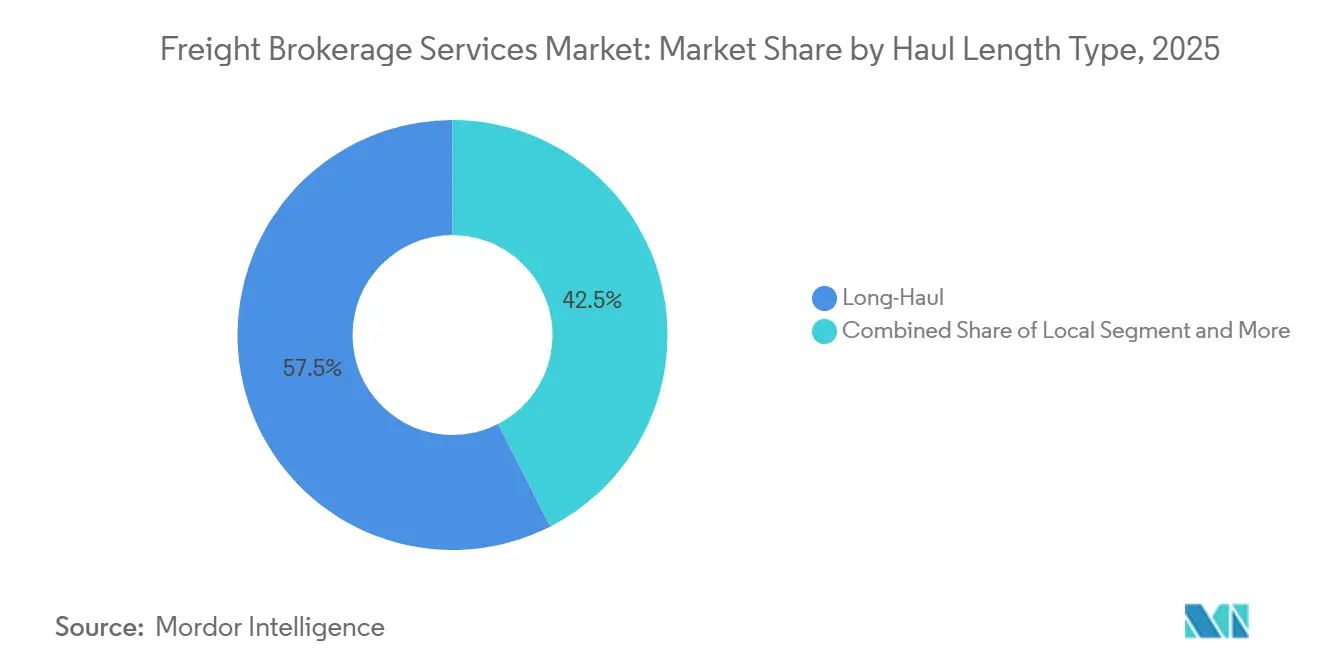
- By haul length, Long-Haul moves captured 57.53% of the freight brokerage services market in 2025, while Local haul is forecast to grow at a 10.91% CAGR during 2026-2031.
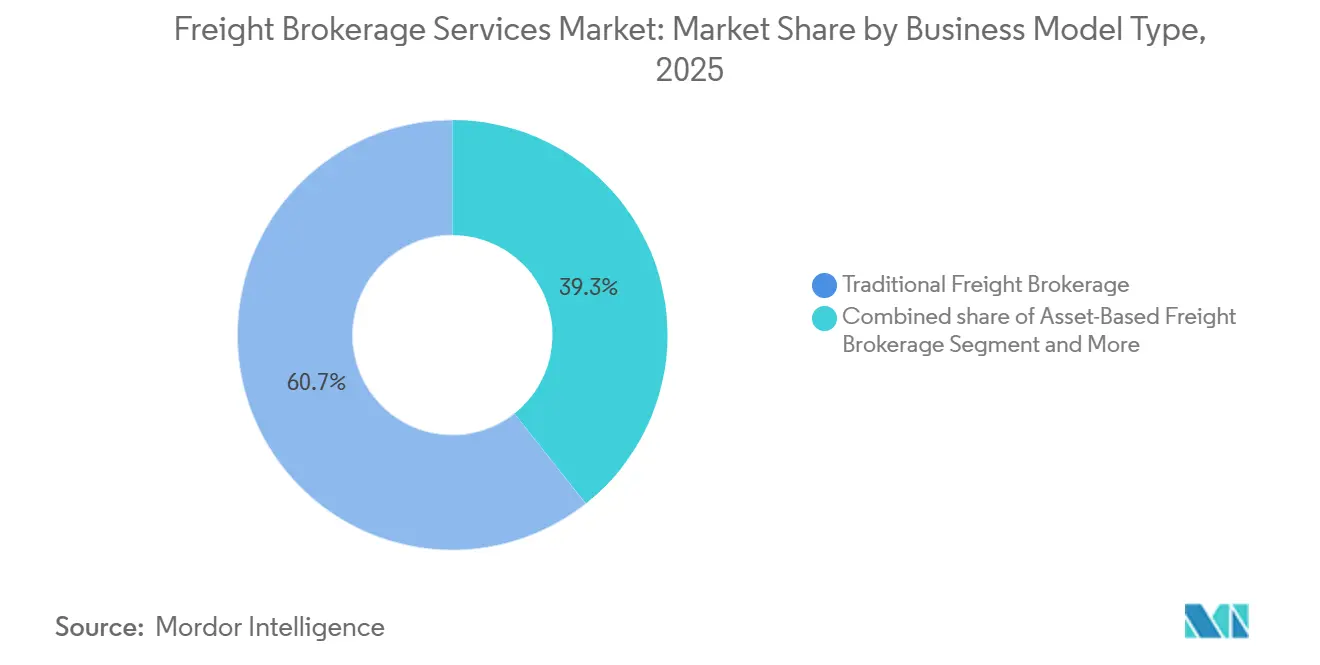
- By business model, traditional brokerage accounted for 60.66% of market share in 2025, yet digital brokerage models are accelerating at a 20.46% CAGR.
- By end-user industry, Retail/FMCG led with 30.78% market share in 2025, whereas E-commerce fulfillment is growing at a 15.68% CAGR through 2031.
- By customer size, large enterprises retained 56.13% share in 2025, even as small businesses recorded the fastest 12.18% CAGR through 2031.
- By region, Asia-Pacific accounted for 44.13% freight brokerage services market in 2025 and is projected to post a 9.03% CAGR over the forecast horizon.
Note: Market size and forecast figures in this report are generated using Mordor Intelligence’s proprietary estimation framework, updated with the latest available data and insights as of January 2026.
Global Freight Brokerage Services Market Trends and Insights
Drivers Impact Analysis*
| Driver | (~) % Impact on CAGR Forecast | Geographic Relevance | Impact Timeline |
|---|---|---|---|
| Nearshoring and reshoring shift volumes toward cross-border short-haul corridors | +1.5% | North America (US-Mexico), Europe-Eastern Europe | Medium term (2-4 years) |
| Omni-channel retail boom intensifies middle-mile brokerage demand | +1.3% | Global, concentrated in North America, Europe, and Asia-Pacific urban centers | Short term (≤ 2 years) |
| SME self-service portals expand long-tail customer penetration | +1.1% | Global, led by North America and the Asia-Pacific | Medium term (2-4 years) |
| Mega-mergers between brokers and global 3PLs unlock one-stop capacity networks | +1.0% | Global, strongest in Europe and North America | Long term (≥ 4 years) |
| Real-time cargo-insurance APIs create new high-margin ancillary revenue | +0.8% | North America, Europe, and expanding to Asia-Pacific | Medium term (2-4 years) |
| Carbon-linked freight derivatives attract ESG-focused shippers to broker platforms | +0.7% | Europe, North America, with spillover to Asia-Pacific | Long term (≥ 4 years) |
| Source: Mordor Intelligence | |||
Nearshoring and Reshoring Shift Volumes Toward Cross-Border Short-Haul Corridors
Nearshoring and reshoring trends are reducing reliance on long-haul intercontinental routes and increasing the importance of cross-border short-haul corridors. Manufacturing shifts to regions like Mexico and Eastern Europe are shortening shipment distances while increasing shipment frequency and border-crossing volumes. This creates challenges in customs clearance, documentation, and compliance, elevating brokers' roles. Brokers with bilingual skills, compliance expertise, and integrated customs solutions, such as CARM-ready platforms, are better positioned to capture higher margins. Dual-qualified carrier networks and a focus on resilience over cost minimization further enhance brokers' competitive advantage, driving sustained demand in regional trade corridors [1]“Nearshoring in North America: Supply Chain Shift to Mexico.” 2024, U.S. International Trade Administration, trade.gov/nearshoring-north-america.
Omni-Channel Retail Boom Intensifies Middle-Mile Brokerage Demand
The growth of omni-channel retail is reshaping logistics networks by emphasizing speed, flexibility, and inventory responsiveness. Retailers' commitments to same-day or next-day delivery require frequent replenishment of stores and fulfillment centers within tight timeframes, increasing the importance of middle-mile logistics. Freight brokers play a key role in optimizing routes and consolidating loads, aided by advanced routing algorithms that reduce empty miles and transportation costs. Digital platforms and real-time visibility tools are essential for managing high-frequency shipments, while dynamic demand-capacity matching enhances responsiveness during demand spikes. As inventory decentralization continues, brokerage services enabling efficient middle-mile operations are expected to see sustained growth and strategic importance [2]“Freight Analysis Framework (FAF5) Update: Freight Flows and Forecasts.” 2024, U.S. Department of Transportation, ops.fhwa.dot.gov/freight/freight_analysis/faf/.
SME Self-Service Portals Expand Long-Tail Customer Penetration
The digitization of freight brokerage is expanding access to small and medium enterprises (SMEs), significantly increasing the addressable market. Self-service platforms powered by APIs enable instant quoting, booking, and dispatch, reducing manual processing times and allowing brokers to profitably serve low-volume customers. By integrating services like cargo insurance, real-time tracking, and automated credit checks into a single interface, brokers enhance customer experience and revenue per transaction. These platforms improve retention by embedding logistics into SMEs’ daily operations and generate data to refine pricing algorithms and demand forecasting. As SMEs adopt digital solutions globally, brokers with scalable platforms are well-positioned to capture demand and drive growth efficiently.
Mega-Mergers Between Brokers and Global 3PLs Unlock One-Stop Capacity Networks
Consolidation in the freight brokerage and logistics industry is driving the creation of integrated, end-to-end service providers. Mergers between brokers and global third-party logistics (3PL) firms are forming logistics ecosystems that span air, ocean, and surface transportation, enabling multimodal shipment management through a single platform. This integration enhances convenience, visibility, and operational efficiency while providing cost advantages through extensive carrier networks and contracted freight volumes. Mid-sized brokers face risks of disintermediation unless they differentiate through specialization or strategic partnerships. These mergers also accelerate digital transformation, with the industry expected to consolidate further, leaving dominant players to control global freight flows as smaller brokers adapt through collaboration or niche expertise.
Restraints Impact Analysis*
| Restraint | (~) % Impact on CAGR Forecast | Geographic Relevance | Impact Timeline |
|---|---|---|---|
| Container-rate whiplash compresses spot-margin windows | -1.1% | Global, most acute in transpacific and transatlantic lanes | Short term (≤ 2 years) |
| Inventory destocking post-pandemic dampens shipment volumes 2024-2026 | -0.9% | Global, concentrated in North America and Europe | Short term (≤ 2 years) |
| Algorithmic capacity hoarding by digital giants sidelines mid-tier brokers | -0.7% | North America, Europe | Medium term (2-4 years) |
| Stricter digital-identity & cybersecurity mandates (eIDAS 2.0, NIST 800-63) spike compliance spend | -0.6% | Europe (eIDAS 2.0), North America (NIST 800-63) | Medium term (2-4 years) |
| Source: Mordor Intelligence | |||
Container-Rate Whiplash Compresses Spot-Margin Windows
Extreme volatility in container freight rates is causing significant margin uncertainty for freight brokers, particularly in short-cycle spot markets. Fluctuations of up to USD 5,000 in 40-foot container rates within weeks force brokers to frequently re-quote shipments, disrupting pricing consistency and increasing operational workload. In port-to-distribution center (DC) drayage lanes, where margins are already narrow, such changes can reduce gross margins by over 100 basis points. Brokers also face heightened counterparty risk when contracted rates diverge from market prices, with limited options for hedging or accurate forecasting. As a result, brokers are adopting dynamic pricing tools and shorter contract cycles, though these measures may not fully offset the impact of sustained volatility.[3]“Freight Delivery System Annual Report.” 2024, Federal Maritime Commission, fmc.gov/reports/.
Inventory Destocking Post-Pandemic Dampens Shipment Volumes 2024-2026
The ongoing inventory correction cycle across major retail sectors is reducing freight demand, creating short-term challenges for the freight brokerage market. Large retailers, particularly in apparel and electronics, are cutting excess inventory by up to 12 weeks, leading to decreased replenishment activity and an 18% decline in less-than-truckload (LTL) tenders in affected categories. This results in lower transaction throughput and reduced revenue opportunities for brokers, especially those reliant on retail-driven freight flows. Additionally, reduced demand compresses brokerage spreads as carriers compete for fewer loads. While this cyclical destocking phase is expected to normalize, it introduces near-term uncertainty and slows market growth.
*Our forecasts treat driver/restraint impacts as directional, not additive. The impact forecasts reflect baseline growth, mix effects, and variable interactions.
Segment Analysis
By Service: Shipment Fragmentation Accelerates LTL Growth
Less-than-Truckload shipments are expanding at a 10.05% CAGR, lifting the freight brokerage services market as retailers shift to SKU-level replenishment and shared-truckload programs push trailer cube utilization to 92%. Multi-stop algorithms widen broker gross margin to 16% on consolidated routes, while Full-Truckload continues to anchor 67.15% market share but sees its freight brokerage services market share decline two percentage points as shippers diversify modes and demand flexible capacity options.
Brokers protect legacy FTL contracts by integrating dynamic mode-shifting rules in Transportation Management Systems that let enterprise clients flip orders between FTL and LTL without re-tendering, deepening account stickiness, and smoothing revenue. LTL’s structural tailwinds, parcel surcharge avoidance, omni-channel velocity, and nearshoring-driven lane compression ensure it captures an outsized portion of incremental demand[4]“Freight Facts and Figures 2024.”, 2024, U.S. Bureau of Transportation Statistics, bts.gov/product/freight-facts-and-figures.


By Equipment/Trailer Type: Cold-Chain Expansion Favors Reefer Fleets
Dry Vans held 46.04% of the 2025 freight brokerage services market, but Refrigerated Van is compounding at an 11.15% CAGR as pharma GDP mandates and fresh-food e-commerce require lane-level temperature telemetry. Brokers embed IoT probes that record five-minute temperature intervals and archive digital proof of compliance, reducing claims and securing preferred-shipper status with vaccine producers.
Capitalizing on premium yields, providers are reallocating roughly 7% of dry-van inventory to insulated or hybrid-cooling retrofits, balancing asset risk while pursuing higher-margin cold-chain lanes. The freight brokerage services market for Reefer loads is slated to rise, and equipment specialization strengthens competitive moats because shippers prize partners who master seal integrity, regulatory paperwork, and contingency routing.
By Haul Length: Urban Logistics Drives Local Surge
Long-Haul routes over 500 miles still generate 57.53% of 2025 revenue, yet Local trips under 100 miles are rising at a 10.91% CAGR as same-day delivery and micro-fulfillment centers shorten distribution radii. Brokers deploy city-zone scorecards that rank carriers on curbside compliance and emission class, then layer congestion premiums that lift gross margin by 200 basis points.
Regional hauls between 100–500 miles absorb nearshoring spillover, linking maquiladora clusters to U.S. distribution hubs, while Long-Haul margins compress when backhauls evaporate. Successful brokers pre-stage drop trailers near border cross-docks, tighten driver dwell, and couple outbound retail with inbound returns, sustaining per-mile yield as the freight brokerage services market attached to Local lanes is projected to rise significantly.
By Business Model: Platforms Capture Long-Tail Growth
Traditional brokers controlled 60.66% of 2025 turnover, but digital platforms are scaling at a 20.46% CAGR by automating pricing, booking, and paperwork for small businesses that value speed over dedicated reps. Self-service portals slash transaction costs more than 70%, making low-volume shippers profitable and expanding overall market reach.
Incumbents respond with “phygital” hybrids, quoting for routine tenders backed by specialists for exception freight, preserving high-touch enterprise service while harvesting low-touch volume. API depth, data latency, and rate-engine agility have become decisive factors in award decisions, and the freight brokerage services market booked through portals is on course to triple by 2031.
By End-User Industry: E-Commerce Fulfillment Outpaces Store-Centric Retail
Retail, FMCG, and wholesale distribution delivered 30.78% of 2025 revenue, yet e-commerce and 3PL fulfillment are expanding at a 15.68% CAGR as direct-to-consumer brands scale subscription models that require frequent resupply. Brokers integrate storefront APIs so that, once cart weight thresholds are met, shipments auto-populate tenders, tightening cycle time and boosting asset turns.
Industrial verticals, manufacturing, automotive, and construction, provide steady but slower growth tied to capital-spending cycles, while healthcare and life sciences command premium pricing for strict compliance. The freight brokerage services market size generated by e-commerce moves is set to top the chart, and long-duration reefer contracts with medical device makers stabilize broker cash flow through automatic renewals tied to regulatory milestones.
By Customer Size: Small Business Momentum Validates Platform Economics
Large enterprises with freight spend above USD 100 million retained 56.13% of 2025 revenue, yet SMBs with freight spend under USD 10 million are growing at a 12.18% CAGR, accounting for 37% of 2026 tender expansion as transparent portals lower engagement friction. AI-based credit scoring approves 92% of new applicants within 60 seconds, slashing onboarding costs and capturing loyalty before rivals react.
Mid-market shippers oscillate between high-touch and self-service, creating cross-sell opportunities for brokers through tiered bundles. By 2031, the freight brokerage services market attributable to SMBs is forecasted to rise significantly, and dual-model operators able to balance enterprise depth with long-tail breadth will command superior lifetime value.
Geography Analysis
Asia-Pacific sustains 44.13% revenue share, with the freight brokerage services market size in the region and forecasts to rise with 9.03% CAGR by 2031. ASEAN customs harmonization trims border clearance to 30 minutes, encouraging small Thai and Vietnamese shippers to adopt digital brokerage apps. Indian GST e-way bill automation injects transparency, attracting foreign retailers who demand compliant middle-mile partners.
North America re-orients around nearshoring; US-Mexico surface lanes see cross-border LTL loads jump 18% YoY. Brokers employing bilingual call centers and certified FAST carriers reduce border dwell by 42%, winning Mode Shift awards from automotive OEMs. Canada’s CARM rollout compels brokers to embed tariff calculators, lifting compliance service revenue by USD 120 million in 2026 alone.
Europe grapples with ETS Phase 4. Brokers bundling intermodal rail with truck legs cut carbon intensity 42% versus truck-only, earning premium placement on retailer bid boards. eIDAS-driven authentication investment spikes, but early movers enjoy brand lift among pharma shippers who require auditable chain-of-custody logs.
South America and MEA, although sub-10% of global turnover, present frontier upside. Brazilian BR-163 highway paving unlocks soy export corridors, while GCC rail link projects promise multi-modal brokerage opportunities tied to oil-to-chemicals diversification.
Mordor Intelligence provides coverage of the freight brokerage services market across other key regional markets, including North America and Europe, each with their regulatory frameworks and demand patterns. Detailed country-level analysis extends to Canada, Spain, Mexico, Germany, Spain, Netherlands, Poland, and Saudi Arabia incorporating local coverage and market participation, as required.

Competitive Landscape
Consolidation lifts the combined revenue share of the top five players to roughly 40%. The freight brokerage services market remains moderately concentrated because thousands of regional agents still serve niche geographies and specialized cargo. Yet scale economics are tilting power: DSV-DB Schenker’s USD 46 billion top line buys algorithm development and carrier rebates unreachable to independents.
Incumbents deploy API marketplaces: RXO’s cargo insurance widget, Kuehne+Nagel’s carbon offset selector, and J.B. Hunt’s capacity forecast dashboard. Digital challengers counter with zero-margin entry loads and monetization via embedded fintech factoring, fuel cards, and insurance.
Regulatory headwinds favor capitalized players. FMCSA’s proposed USD 150,000 bond hikes may expel 12% of small United States brokers. EU cyber-certification costs top USD 2 million for pan-EU operators; only diversified brokers can dilute that spend across business lines. Mid-tiers respond by clustering into buying groups that pool compliance, carrier vetting, and TMS licensing.
Freight Brokerage Services Industry Leaders
C.H. Robinson Worldwide Inc
Total Quality Logistics LLC
RXO Inc.
Landstar System Inc.
J.B. Hunt Transport Services Inc.
- *Disclaimer: Major Players sorted in no particular order

Recent Industry Developments
- March 2025: Kuehne+Nagel embedded real-time cargo-insurance APIs, boosting attachment take-up to 34%.
- February 2025: ArcBest leveraged automated pricing to raise asset-light margin 150 bps year over year.
- December 2024: RXO finalized Coyote integration, locking USD 50 million technology synergies.
- September 2024: DSV closed its USD 17 billion DB Schenker buyout, forming a multimodal powerhouse


Global Freight Brokerage Services Market Report Scope
| Full-Truckload (FTL) |
| Less-than-Truckload (LTL) |
| Others |
| Dry Van |
| Refrigerated Van |
| Flatbed / Step-Deck |
| Tanker (Bulk Liquid and Chemical) |
| Others |
| Long-Haul (More than 500 miles) |
| Regional (100-500 miles) |
| Local (Less than 100 miles) |
| Traditional Freight Brokerage |
| Asset-Based Freight Brokerage |
| Agent Model Freight Brokerage |
| Digital Freight Brokerage |
| Manufacturing and Automotive |
| Construction and Infrastructure Projects |
| Oil, Gas, Mining and Chemicals |
| Agriculture and Food / Beverage |
| Retail, FMCG and Wholesale Distribution |
| Healthcare and Pharmaceuticals |
| E-commerce and 3PL Fulfilment |
| Other End-User Industry |
| Large Enterprise Shippers (More than USD 100 M) |
| Mid-Market Shippers (USD 10-100 M) |
| Small Businesses (Less than USD 10 M) |
| North America | United States |
| Canada | |
| Mexico | |
| South America | Brazil |
| Peru | |
| Chile | |
| Argentina | |
| Rest of South America | |
| Asia-Pacific | India |
| China | |
| Japan | |
| Australia | |
| South Korea | |
| South East Asia (Singapore, Malaysia, Thailand, Indonesia, Vietnam, and Philippines) | |
| Rest of Asia-Pacific | |
| Europe | United Kingdom |
| Germany | |
| France | |
| Spain | |
| Italy | |
| BENELUX (Belgium, Netherlands, and Luxembourg) | |
| NORDICS (Denmark, Finland, Iceland, Norway, and Sweden) | |
| Rest of Europe | |
| Middle East and Africa | United Arab of Emirates |
| Saudi Arabia | |
| South Africa | |
| Nigeria | |
| Rest of Middle East And Africa |
| By Service | Full-Truckload (FTL) | |
| Less-than-Truckload (LTL) | ||
| Others | ||
| By Equipment / Trailer Type | Dry Van | |
| Refrigerated Van | ||
| Flatbed / Step-Deck | ||
| Tanker (Bulk Liquid and Chemical) | ||
| Others | ||
| By Haul Length | Long-Haul (More than 500 miles) | |
| Regional (100-500 miles) | ||
| Local (Less than 100 miles) | ||
| By Business Model | Traditional Freight Brokerage | |
| Asset-Based Freight Brokerage | ||
| Agent Model Freight Brokerage | ||
| Digital Freight Brokerage | ||
| By End-User Industry | Manufacturing and Automotive | |
| Construction and Infrastructure Projects | ||
| Oil, Gas, Mining and Chemicals | ||
| Agriculture and Food / Beverage | ||
| Retail, FMCG and Wholesale Distribution | ||
| Healthcare and Pharmaceuticals | ||
| E-commerce and 3PL Fulfilment | ||
| Other End-User Industry | ||
| By Customer Size | Large Enterprise Shippers (More than USD 100 M) | |
| Mid-Market Shippers (USD 10-100 M) | ||
| Small Businesses (Less than USD 10 M) | ||
| By Geography | North America | United States |
| Canada | ||
| Mexico | ||
| South America | Brazil | |
| Peru | ||
| Chile | ||
| Argentina | ||
| Rest of South America | ||
| Asia-Pacific | India | |
| China | ||
| Japan | ||
| Australia | ||
| South Korea | ||
| South East Asia (Singapore, Malaysia, Thailand, Indonesia, Vietnam, and Philippines) | ||
| Rest of Asia-Pacific | ||
| Europe | United Kingdom | |
| Germany | ||
| France | ||
| Spain | ||
| Italy | ||
| BENELUX (Belgium, Netherlands, and Luxembourg) | ||
| NORDICS (Denmark, Finland, Iceland, Norway, and Sweden) | ||
| Rest of Europe | ||
| Middle East and Africa | United Arab of Emirates | |
| Saudi Arabia | ||
| South Africa | ||
| Nigeria | ||
| Rest of Middle East And Africa | ||


Key Questions Answered in the Report
What is the projected freight brokerage services market size by 2031?
The freight brokerage services market is forecast to reach USD 116.60 billion by 2031.
Which region is expanding fastest?
Asia-Pacific is growing at a 9.03% CAGR, fueled by regional trade harmonization and digital platform uptake.
Which service segment shows the strongest growth?
Less-than-Truckload services are advancing at 10.05% CAGR due to shipment fragmentation in omni-channel retail.
How are mega-mergers affecting competition?
Tie-ups like DSV-DB Schenker create one-stop multimodal networks that challenge mid-tier brokers on scale and technology.
Why are refrigerated vans gaining share?
Cold-chain investments in pharmaceuticals and fresh-food e-commerce are driving an 11.15% CAGR for Reefer equipment.
What compliance trends are shaping broker technology investment?
Cyber-security standards such as eIDAS 2.0 and NIST 800-63 require biometric logins and continuous monitoring, raising tech spend but offering a security-led differentiator.
Page last updated on:


