Asia-Pacific Freight Brokerage Services Market Size and Share
Market Overview
| Study Period | 2020 - 2031 |
|---|---|
| Forecast Data Period | 2026 - 2031 |
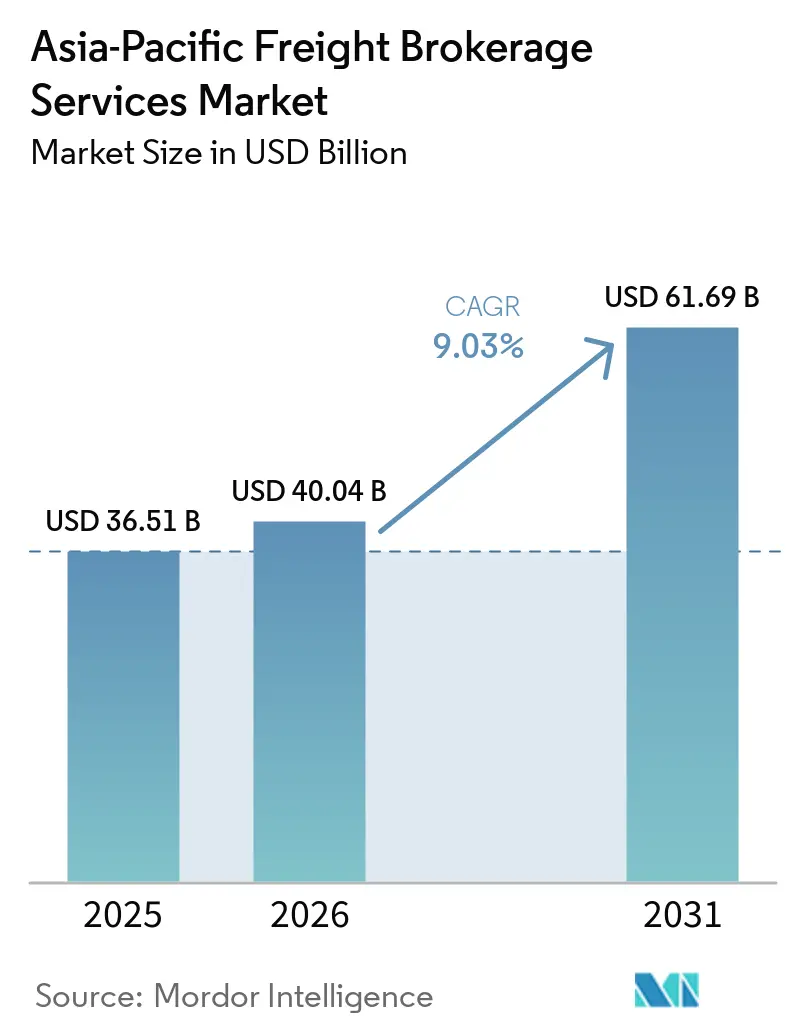
| Base Year Market Size (2025) | USD 36.51 Billion |
| Market Size (2026) | USD 40.04 Billion |
| Market Size (2031) | USD 61.69 Billion |
| Growth Rate (2026 - 2031) | 9.03% CAGR |
| Market Concentration | Medium |
Major Players
*Disclaimer: Major Players sorted in no particular order Image © Mordor Intelligence. Reuse requires attribution under CC BY 4.0. |
|
Asia-Pacific Freight Brokerage Services Market Analysis by Mordor Intelligence
The Asia-Pacific Freight Brokerage Market Size is expected to grow from USD 36.51 billion in 2025 to USD 40.04 billion in 2026 and is forecast to reach USD 61.69 billion by 2031 at 9.03% CAGR over 2026-2031.
Manufacturing relocation into inland Chinese provinces, the Gati Shakti digital permit program, and RCEP-enabled tariff harmonization are lengthening haul lanes and expanding the margin pools that brokers can tap through optimized load matching. Shippers are choosing direct road moves over congested ports, while high-capacity green highway rest areas accelerate the switch to electric trucks and lower carrier operating costs. Telematics-driven insurance rebates compress carrier premiums by up to 25%, allowing brokers to secure lower contract rates that translate into higher spreads. Digital platforms that aggregate real-time data at scale already channel a growing share of cross-border mini-consignments, shifting competitive advantage away from paper-based intermediaries and toward brokers with end-to-end visibility and instant pricing tools.
Key Report Takeaways
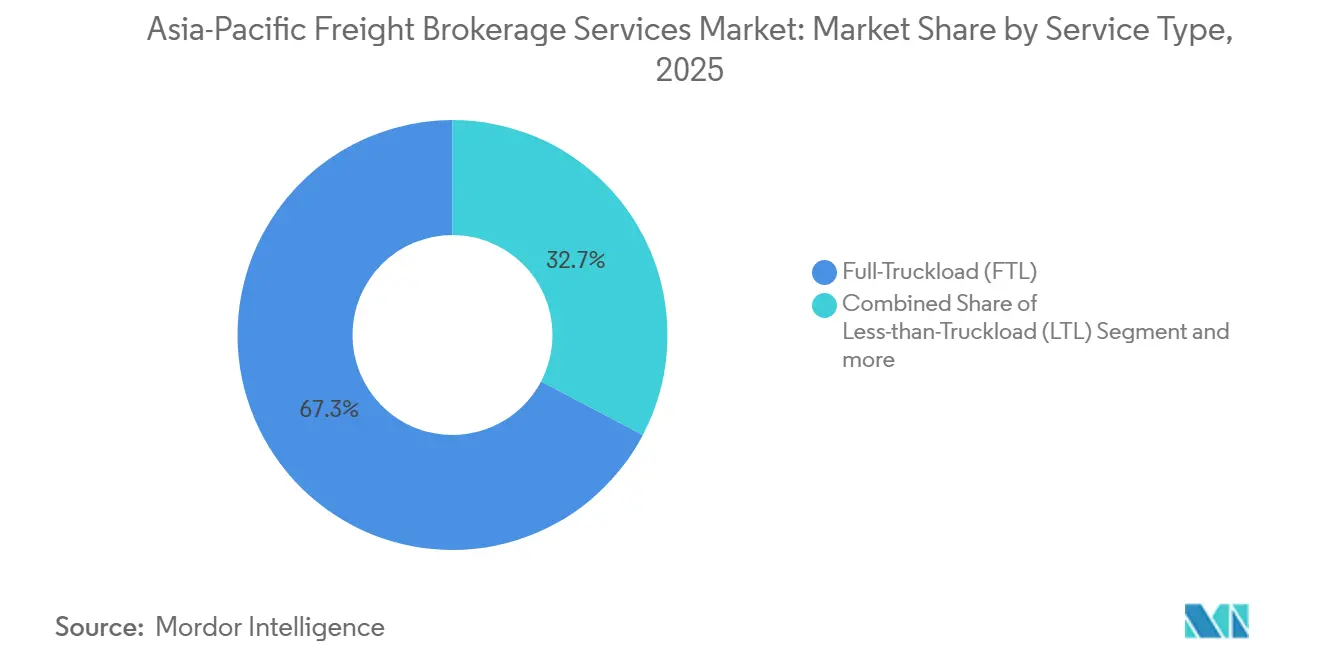
- By service, full-truckload captured 67.31% of the Asia-Pacific freight brokerage market share in 2025. Less-than-truckload is projected to expand at an 11.01% CAGR through 2031.
- By equipment type, dry van accounted for 46.13% share of the Asia-Pacific freight brokerage market size in 2025. Refrigerated vans are advancing at a 12.27% CAGR to 2031.
- By haul length, long-haul services accounted for 57.42% of the Asia-Pacific freight brokerage market in 2025. Regional haul is the fastest-growing distance band, with a 10.19% CAGR through 2031.
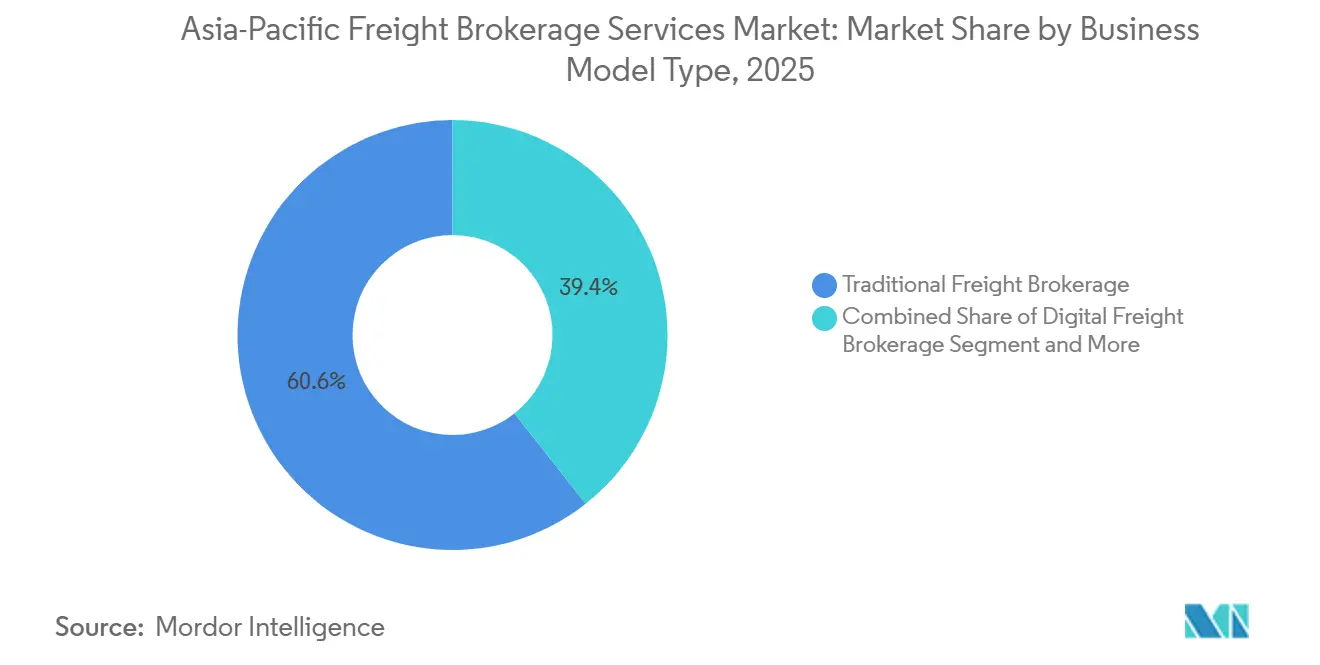
- By business model, traditional brokerage retained 60.63% market share in 2025. Digital platforms are forecast to grow at 20.70% CAGR to 2031.
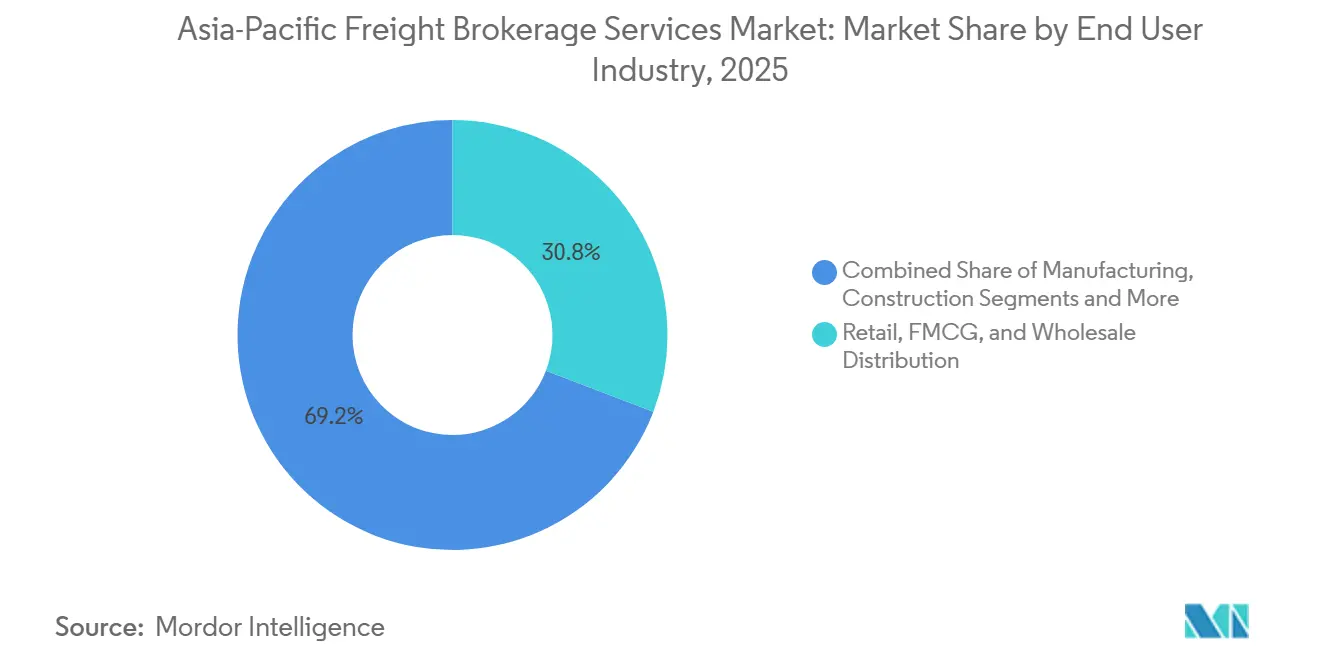
- By end-user, retail and FMCG distribution led with 30.80% market share in 2025. E-commerce fulfillment is projected to climb at a 16.16% CAGR through 2031.
- By customer size, large enterprises accounted for 56.20% of the market in 2025. Small businesses are growing at the fastest rate, with a 12.68% CAGR over 2026-2031.
- By country, China captured 44.95% of the Asia-Pacific freight brokerage market in 2025. India is projected to expand at an 10.87% CAGR through 2031.
Note: Market size and forecast figures in this report are generated using Mordor Intelligence’s proprietary estimation framework, updated with the latest available data and insights as of January 2026.
Asia-Pacific Freight Brokerage Services Market Trends and Insights
Drivers Impact Analysis*
| Driver | (~) % Impact on CAGR Forecast | Geographic Relevance | Impact Timeline |
|---|---|---|---|
| Cross-border e-commerce mini-consignments boosted by RCEP tariff reductions | +1.9% | ASEAN, China, Japan, South Korea, Australia | Short term (≤ 2 years) |
| High-capacity green highway rest areas extending electric-truck range | +1.6% | China, India, with early adoption in Japan | Medium term (2-4 years) |
| Telematics-driven insurance rebates cutting carrier OPEX and widening broker margins | +1.3% | Global, led by India, China, Australia | Short term (≤ 2 years) |
| Manufacturing relocation to China tier-3/4 cities, lengthening domestic haul lanes | +1.1% | China inland provinces, spillover to Vietnam, Thailand | Medium term (2-4 years) |
| Mode shift from congested maritime ports to regional road legs | +0.9% | China, Southeast Asia port cities | Short term (≤ 2 years) |
| India's Gati Shakti digital permit platform compressing load-matching cycle times | +0.7% | India national, with pilot gains in Delhi, Mumbai, Bangalore | Short term (≤ 2 years) |
| Source: Mordor Intelligence | |||
Cross-Border E-Commerce Mini-Consignments Boosted by RCEP Tariff Reductions
RCEP removes duties on 92% of intra-bloc goods and standardizes digital documentation, lowering cross-border transaction costs by up to 30%. Parcel traffic between China and ASEAN markets surged in 2024 and 2025 as Indonesian and Vietnamese consumers sourced directly from Chinese sellers, creating thousands of low-weight, time-sensitive moves per day. Only technology-enabled brokers can manage the customs complexity and real-time visibility needed for such volumes, leading to rapid onboarding of sellers onto digital freight platforms. Revenue pools once considered sub-scale now deliver profitable unit economics because e-invoicing and paperless clearance compress handling overhead. The result is an enduring shift toward smaller shipment sizes and higher shipment frequency across the Asia-Pacific freight brokerage market[1]"Regional Comprehensive Economic Partnership (RCEP) Agreement Overview." 2026, RCEP Secretariat, rcepsec.org.
High-capacity Green Highway Rest Areas Extending Electric-Truck Range
China mandated chargers in every highway service area by 2025, adding more than 5,000 high-capacity units that support commercial vehicles. India targets 1,000 charging-enabled rest areas by 2027 under its green mobility program. Dense charging networks eliminate range anxiety for electric refrigerated rigs that now exceed 400 kilometers per cycle, lowering energy spend versus diesel by nearly 40%. Brokers gain an edge when they can calculate state-of-charge alongside delivery windows and recommend optimized charging stops. The infrastructure shift is particularly valuable in cold chain lanes serving pharma clusters in Gujarat, Guangdong, and Seoul, where electric reefers unlock both cost savings and emissions compliance[2]"Guidelines on Accelerating EV Charging Infrastructure Along Highways." , 2026, Government of China, gov.cn.
Telematics-Driven Insurance Rebates Cutting Carrier OPEX and Widening Broker Margins
Indian underwriters such as ICICI Lombard offer 20% premium discounts when fleets stream real-time driving data via onboard devices. Similar incentives appear across China and Australia, shaving 15-25% from carriers’ insurance budgets. Brokers equipped with data aggregation hubs secure the best-priced capacity first, then bundle those savings into competitive rate sheets for shippers. Usage-based policies also unlock new metrics hard-brake frequency, route adherence, idle time that feed directly into machine-learning load-matching tools. Wider telematics adoption therefore widens broker spreads on every lane in the Asia-Pacific freight brokerage market.
Manufacturing Relocation to China Tier-3/4 Cities, Lengthening Domestic Haul Lanes
Western China’s inbound foreign direct investment is outpacing coastal provinces for the first time since 2024. As factories surface in Sichuan and Gansu, finished goods must still exit via Shanghai or Ningbo, adding 1,000-2,000 kilometers to truck routes. Local manufacturers lack legacy carrier relationships, prompting them to outsource to brokers with multimodal expertise. Demand spikes for truck-rail combinations and oversized flatbeds that move production equipment to greenfield sites. The lengthened lanes anchor long-haul volumes in the Asia-Pacific freight brokerage market even as regional hauls accelerate.
Restraints Impact Analysis*
| Restraint | (~) % Impact on CAGR Forecast | Geographic Relevance | Impact Timeline |
|---|---|---|---|
| Semiconductor shortages delaying mandatory truck-telematics installations | -1.2% | Global, particularly severe in China, Japan, South Korea | Medium term (2-4 years) |
| Cyber-attacks on digital brokerage platforms undermining shipper confidence | -0.9% | Digital-first markets: China, India, Singapore | Short term (≤ 2 years) |
| Carbon Border Adjustment Mechanisms dampening export-linked haul demand | -0.7% | China, India, Southeast Asia export corridors | Medium term (2-4 years) |
| Constricted venture funding pool curbing start-up brokerage expansion | -0.5% | India, Southeast Asia startup ecosystems | Short term (≤ 2 years) |
| Source: Mordor Intelligence | |||
Semiconductor Shortages Delaying Mandatory Truck Telematics Installations
Supply bottlenecks dating to 2024 push lead times for GPS and CAN-bus chips beyond 40 weeks. Commercial fleets postpone upgrades needed to meet China’s evolving telematics mandates or India’s Vehicle Location Tracking rules. Smaller carriers remain on basic location-only boxes, starving brokers of granular data such as fuel burn or brake events. Without those inputs, insurance rebates shrink and algorithmic pricing accuracy falls, dulling the competitive edge of data-first platforms inside the Asia-Pacific freight brokerage market[3]"Global Semiconductor Market Forecast and Supply Trends." , 2026, World Semiconductor Trade Statistics, wsts.org.
Cyber-Attacks on Digital Brokerage Platforms Undermining Shipper Confidence
Ransomware incidents against logistics platforms climbed 47% YoY in 2024-2025 and hit a Chinese digital broker in March 2025, halting 50,000 loads and causing USD 180 million in losses. Enterprise shippers now insist on ISO 27001 audits and two-factor authentication before sharing routing data. Cyber budgets rose 35% among the top ten Asia-Pacific brokers in 2025, but smaller startups struggle to fund intrusion detection systems that often cost more than USD 500,000 per year. Trust deficits slow customer onboarding and temper the growth trajectory of new digital entrants.
*Our forecasts treat driver/restraint impacts as directional, not additive. The impact forecasts reflect baseline growth, mix effects, and variable interactions.
Segment Analysis
By Service: LTL Consolidation Gains Momentum
Less-than-truckload services are experiencing the fastest growth at 11.01% CAGR through 2031, driven by e-commerce fragmentation and the proliferation of small-batch manufacturing that generates shipments below full-truckload thresholds. Full-truckload services retain 67.31% market share in 2025, reflecting the region's manufacturing-heavy economy and long-distance trade corridors that favor dedicated vehicle movements for bulk commodities, automotive components, and industrial equipment. The LTL surge reflects changing customer preferences, with businesses increasingly valuing flexibility and cost efficiency over the dedicated capacity commitments required for FTL services. RCEP tariff reductions are particularly beneficial for LTL brokers, as cross-border mini-consignments require sophisticated consolidation capabilities to achieve profitable load factors while managing customs complexity across multiple jurisdictions.
Other services, including specialized transport for oversized cargo, hazardous materials, and project logistics, are gaining traction as supply chains become more sophisticated and value-sensitive. The segment is benefiting from manufacturing relocation into China's inland provinces, which is creating demand for specialized heavy-haul services to transport production equipment and construction materials to new factory sites. Freight brokers are investing in LTL network optimization algorithms that can dynamically consolidate shipments across multiple origin-destination pairs, reducing empty miles and improving asset utilization. The shift toward LTL is also driving demand for urban consolidation centers and cross-dock facilities that enable efficient load aggregation, creating opportunities for brokers who can integrate real estate and transportation services[4]"Vehicle Location Tracking and Emergency Button Regulations (AIS-140)." , 2026, Ministry of Road Transport and Highways, morth.nic.in.


By Equipment Type: Cold Chain Infrastructure Drives Refrigerated Growth
Refrigerated vans posted a 12.27% CAGR through 2031 thanks to vaccine, biotech, and fresh-produce flows, even though dry vans still controlled 46.13% of Asia-Pacific freight brokerage market share in 2025. Electric reefers plug into high-capacity chargers built along Beijing–Shanghai and Delhi–Mumbai corridors, cutting per-kilometer energy costs and meeting ESG mandates. Brokers offering temperature telemetry with blockchain-stamped custody logs now command premiums.
The Asia-Pacific freight brokerage market size for refrigerated moves is set to climb further as Indonesia, Thailand, and Vietnam mandate GDP standards for pharma distribution. New cold-storage nodes near Chennai, Guangzhou, and Brisbane give brokers fresh pooling points that trim cycle times and preserve product integrity.
By Haul Length: Regional Corridors Capture Mode Shift
Long-haul trips over 500 miles represented 57.42% of the Asia-Pacific freight brokerage market in 2025, yet regional hauls between 100-500 miles are growing fastest at 10.19% CAGR. Land corridors such as Thailand’s East-to-West link shave three days off sea routes and attract electronics shippers who need predictability. Brokers redesign lane pricing to bundle customs brokerage and bonded truck legs, meeting transit guarantees without port delays.
Regional freight also maps nicely onto the 400-kilometer real-world range of many class-8 electric tractors, unlocking further OPEX savings. Telematics-driven insurance discounts sweeten carrier economics, allowing brokers to quote lower tariffs and still protect margin. The net result is a durability in the Asia-Pacific freight brokerage market’s regional share climb.
By Business Model: Digital Platforms Disrupt Legacy Intermediation
Traditional freight brokerage kept 60.63% share in 2025, but digital platforms that price and assign loads in real time are tracking a 20.70% CAGR through 2031. Instant API links into Gati Shakti reduce permit wait times from days to hours, giving online platforms a decisive speed edge. Asset-based and agent models retain relevance for project cargo and regulated hazmat moves where physical control or local licenses are prerequisites.
Cyber-breaches, however, have slowed some shippers’ digital migration, prompting platforms to add human customer-success teams and invest heavily in layered security. M&A remains brisk: DSV’s acquisition of DB Schenker shows scale buyers absorbing network breadth and data science in one stroke. As these giants automate, the Asia-Pacific freight brokerage industry edges toward an omnichannel model blending human expertise with algorithmic speed.
By End-User Industry: E-Commerce Reshapes Distribution Economics
Retail, FMCG, and wholesale distribution held 30.80% share in 2025, but e-commerce & 3PL fulfillment volumes are rocketing at 16.16% CAGR to 2031. Cross-border micro-parcels under RCEP thresholds need tight consolidation to cross customs in bulk and then disperse via parcel networks. Brokers now run urban micro-fulfillment hubs and dispatch final-mile vans within 90 minutes of inbound truck arrival.
Agriculture and perishables lean on expanded cold chains to serve rising protein demand across urban Asia. Technology and consumer electronics exporters insist on sensors that detect shock, tilt, and humidity, pushing brokers to bundle IoT hardware within their contract rates. Collectively, these shifts lock in multi-vertical complexity inside the Asia-Pacific freight brokerage market.
By Customer Size: Digital Platforms Democratize SME Access
Large enterprises commanded 56.20% of 2025 revenues, a figure propped up by automotive and electronics majors that negotiate annual tenders. Yet small businesses are rising at 12.68% CAGR because digital apps lower entry barriers. SMEs now secure spot capacity in under three minutes and pay via e-wallet, eliminating past dependence on informal brokers.
Funding shortages among early-stage apps are a headwind, but incumbents such as BlackBuck, freshly capitalized, fill the gap and onboard corner-store shippers at scale. This democratization keeps the Asia-Pacific freight brokerage market fragmented and competitive.
Geography Analysis
China remained the anchor with 44.95% share in 2025, underpinned by inland factory growth that lengthens domestic truck routes and by the rapid rollout of highway charging stations. Mandatory telematics policies continue to phase in, though chip shortages are pushing some compliance dates out. Cyber-incidents in 2025 spurred major shippers to demand multi-factor authentication and audit logs before tendering digital loads, nudging part of China’s freight back toward hybrid human-plus-platform models.
India is the fastest-growing geography, with a 10.87% CAGR through 2031, as Gati Shakti slashes permit lead times and aligns 16 ministries into a single logistics data layer. Telematics-linked insurance rebates, electric-truck charging corridors, and a swelling VC-backed platform ecosystem propel both regional haul lanes and SME participation. Policy tailwinds position India to chip away at China’s share, particularly in pharma cold chain and electronics manufacturing exports.
Japan, South Korea, and Australia exhibit steady low-single-digit expansion. Their mature road networks, tight driver regulations, and high ESG disclosure standards shift broker strategy toward value-added services such as carbon accounting and lane-by-lane emission dashboards. Southeast Asian nations - Indonesia, Thailand, Vietnam, Malaysia benefit from Belt and Road rail spurs and the Thai Land Bridge that offers a rapid cross-peninsula alternative to the Malacca Strait. These projects lower end-to-end transit times and draw incremental cargo away from maritime routes, fueling double-digit brokerage growth in the sub-region.
CBAM-linked carbon tariffs weigh on Asia–EU export flows, especially for steel and cement loads originating in coal-reliant grids. Forward-looking brokers invest in mode-switch tools that steer shippers toward lower-carbon rail and sea legs or procure green power certificates to blunt tariff exposure. Across every geography, the Asia-Pacific freight brokerage market remains sensitive to chip availability, cybersecurity posture, and the pace of digital permit harmonization.
Competitive Landscape
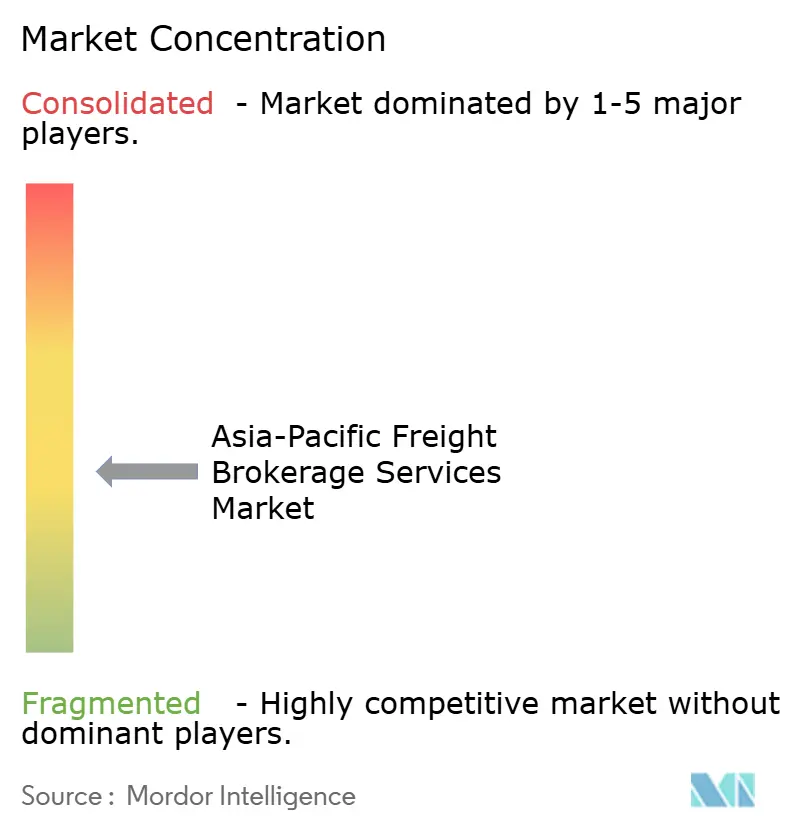
The Asia-Pacific freight brokerage market is moderately fragmented, with traditional family-owned brokers, asset-light digital natives, and 3PL giants all vying for volumes. DSV’s April 2025 purchase of DB Schenker vaulted it to the second-largest global logistics entity and consolidated sizable Asia-Pacific lane capacity under one balance sheet. DHL’s takeover of CRYOPDP strengthened its position in high-value temperature-controlled moves across Japan and Singapore.
Digital titans such as Full Truck Alliance prepare for a Hong Kong listing that will bankroll AI and blockchain upgrades. BlackBuck closed a USD 67 million round led by Flipkart to expand deep into tier-2 Indian cities. CEVA’s USD 383 million acquisition of Borusan Tedarik boosts its Asia–Europe capacity, offering brokers an integrated land-bridge plus sea offering via Turkey.
Cyber resilience, API connectivity into public permit systems, and the ability to harness telematics data now define competitive moats. Smaller regional players struggle to finance SOC-2 compliance and are prime targets for consolidation. Still, niche specialists thrive in hazardous, oversized, or ultra-cold verticals where service intensity outweighs algorithmic speed. This fluid competitive field cements a still-fragmented structure, though the top five brokers together control nearly 40% of total Asia-Pacific freight brokerage market revenue.
Asia-Pacific Freight Brokerage Services Industry Leaders
-
Sinotrans Limited
-
C.H. Robinson Worldwide Inc
-
Kerry Logistics Network Limited
-
CJ Logistics Corporation
-
NYK (Yusen Logistics Ltd)
- *Disclaimer: Major Players sorted in no particular order

Recent Industry Developments
- April 2025: DSV agreed to acquire DB Schenker for USD 23.6 billion, creating the world’s second-largest logistics provider and adding extensive Asian trucking and airfreight capacity .
- April 2025: CEVA Logistics signed a USD 383 million deal to buy Borusan Tedarik, strengthening Asia-to-Europe brokerage corridors.
- March 2025: DHL Group acquired CRYOPDP, expanding cold-chain reach in Singapore, Japan, and South Korea.
- February 2025: Accelerated Global Solutions acquired a 15% stake in Malaysian logistics company KGW Logistics, strengthening cross-border freight brokerage capabilities between Malaysia and other ASEAN markets.


Asia-Pacific Freight Brokerage Services Market Report Scope
| Full-Truckload (FTL) |
| Less-than-Truckload (LTL) |
| Others |
| Dry Van |
| Refrigerated Van |
| Flatbed / Step-Deck |
| Tanker (Bulk Liquid and Chemical) |
| Others |
| Long-Haul (>500 miles) |
| Regional (100-500 miles) |
| Local (<100 miles) |
| Traditional Freight Brokerage |
| Asset-Based Freight Brokerage |
| Agent Model Freight Brokerage |
| Digital Freight Brokerage |
| Manufacturing and Automotive |
| Construction and Infrastructure Projects |
| Oil, Gas, Mining and Chemicals |
| Agriculture and Food / Beverage |
| Retail, FMCG and Wholesale Distribution |
| Healthcare and Pharmaceuticals |
| E-commerce and 3PL Fulfilment |
| Other End-User Industry |
| Large Enterprise Shippers (>USD 100 M) |
| Mid-Market Shippers (USD 10–100 M) |
| Small Businesses (<USD 10 M) |
| China |
| India |
| Japan |
| South Korea |
| Australia |
| Indonesia |
| Thailand |
| Vietnam |
| Malaysia |
| Rest of Asia-Pacific |
| By Service | Full-Truckload (FTL) |
| Less-than-Truckload (LTL) | |
| Others | |
| By Equipment / Trailer Type | Dry Van |
| Refrigerated Van | |
| Flatbed / Step-Deck | |
| Tanker (Bulk Liquid and Chemical) | |
| Others | |
| By Haul Length | Long-Haul (>500 miles) |
| Regional (100-500 miles) | |
| Local (<100 miles) | |
| By Business Model | Traditional Freight Brokerage |
| Asset-Based Freight Brokerage | |
| Agent Model Freight Brokerage | |
| Digital Freight Brokerage | |
| By End-User Industry | Manufacturing and Automotive |
| Construction and Infrastructure Projects | |
| Oil, Gas, Mining and Chemicals | |
| Agriculture and Food / Beverage | |
| Retail, FMCG and Wholesale Distribution | |
| Healthcare and Pharmaceuticals | |
| E-commerce and 3PL Fulfilment | |
| Other End-User Industry | |
| By Customer Size | Large Enterprise Shippers (>USD 100 M) |
| Mid-Market Shippers (USD 10–100 M) | |
| Small Businesses (<USD 10 M) | |
| By Country | China |
| India | |
| Japan | |
| South Korea | |
| Australia | |
| Indonesia | |
| Thailand | |
| Vietnam | |
| Malaysia | |
| Rest of Asia-Pacific |


Key Questions Answered in the Report
What is the 2025 value of the Asia-Pacific freight brokerage market?
The market stood at USD 36.51 billion in 2025.
How large will the Asia-Pacific freight brokerage market be by 2031?
It is projected to reach USD 61.69 billion by 2031 with a 9.03% CAGR over 2026-2031.
Which service segment is expanding fastest?
Less-than-truckload services are advancing at 11.01% CAGR through 2031 as E-commerce fragments shipment sizes.
What equipment type offers the highest growth potential?
Refrigerated vans post the highest rise, growing at 12.27% CAGR thanks to cold-chain demand from pharma and fresh food.
Which country will lead growth through 2031?
India will record the fastest national CAGR at 10.87% on the back of its Gati Shakti digital logistics program.
How are digital platforms changing competition?
Platforms that integrate telematics and API-based permit systems are scaling quickly at 20.70% CAGR, eroding legacy brokers’ share.
Page last updated on:


