
Feed Carotenoids Market Size and Share
Market Overview
| Study Period | 2021 - 2031 |
|---|---|
| Market Size (2026) | USD 3.41 Billion |
| Market Size (2031) | USD 4.59 Billion |
| Growth Rate (2026 - 2031) | 6.14 % |
| Fastest Growing Market | North America |
| Largest Market | Asia Pacific |
| Market Concentration | Medium |
Major Players *Disclaimer: Major Players sorted in no particular order Image © Mordor Intelligence. Reuse requires attribution under CC BY 4.0. | |
Feed Carotenoids Market Analysis by Mordor Intelligence
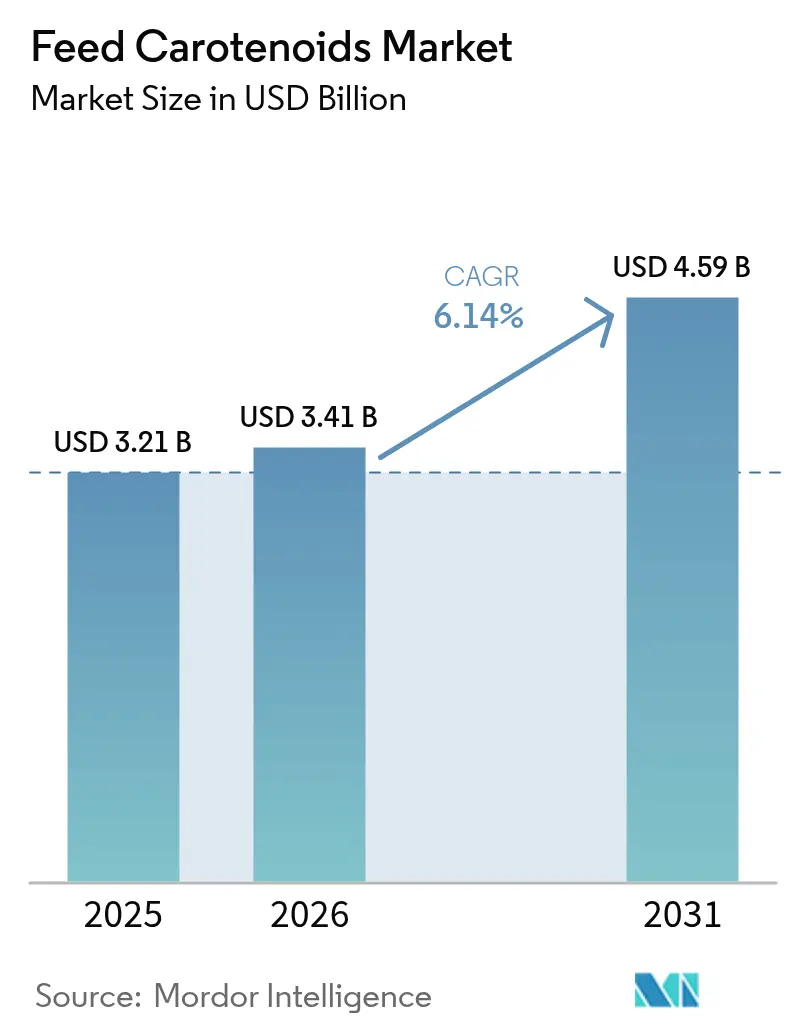
feed carotenoids market size in 2026 is estimated at USD 3.41 billion, growing from 2025 value of USD 3.21 billion with 2031 projections showing USD 4.59 billion, growing at 6.14% CAGR over 2026-2031. The upward trajectory persists even after severe supply chain shocks, underscoring the market’s structural resilience. Salmonid aquaculture, industrial-scale poultry, and rapid technology adoption together spur demand, while procurement teams hedge against single-source dependencies by approving multiple suppliers and encouraging precision-fermentation breakthroughs. The BASF SE and DSM-Firmenich outages realigned pricing power, rewarding producers able to guarantee on-time shipment of stabilized beadlets in tropical lanes. Natural carotenoids have regulatory momentum in Europe and branding advantages in North America, although synthetic variants keep cost leadership in value-focused Asia-Pacific feed formulations.
Key Report Takeaways
- By product type, astaxanthin led with 31.95% revenue share in 2025, and same projected to expand at a 7.36% CAGR to 2031.
- By form, powder formats captured 42.40% of the feed carotenoids market size in 2025, and beadlets are projected to advance at an 8.05% CAGR through 2031.
- By animal type, poultry accounted for 38.35% of the feed carotenoids market share in 2025, and aquaculture is projected to register an 7.92% CAGR from 2026 to 2031.
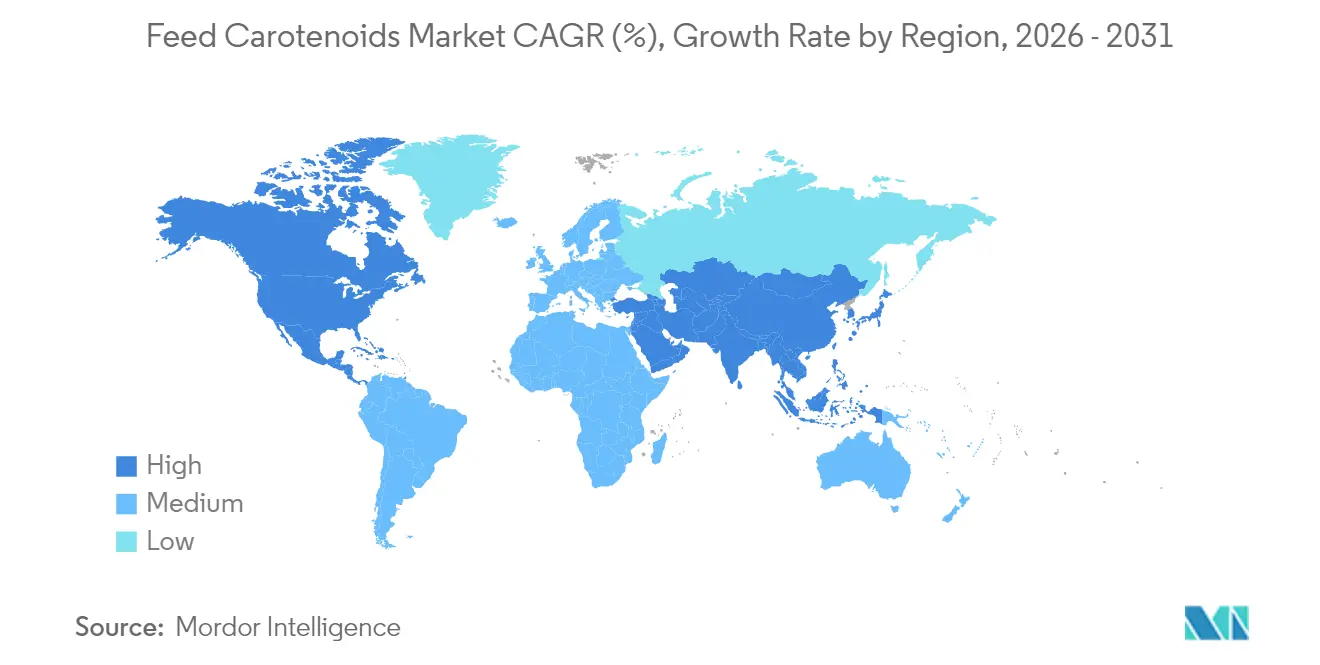
- By geography, the Asia-Pacific region retained a 29.55% share of the market in 2025, and North America is projected to demonstrate the fastest CAGR of 7.55% from 2026 to 2031.
Note: Market size and forecast figures in this report are generated using Mordor Intelligence’s proprietary estimation framework, updated with the latest available data and insights as of 2026.
Market Trends and Insights
Drivers Impact Analysis of Feed Carotenoids Market*
| Driver | (~) % Impact on CAGR Forecast | Geographic Relevance | Impact Timeline |
|---|---|---|---|
| Rising demand for salmonid aquafeed pigmentation | +1.2% | Global, concentrated in Norway, Chile, and Scotland | Medium term (2-4 years) |
| Industrial-scale poultry production in emerging economies | +0.8% | Asia-Pacific core, spill-over to South America | Long term (≥ 4 years) |
| Shift from synthetic to natural carotenoids | +1.1% | Europe and North America, expanding to Asia-Pacific | Medium term (2-4 years) |
| Microalgae and precision-fermentation cost breakthroughs | +0.9% | Global, early adoption in Europe and North America | Long term (≥ 4 years) |
| Tariff-driven reshoring of carotenoid supply chains | +0.7% | North America and Europe, bilateral trade impacts | Short term (≤ 2 years) |
| AI-enabled pigment optimization for species-specific outcomes | +0.6% | Global, technology leaders in developed markets | Medium term (2-4 years) |
| Source: Mordor Intelligence | |||
Rising Demand for Salmonid Aquafeed Pigmentation
Salmon farmers link flesh coloration directly with consumer premium willingness, and Norwegian producers report a 15 – 20% price uplift for optimally pigmented fish. The European Food Safety Authority's 2024 reaffirmation of astaxanthin safety limits at 100 mg/kg for ornamental fish provides regulatory clarity that supports expanded usage in commercial aquaculture[1]Source: European Food Safety Authority, “Astaxanthin Safety Reaffirmation,” efsa.europa.eu. Freight cost for temperature-controlled carotenoids reaches 12% of ingredient value in remote sites, pushing farms to secure nearby warehousing and on-farm stability testing.
Industrial-Scale Poultry Production in Emerging Economies
Poultry sector consolidation in Asia-Pacific markets creates concentrated demand for standardized pigmentation solutions that ensure consistent egg yolk coloration and broiler skin appearance across large production volumes. The shift from traditional smallholder systems to integrated operations creates opportunities for premium carotenoid suppliers who can provide technical support and quality assurance programs. Brazil's poultry export growth necessitates compliance with international color standards, driving the adoption of standardized carotenoid supplementation protocols that ensure consistent product appearance across diverse genetic lines and production environments.
Shift from Synthetic to Natural Carotenoids
Regulatory frameworks increasingly favor natural carotenoids as consumer preferences and sustainability mandates reshape ingredient selection criteria across major feed markets. The European Union's stricter evaluation criteria for synthetic additives create competitive advantages for natural alternatives, while North American markets show growing preference for clean-label feed ingredients that support premium product positioning. The transition creates supply chain challenges as natural production requires longer lead times and more complex quality control procedures compared to synthetic alternatives.
Microalgae and Precision-Fermentation Cost Breakthroughs
Biotechnology advances in 2024 achieved commercial viability for several alternative carotenoid production pathways that previously remained economically uncompetitive with synthetic manufacturing. CB Therapeutics developed sustainable retinol production via precision fermentation in May 2024, demonstrating scalable approaches that could extend to other carotenoid compounds. The technology enables the production of novel carotenoid variants and enhanced bioavailability formulations that cannot be achieved through traditional synthesis or extraction approaches.
Restraints Impact Analysis of Feed Carotenoids Market*
| Restraint | (~) % Impact on CAGR Forecast | Geographic Relevance | Impact Timeline |
|---|---|---|---|
| Volatility in carotenoid-rich biomass supplies | -0.4% | Global, acute in regions dependent on agricultural extraction | Short term (≤ 2 years) |
| Regulatory uncertainty around novel fermentation strains | -0.3% | Europe and North America, strict approval processes | Medium term (2-4 years) |
| Photodegradation losses during tropical feed logistics | -0.2% | Tropical and subtropical regions, supply chain dependent | Short term (≤ 2 years) |
| Sub-clinical toxicity risks at supra-nutritional doses | -0.1% | Global, species-specific sensitivity variations | Long term (≥ 4 years) |
| Source: Mordor Intelligence | |||
Volatility in Carotenoid-Rich Biomass Supplies
Agricultural extraction of carotenoids from marigold petals, paprika, and other plant sources faces increasing volatility due to climate variability and competing land use pressures that affect raw material availability and pricing. Weather disruptions in major growing regions can create price swings within single seasons, forcing feed manufacturers to maintain larger inventory buffers that increase working capital requirements. The concentration of extraction facilities in specific geographic regions creates supply chain vulnerabilities, as demonstrated by recent disruptions that affected multiple ingredient categories simultaneously. Alternative sourcing strategies require extensive validation and regulatory approvals that can take 18-24 months to complete, limiting short-term flexibility in responding to supply disruptions.
Regulatory Uncertainty Around Novel Fermentation Strains
The distinction between genetically modified organisms and novel food classifications remains unclear for many fermentation-derived carotenoids, creating regulatory pathway uncertainty that affects commercial planning and investment decisions[2]Source: European Food Safety Authority, “Novel Foods Applications Portal,” efsa.europa.eu. Different regulatory approaches across major markets require parallel approval processes that increase development costs and time-to-market for new carotenoid production methods. Companies must navigate complex safety assessment requirements that vary significantly between synthetic, extracted, and fermentation-derived carotenoids, even when the final molecular structures are identical.
*Our forecasts treat driver/restraint impacts as directional, not additive. The impact forecasts reflect baseline growth, mix effects, and variable interactions.
Feed Carotenoids Market Segment Analysis
By Product Type:
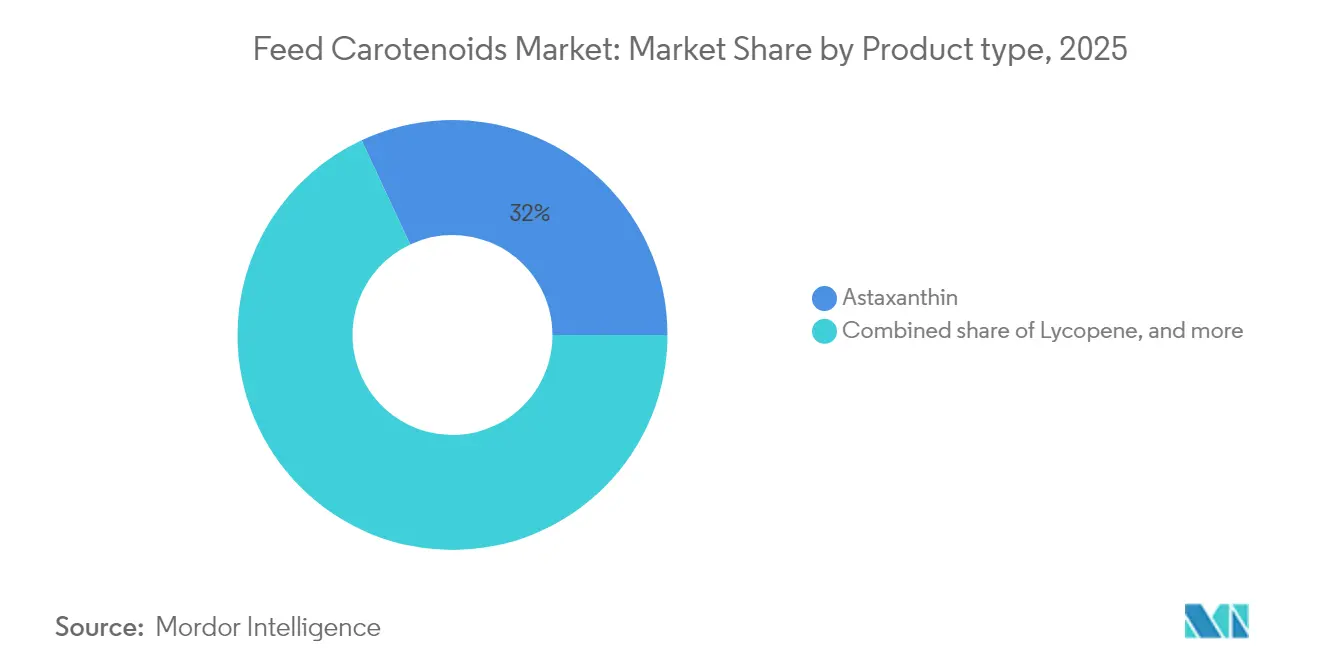
Astaxanthin Anchors Premium ApplicationsAstaxanthin held 31.95% feed carotenoids market share in 2025, driven by salmon pigmentation premiums. It leads growth at a 7.36% CAGR as retailers promote non-synthetic seafood labels. The feed carotenoids market size attributable to beta-carotene remains sizable in poultry and swine due to its dual Vitamin A role. Lutein retention in table-egg programs supports differentiated shell-egg Stock keeping units (SKU), while canthaxanthin usage stays constrained by dosage ceilings.
The dominance of astaxanthin creates a price umbrella enabling niche carotenoids such as zeaxanthin to float at specialty premiums. Salmon processors tie bonus payments to fillet hue metrics, cementing steady demand even during feed cost inflation cycles. The regulatory landscape creates competitive advantages for astaxanthin and beta-carotene alternatives that offer similar pigmentation benefits without associated safety concerns. Other carotenoid types, including zeaxanthin and capsanthin, target niche applications where specific color profiles or functional benefits justify premium pricing compared to mainstream alternatives.



By Form:
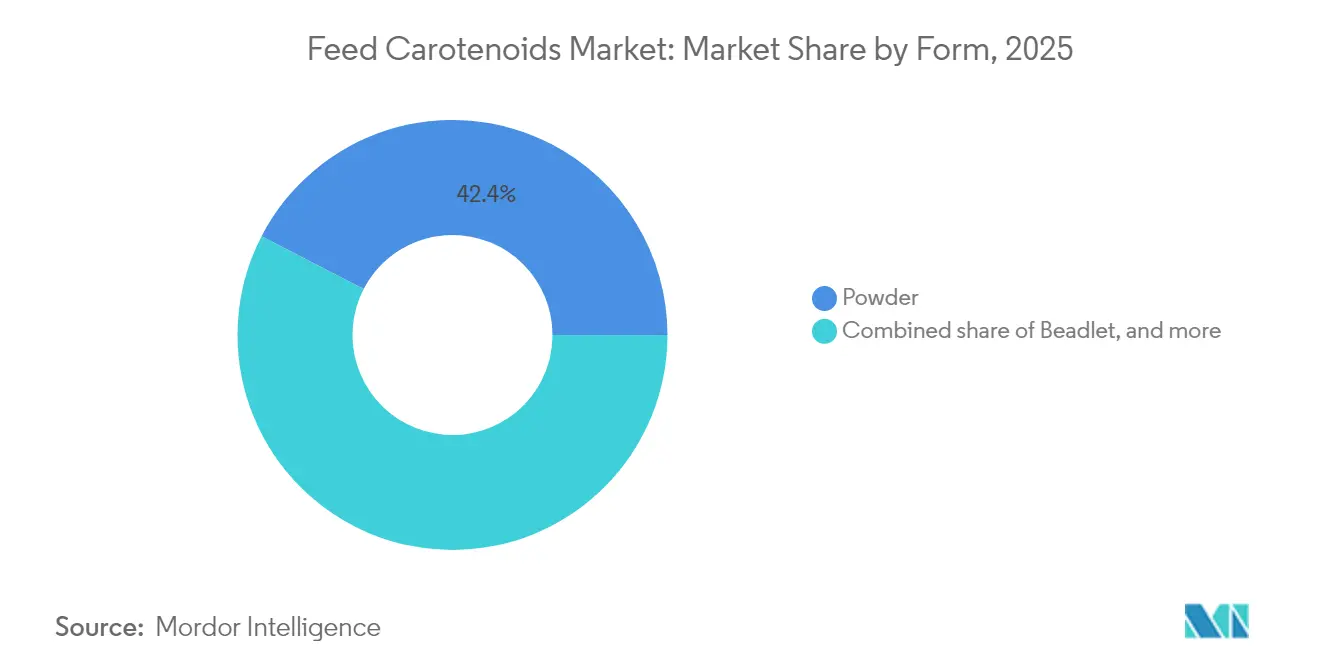
Powders Set Benchmarks, Beadlets AcceleratePowder formats held 42.40% feed carotenoids market share in 2025 due to decades-long familiarity in premix lines. Stable flow properties suit vertical screw feeders and deliver a coefficient of variation below 5% in vitamin lines. Beadlets, growing at 8.05% CAGR, encapsulate actives in starch or protein matrices that resist oxidation and release in targeted gut pH bands, boosting bioavailability.
In tropical routes, powder potency drop exceeds 10% during two-month coastal warehousing, whereas beadlets lose under 4%. The payback from tighter inclusion rates offsets higher per-kilogram price, steering integrators in Indonesia, Thailand, and West Africa toward beadlet adoption. Stability testing under various environmental conditions becomes critical for tropical markets where temperature and humidity fluctuations can degrade carotenoid potency during extended storage periods.
By Animal Type:
Poultry Volumes, Aquaculture VelocityPoultry applications command 38.35% market share in 2025, reflecting the sector's large-scale production volumes and consistent pigmentation requirements for both egg yolk coloration and broiler skin appearance. Aquaculture represents the fastest-growing segment at 7.92% CAGR, driven by expanding salmon farming operations and premium pricing for well-pigmented fish products. Ruminant applications focus primarily on reproductive health benefits of beta-carotene supplementation, while swine operations utilize carotenoids for both pigmentation and antioxidant functions.
The aquaculture segment's growth reflects increasing consumer sophistication and willingness to pay premium prices for visually appealing seafood products. Salmon farming operations report that optimal astaxanthin supplementation can increase market value compared to pale alternatives, creating strong economic incentives for consistent carotenoid inclusion. Other animal types, including pet food applications, represent emerging opportunities where premium positioning and health claims justify higher carotenoid inclusion rates.
Geography Analysis
APAC Feed Carotenoids Market
Asia-Pacific contributed 29.55% of the feed carotenoids market in 2025. China accounts for a significant share of the world's aquaculture harvest, and the consolidation of mega-farms accelerates the standardization of nutrients. India and Vietnam adopt European-style broiler genetics, demanding higher carotenoid density for export-grade skin coloration. Regional governments subsidize recirculating aquaculture systems, magnifying astaxanthin uptake per metric ton of fish produced.
The Americas and Africa Feed Carotenoids Market
North America is projected to register the fastest CAGR of 7.55% from 2026 to 2031. North America posts steady gains backed by large poultry complexes and a regulatory environment that balances innovation speed with safety. FDA approvals for fermentation-derived inputs move faster than EU processes, enticing venture investors to build United States manufacturing. Canada’s Atlantic salmon farms secure supply contracts that include delivery contingencies tied to BASF SE and DSM outage risk mitigation. South America leverages Brazil’s poultry export surge to integrate standardized pigmentation protocols, whereas Africa’s emerging tilapia farms explore low-cost beadlets to raise harvest value.
Europe Feed Carotenoids Market
Europe, with Norway’s salmon value chain and Germany’s premix hubs acting as anchor demand centers. EFSA’s stringent review procedures tilt formulations toward natural inputs, and Germany offers technical hubs that refine beadlet encapsulation lines. Nordic aquafeed factories fine-tune astaxanthin dosage to comply with 25 mg/kg fillet targets and minimize residual loss.

Regulatory Landscape
Feed carotenoids are regulated as feed additives with pre-market authorization and ongoing renewal requirements across major markets, shaping product portfolios and the level of documentation required for synthetic, extracted, and fermentation-derived sources. In the European Union, Regulation (EC) No 1831/2003 provides the authorization framework, and Commission Implementing Regulation (EU) 2026/1148 (adopted 28 May 2026) renewed beta-carotene (including a specified preparation) for all animal species, reinforcing continuity of use under updated conditions and timelines. EFSA FEEDAP opinions support these renewals by assessing safety for target species, consumers, users, and the environment, while colorant carotenoids from plant sources (for example Tagetes erecta-derived lutein/zeaxanthin) fall within sensory additive classifications.
The United States keeps a pre-market approval route for animal food additives through the FDA Food Additive Petition process under section 409 of the FD&C Act, alongside ingredient and color additive listings that govern use conditions and labeling. China applies national technical standards for certain carotenoids, including GB 7300.901-2019 for chemically synthesized beta-carotene crystals, adding a production-specification layer beyond broader safety and compliance expectations. For fermentation-derived carotenoids, differences in how jurisdictions interpret novel production strains and related safety dossiers continue to shape approval sequencing and parallel submission strategies.
Competitive Landscape
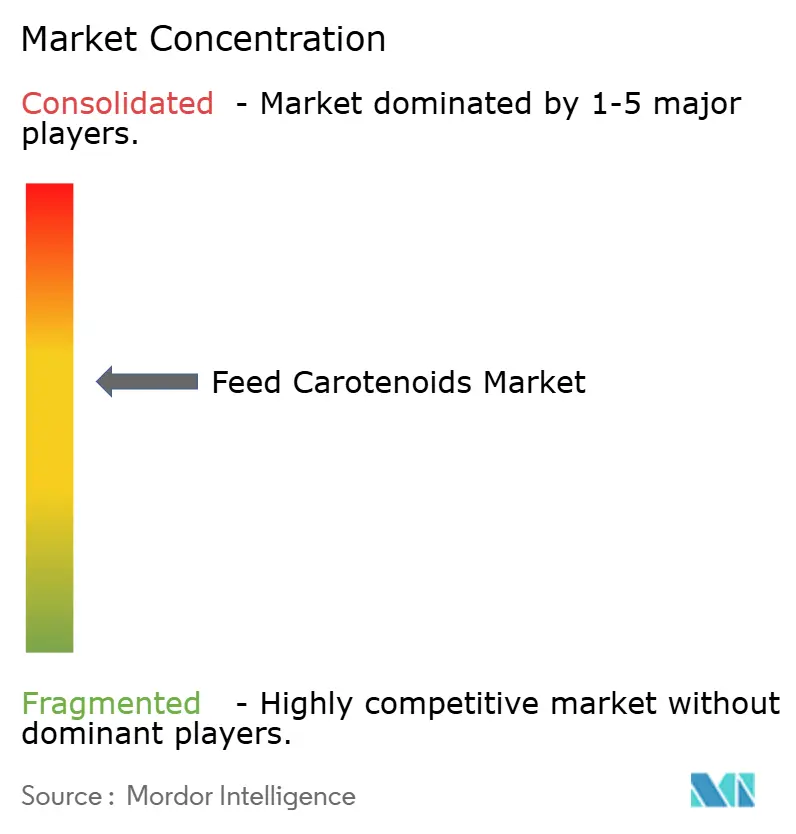
The market shows moderate concentration. BASF SE and DSM-Firmenich outages in 2024 exposed vulnerabilities, and combined, the events resulted in the loss of over one-quarter of the world's synthetic capacity for several months. Zhejiang NHU filled part of the gap, capturing short-term volume through nimble capacity allocation. Corbion’s 2024 acquisition of full control of its Brazilian algae plant underscores a pivot to vertical integration and natural differentiation[3]Source: Corbion, “Acquisition of AlgaPrime Facility,” corbion.com.
Supply assurance now trumps lowest-cost bidding. Feed groups add supplier scorecards, weighting on-time delivery, multi-plant networks, and rapid turnaround of QC documents. Firms with fermentation pipelines, such as CB Therapeutics, receive strategic equity from integrators keen to lock future volumes. AI formulation specialists partner with carotenoid vendors to bundle dosage algorithms, deepening customer lock-in.
Technology racelines split between catalyst optimization in legacy synthetic routes and metabolic-pathway engineering in fermentation. Capital intensity also diverges, and citral expansions require multi-hundred-million-dollar complexes, whereas modular fermenters scale in 5,000-liter increments, enabling staged deployment that matches demand curves.
Feed Carotenoids Industry Leaders
BASF SE
Kemin Industries, Inc.
Cargill Inc.
DSM-Firmenich AG
Archer-Daniels-Midland Company
- *Disclaimer: Major Players sorted in no particular order
Feed Carotenoids Market Companies Covered in this Report
- BASF SE
- DSM-Firmenich AG
- Kemin Industries, Inc.
- Synthite Industries Ltd.
- Nutrex NV
- Divi's Laboratories Limited
- Archer-Daniels-Midland Company
- Cargill Inc.
- Zhejiang NHU Co., Ltd. (NHU Holding Group Co.,Ltd)
- Givaudan SA
- Allied Biotech Corporation
- Impextraco NV
- EW Nutrition GmbH
- Novus International, Inc. (Mitsui & Co., Ltd. and Nippon Soda Co., Ltd)

Market Opportunities and Future Outlook
Regulatory renewals and transition provisions create near-term openings for suppliers that can provide compliance-ready dossiers, labeling support, and uninterrupted product availability across species and geographies. The European Commission renewal of beta-carotene through Implementing Regulation (EU) 2026/1148 (adopted 28 May 2026) keeps a high-volume carotenoid route open for all animal species and sets a defined transition window for products produced and labeled under prior rules, which favors manufacturers and premixers with strong traceability, shelf-life management, and multi-sourcing programs.
Innovation-led inclusion pathways are also expanding beyond conventional additive dosing, supporting differentiated poultry and aquaculture programs where performance, pigmentation outcomes, and supply assurance are purchased together. A March 2026 peer-reviewed study on carotenoid-biofortified wheat in broilers reported improved feed conversion and increased tissue accumulation of lutein and zeaxanthin, pointing to an adjacent crop-based delivery route that can complement traditional premixes for integrators managing feed grain procurement. On the supply side, disruption from major producer outages has already pushed buyers toward supplier diversification and more robust formats, including stabilized beadlets for tropical logistics. This shift supports investments in regional production, algae cultivation, and precision-fermentation capabilities that reduce dependence on single synthetic capacity pools.
Recent Industry Developments in Feed Carotenoids Market
- July 2026: Pinnacle Food Group Limited announced the completion of a development milestone and the commencement of construction of a commercial-scale microalgae-based astaxanthin facility in British Columbia, Canada. The company’s move supports regionalized natural astaxanthin supply into North American aquaculture value chains and reduces exposure to long, temperature-sensitive logistics.
- February 2026: dsm-firmenich announced an agreement to divest its Animal Nutrition & Health business to CVC Capital Partners for an enterprise value of about EUR 2.2 billion, a portfolio that includes vitamins and carotenoids. The transaction indicates a restructuring of one of the category’s largest supply platforms, with implications for customer contracting, product stewardship resources, and carve-out continuity planning for carotenoid lines.
- August 2024: Wanhua Chemical commissioned a 48,000 metric tons per year single-unit citral production facility, expanding the availability of a key upstream intermediate used in synthetic carotenoid value chains. Larger-scale citral output can affect synthetic carotenoid cost structures and supply elasticity during periods of downstream capacity tightness.


Feed Carotenoids Market Report Scope and Research Methodology
Market Definition and Coverage
For this methodology, the feed carotenoids market is defined as the value of carotenoid ingredients sold for use in animal feed to support pigmentation and nutrition outcomes across major livestock and aquaculture systems, and across the key geographies we track.
Scope exclusions: This sizing excludes carotenoids used mainly for human food, dietary supplements, cosmetics, and pharmaceuticals, and it also excludes on-farm premix compounding margins unless they are explicitly billed as carotenoid ingredient revenue.
Segments Covered in This Report
- By Product Type
- Beta-Carotene
- Lycopene
- Lutein
- Astaxanthin
- Canthaxanthin
- Other Types
- By Form
- Beadlet
- Powder
- Oil Suspension
- Emulsion
- By Animal Type
- Ruminant
- Poultry
- Swine
- Aquaculture
- Other Animal Types
- By Geography
- North America
- United States
- Canada
- Mexico
- Rest of North America
- Europe
- Germany
- United Kingdom
- France
- Spain
- Italy
- Russia
- Rest of Europe
- Asia-Pacific
- China
- India
- Japan
- Australia
- Rest of Asia-Pacific
- South America
- Brazil
- Argentina
- Rest of South America
- Middle East
- Saudi Arabia
- Turkey
- Rest of Middle East
- Africa
- South Africa
- Egypt
- Rest of Africa
- North America
Data Sources, Market Sizing, and Validation
Desk Research
Desk research was used to set the market boundary and build the first set of measurable anchors before interviews started. We referred to public, non-paywalled sources such as FAOSTAT livestock and aquaculture output series, USDA and EU agriculture statistics for feed and protein production signals, and UN Comtrade trade flows for relevant HS-coded inputs that can proxy natural carotenoid supply routes.
In parallel, we reviewed company annual reports, investor presentations, and technical brochures to understand product forms and typical use claims by animal type. Peer-reviewed journals and patent databases were checked to see which carotenoid chemistries and stabilization formats are actually being developed and used at scale. This step helped filter out niche claims that do not move the total market. A few paid subscriptions were used only for company financials and structured news checks, and the sources mentioned here are illustrative rather than exhaustive because additional references were also used to support validation and research clarification.
Primary Interviews and Surveys
Primary work focused on validating demand drivers and pricing mechanics that are not consistently visible in public data. We spoke with ingredient suppliers, feed premix participants, and downstream feed buyers, then cross-checked the inputs by animal type, product form, and region to avoid having assumptions driven by a single geography.
For a global market like this, we intentionally spread regional coverage to reflect differences in aquaculture intensity, poultry integration, and regulatory acceptance of pigment additives.
Distribution of primary research fieldwork respondents
| Company type | Respondent position | Region |
|---|---|---|
| Top tier: 36% | CXOs: 13% | APAC: 43% |
| Mid tier: 50% | Functional/Unit leaders: 41% | EMEA: 32% |
| Smaller Players: 14% | Managers: 46% | Americas: 25% |
Market-Sizing & Forecasting
Sizing started from a top-down demand pool assessment, where animal production volumes are reconstructed by region and then filtered through carotenoid adoption rates and typical inclusion ranges for the main feed uses (for example, pigmentation-led poultry diets and color-driven aquaculture species). Those demand-side totals were corroborated using selective bottom-up checks with sampled price ranges by carotenoid type and form, supplier revenue cues from public filings, and channel feedback from premix and feed participants, to keep the total grounded in what is commercially sold.
Key inputs used in the model included regional poultry and aquaculture output trends, relative feed production growth, shifts between natural and synthetic sourcing, product form mix (beadlet, powder, and liquid where relevant), and observable pricing direction linked to raw material and processing constraints. When an input was not available in a clean series, the gap was handled using proxy indicators such as trade intensity and expert-confirmed penetration bands, followed by a sensitivity pass to avoid overstating adoption.
For forecasting, scenario analysis was used. The base case reflected consensus expectations shared by interviewees on protein demand growth, aquaculture expansion, and pigment preference stability. We then used a tighter downside and upside case on pricing and adoption speed. The final forecast path was selected only after the scenarios matched practical constraints, including realistic inclusion economics and region-level feed industry growth.
Data Validation & Update Cycle
Validation was done in layers so one dataset did not decide the final value. We compared the modeled totals against independent signals like livestock and aquaculture output direction, trade-linked supply availability, and interview-confirmed price bands. Outliers were re-checked back to the underlying assumptions before sign-off.
A separate analyst review was also used to test whether the market boundary stayed consistent across years and regions, particularly when product form mix or sourcing preference changed. The report is refreshed annually, and interim updates are made when material events occur, such as sharp input cost swings or regulatory changes that affect carotenoid usage. Before delivery, a fresh final pass is completed so clients receive the most up-to-date view rather than an older snapshot.
Mordor Intelligence's Global Feed Carotenoids Market Market Estimate Compared With Other Published Estimates
Published market sizes for feed carotenoids can look far apart even when the topic sounds the same, because sources often apply different boundaries and different year anchors. The most common differences come from what is counted as feed carotenoids revenue versus broader carotenoids, and whether the estimate leans on demand-side consumption logic or mainly on supplier-side claims.
By tracking poultry and aquaculture output, checking species-level inclusion ranges, and refreshing the demand-side adoption assumptions inside Mordor Intelligence, the model avoids counting human nutrition carotenoids and non-ingredient premix markups in the same revenue total, which is a common driver of spread.
Benchmark comparison
| Source | Market Size | Gaps in Research Methodology |
|---|---|---|
| Mordor Intelligence | USD 3.41 B (2026) | |
| Global Consultancy A | USD 0.75 B (2025) | Uses a narrower revenue boundary that appears closer to additive-only sales captured through selected forms and applications, and the base year choice can also compress the number when pricing is softer. |
| Industry Publisher B | USD 4.00 B (2025) | Likely includes adjacent carotenoid revenues and applies broader adoption assumptions across animal types, which can inflate the demand pool when inclusion rates are not species-specific. |
The table shows that the spread is mainly driven by boundary choices and how adoption and pricing are treated year to year. Our approach keeps the total traceable to livestock and aquaculture activity, species-level usage patterns, and realistic price ranges, and then it is re-checked through interviews so the final value stays practical to replicate.


Key Questions Answered in the Report
How large is the feed carotenoids market in 2026?
It totals USD 3.41 billion and is on track to reach USD 4.59 billion by 2031, translating to a 6.14% CAGR.
Which product dominates current demand?
Astaxanthin leads with 31.95% share, mainly because salmonid farms link strong pigmentation with premium retail pricing.
Why are natural carotenoids gaining popularity?
European labeling rules and U.S. clean-feed claims favor plant- and algae-derived sources, boosting natural variants at a 9.48% CAGR.
Which region is growing fastest?
North America posts the highest 7.55% CAGR, driven by large aquaculture industry and emerging intensive poultry systems across the region.
What form factor is expanding most rapidly?
Beadlet technology grows at 8.05% CAGR owing to enhanced bioavailability and heat-stable logistics advantages.
How did the 2024 production outages affect the market?
BASF and DSM-Firmenich disruptions tightened synthetic supplies, shifted purchasing toward diversified sources, and elevated the strategic value of reliable delivery schedules.
Page last updated on:


 Your data is secure and never sold or shared.


