
Fish And Shrimp Feed Additives Market Size and Share
Market Overview
| Study Period | 2021 - 2031 |
|---|---|
| Market Size (2026) | USD 4.47 Billion |
| Market Size (2031) | USD 6.11 Billion |
| Growth Rate (2026 - 2031) | 6.45 % |
| Fastest Growing Market | Asia Pacific |
| Largest Market | Asia Pacific |
| Market Concentration | Medium |
Major Players *Disclaimer: Major Players sorted in no particular order Image © Mordor Intelligence. Reuse requires attribution under CC BY 4.0. | |
Fish And Shrimp Feed Additives Market Analysis by Mordor Intelligence
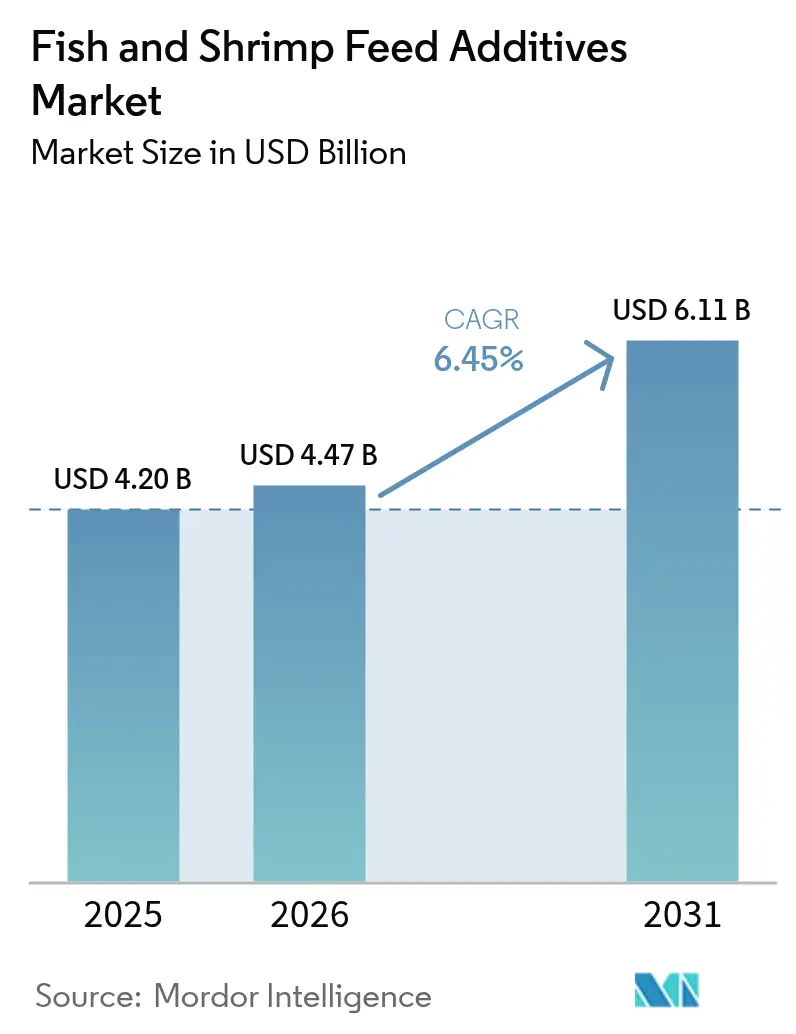
The fish and shrimp feed additives market size in 2026 is estimated at USD 4.47 billion, growing from 2025 value of USD 4.20 billion with 2031 projections showing USD 6.11 billion, growing at 6.45% CAGR over 2026-2031. Robust growth stems from the aquaculture sector’s shift toward sustainable intensification, where functional additives safeguard water quality and animal health while supporting higher stocking densities. Regulatory pressure to eliminate prophylactic antibiotics is accelerating the substitution of medicated rations with immune-modulating solutions that keep production efficiency intact. Asia-Pacific retains a decisive lead due to export-driven shrimp farming in Vietnam and Indonesia, coupled with China’s move into recirculating aquaculture systems that demand precision nutrition. Rapid technology adoption, from encapsulated delivery platforms to artificial-intelligence-enabled feeding, further enlarges the addressable base for additive suppliers. Meanwhile, consolidation among feed producers and ingredient makers is compressing supply chains, enabling larger firms to capture margin across the value chain.
Key Report Takeaways
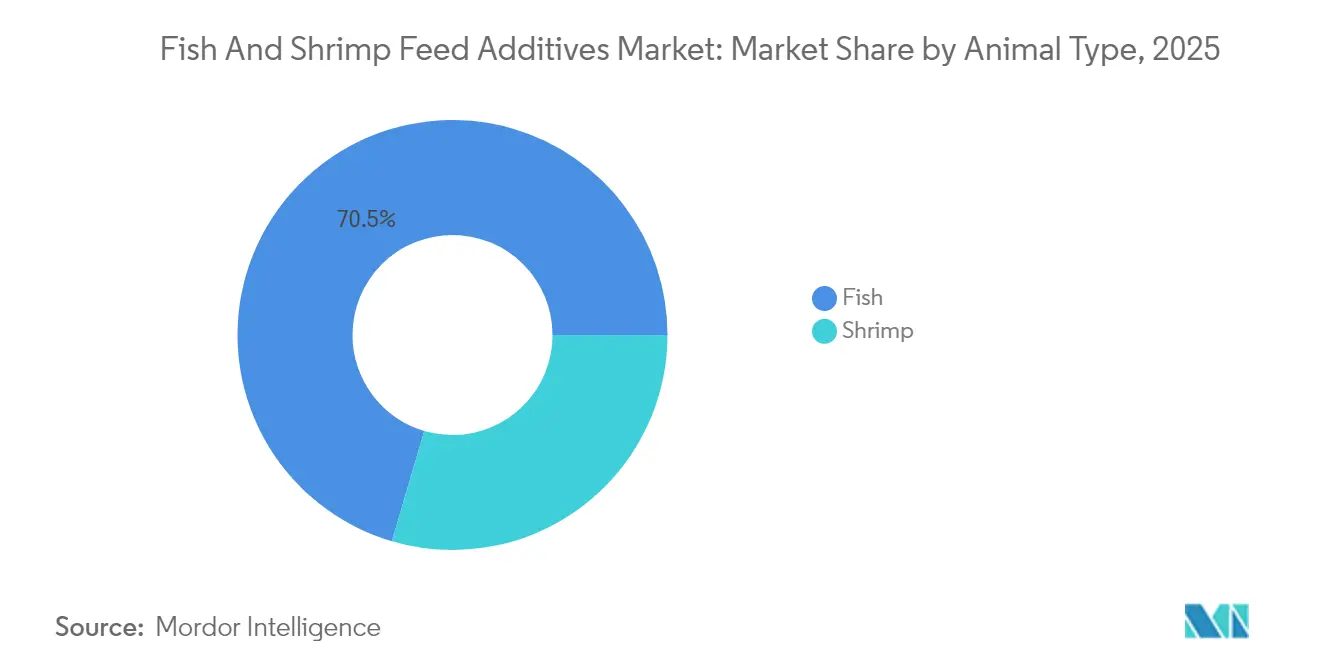
- By animal type, fish held 70.45% of the fish and shrimp feed additives market share in 2025, whereas shrimp is expanding at a 7.38% CAGR through 2031.
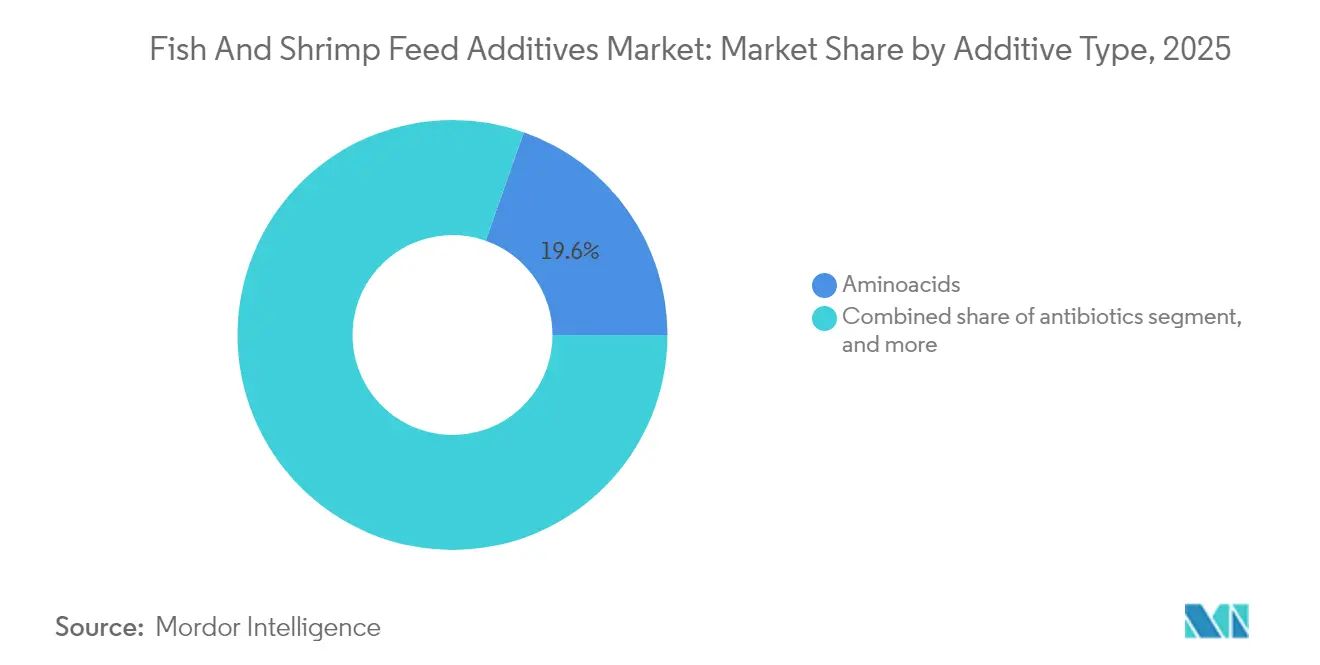
- By additive type, amino acids commanded a 19.62% share of the fish and shrimp feed additives market size in 2025, while probiotics logged the highest 9.45% CAGR to 2031.
- By form, dry products accounted for 62.35% revenue share in 2025, encapsulated formats are advancing at a 9.78% CAGR.
- By geography, Asia-Pacific captured 36.58% of global revenue in 2025 and is growing fastest at a 6.92% CAGR through 2031.
- The competitive landscape is moderately consolidated, with leading feed manufacturers actively pursuing vertical integration and technology acquisitions to secure supply chains and widen product portfolios.
Note: Market size and forecast figures in this report are generated using Mordor Intelligence’s proprietary estimation framework, updated with the latest available data and insights as of 2026.
Global Fish And Shrimp Feed Additives Market Trends and Insights
Drivers Impact Analysis*
| Driver | (~) % Impact on CAGR Forecast | Geographic Relevance | Impact Timeline |
|---|---|---|---|
| Growing global seafood consumption | +1.1% | Asia-Pacific and North America | Long term (≥ 4 years) |
| Expansion of export-oriented aquaculture | +0.8% | South America and Asia-Pacific | Medium term (2-4 years) |
| Government incentives and subsidies for sustainable aquaculture | +1.2% | European Union, North America, and select Asia-Pacific markets | Medium term (2-4 years) |
| Functional feed additives for immune modulation | +0.9% | Intensive farming hubs worldwide | Short term (≤ 2 years) |
| Adoption of insect- and algae-based additive ingredients | +0.7% | European Union, North America, and advanced Asia-Pacific markets | Long term (≥ 4 years) |
| Precision feeding platforms boosting additive utilization | +1.0% | Developed markets with high technology penetration | Medium term (2-4 years) |
| Source: Mordor Intelligence | |||
Growing global seafood consumption
Escalating demand for premium, traceable seafood encourages producers to upgrade rations with additives that boost feed conversion rates and minimize environmental footprints. High-value importers tie antibiotic-free certification to market access, turning immune-supporting compounds from optional extras into essential inputs. Specialized ingredients that enhance fillet quality, color, and omega-3 profiles secure price premiums in retail channels. Digital sustainability platforms, such as DSM-Firmenich’s Sustell, help farmers quantify additive-linked carbon reductions and communicate them to buyers.[1]Source: DSM-Firmenich, “Protecting Aquatic Species: Strategies for Pathogen Management,” dsm-firmenich.com As consumption outpaces supply from capture fisheries, aquaculture expansion reinforces long-term additive demand.
Expansion of export-oriented aquaculture
Ecuadorian shrimp operators exemplify how export accreditation drives the adoption of probiotics and enzymes that curb antibiotic residues while preserving survival during lengthy logistics to Europe and North America. Similar patterns hold in Vietnam and Indonesia, where premium additives offset the costs of triple testing regimes required by importers. Carbon footprint disclosures, such as BioMar’s 5.2 kg CO₂-equivalent per kg shrimp benchmark, underline the value of low-impact formulations that simplify certification. Export premiums justify investments that raise survival and growth, reinforcing additive spend even in price-sensitive markets.
Government incentives and subsidies for sustainable aquaculture
Subsidy structures in the European Union and North America reward verified improvements in feed conversion ratio and water quality, prompting farmers to leverage enzyme blends and organic acids that deliver measurable gains. The Corporate Sustainability Reporting Directive expands mandatory Scope 3 reporting, effectively monetizing additive-driven efficiency. Grants for precision feeding systems enhance additive uptake, as real-time dosing ensures compliance with nutrient discharge limits. Similar schemes are emerging in China and India, where provincial authorities issue low-interest loans for recirculating systems contingent on antibiotic reductions. Suppliers able to furnish life-cycle documentation gain a competitive edge in these bid processes.
Precision feeding platforms boosting additive utilization
Sensor suites measuring water quality, biomass, and feeding behavior feed artificial intelligence (AI) algorithms that modulate additive inclusion rates in real time.[2]Source: MDPI, “An Automated Fish-Feeding System Based on CNN and GRU Neural Networks,” mdpi.com Dynamic dosing heightens efficacy and trims wastage, delivering quick paybacks that spur large-scale adoption in Norway, Canada, and Australia. Computer vision tracks fish appetite, alerting managers to health deviations before clinical signs appear, allowing prophylactic boosts of acidifiers or probiotics. Integrating additive data into farm management software also automates audit trails needed for certification programs. As hardware prices fall, mid-tier farms in Asia-Pacific are beginning pilot deployments funded through development loans tied to digitalization targets.
Restraints Impact Analysis*
| Restraint | (~) % Impact on CAGR Forecast | Geographic Relevance | Impact Timeline |
|---|---|---|---|
| Raw-material price volatility | –0.6% | Import-dependent regions worldwide | Short term (≤ 2 years) |
| Recurring disease outbreaks in aquaculture | –0.4% | Asia-Pacific and South America intensive hubs | Short term (≤ 2 years) |
| Global antibiotic bans raising reformulation costs | –0.8% | European Union, North America, expanding Asia-Pacific | Medium term (2-4 years) |
| Carbon-footprint reporting pressure on synthetic additives | –0.5% | European Union, North America, export-oriented growers | Long term (≥ 4 years) |
| Source: Mordor Intelligence | |||
Global antibiotic bans raising reformulation costs
FDA (Food and Drug Administration) Guidance for Industry 293 and EFSA updates impose extra testing, documentation, and validation steps for alternative ingredients[3]Source: Pet Food Processing, “FDA Releases Final Enforcement Policy on AAFCO-Defined Ingredients,” petfoodprocessing.net. Reformulating feeds without antibiotics demands trials, analytics, and monitoring infrastructure that raise costs before returns materialize. Smaller mills lack dedicated R&D teams, pushing them toward turnkey solutions from multinationals at premium pricing. Divergent rules across import markets further complicate rollouts, stretching regulatory teams thin and extending time to revenue for new additives.
Carbon-footprint reporting pressure on synthetic additives
Scope 3 emissions accounting under the Corporate Sustainability Reporting Directive pushes buyers to prefer low-impact natural inputs even if traditional synthetics deliver similar or better performance. Synthetic vitamin and organic acid production can be energy-intensive, translating into higher embedded carbon. Suppliers must invest in life-cycle assessments, supply-chain optimization, and greener chemistries, increasing operating expenses. Premiums on verified low-carbon additives may not fully offset the added cost, especially in commodity fish segments competing on narrow margins.
*Our forecasts treat driver/restraint impacts as directional, not additive. The impact forecasts reflect baseline growth, mix effects, and variable interactions.
Segment Analysis
By Animal Type: Feed Economics Favor Fish Dominance
The fish occupied 70.45% of the fish and shrimp feed additives market size in 2025. Salmon, trout, and sea bass farms leverage higher biomass volumes and stable logistics to spread additive costs across output, reinforcing economies of scale. Improved feed conversion from enzyme complexes raises profitability, justifying premium formulations. Shrimp operations, while smaller in volume, post a 7.38% CAGR because intensive systems in Southeast Asia and South America need immune-supporting blends to prevent mass mortality events.
Species diversification introduces niche opportunities. Barramundi, catfish, and emerging land-based marine species require tailored micronutrient profiles. Precision-feeding hardware allows species-specific dosing, boosting the efficacy of encapsulated probiotics and essential oil blends. DSM-Firmenich’s Sustell module for sea bass and sea bream illustrates the trend toward bespoke sustainability analytics. As more producers adopt recirculating aquaculture systems, water-stable additives that minimize leaching will claim higher shares, lifting value growth above volume gains in both fish and shrimp lines.



By Additive Type: Probiotics Gain Momentum
Amino acids maintained 19.62% revenue leadership in 2025 because their role in protein synthesis is irreplaceable, and regulatory clearance is universal. Yet probiotics are advancing at 9.45% CAGR, the quickest among categories, as farmers shift from reactionary disease treatment to microbiome management. Vitamins and minerals supply foundational nutrition, but a limited scope for premium differentiation caps their growth.
Feed enzymes demonstrate rising traction where alternative raw materials need digestibility upgrades, notably in Brazil’s tilapia sector and India’s carp farms. Antioxidants and essential oils serve dual roles of shelf-life extension and immune support, attracting steady interest in tropical climates. The European Food Safety Authority’s 2024 authorization of DSM-Firmenich’s HiPhorius phytase for all fin fish underscores the continuing approvals pipeline. Collectively, functional categories are set to expand their portion of the fish and shrimp feed additives market beyond commodity nutrient blends.
By Form: Encapsulation Drives Targeted Delivery
Dry powders accounted for 62.35% of revenue in 2025, benefiting from compatibility with widespread pelleting infrastructure and straightforward logistics. Nevertheless, encapsulated formats are tracking a 9.78% CAGR as producers pay for the protection of heat-sensitive probiotics and enzymes during extrusion. Encapsulation also enables timed release, increasing active uptake and slashing leaching into pond water.
Wider commercial use is unlocking previously unviable ingredients, such as multi-strain probiotics that need gastric-phase shielding. Marine-grade coatings withstand exposure to saline environments, making them suitable for offshore cage farms. Liquid additives are used in hatcheries and therapeutic situations that demand instant bioavailability. Kemin Industries’ AquaCURB line, offered in both liquid and dry variants, typifies the multi-format strategy addressing diverse production realities.
Geography Analysis
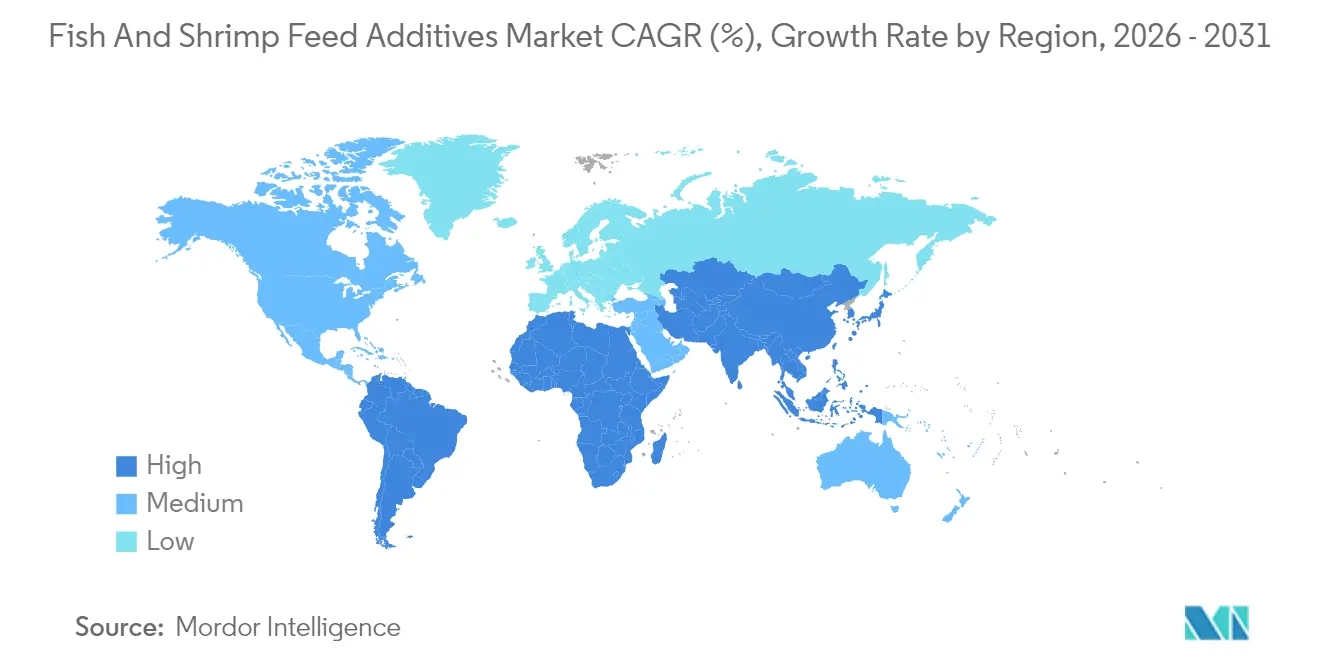
Asia-Pacific led with 36.58% of 2025 revenue and is projected to compound at 6.92% through 2031, cementing its status as the anchor of the fish and shrimp feed additives market. China’s transition toward recirculating aquaculture systems intensifies demand for precise, water-stable additives. Vietnamese and Indonesian shrimp exporters rely on probiotics and organic acids to satisfy antibiotic-free certifications required by European Union and United States buyers. India’s coastal expansion and Indonesia’s barramundi initiatives are adding fresh volume, supported by partnerships such as Skretting and NewSeas.
South America mirrors Asia’s intensity, with Ecuador’s shrimp exports in 2023 topping USD 7.2 billion from 1.2 million metric tons, anchoring additive sales tied to survival improvement and carbon labeling. Chilean salmon producers struggle with disease control, channeling spending toward acidifiers and vaccine-supportive nutrients. Brazilian tilapia farms invest in enzyme blends that unlock cheaper local feedstuffs, keeping unit costs competitive. Government subsidies aimed at sustainable output and traceability further encourage functional additive uptake across the region.
Europe and North America represent mature yet influential destinations that shape regulatory norms. Norway’s salmon giants demand encapsulated astaxanthin and algae oil to sustain flesh color and omega-3 levels. Canada’s growing land-based sector experiments with AI-based feeding that optimizes additive inclusion. Stringent approval regimes favor suppliers with robust dossiers, limiting new entrants and strengthening established brands.
Middle East and Africa are nascent but fast-growing. Egypt’s tilapia boom and Saudi Arabia’s food-security investments create appetite for technical support bundled with additive supply. Nigeria and South Africa expand catfish and marine operations, favoring cost-effective acidifiers that extend feed shelf life in hot climates. DSM-Firmenich’s 10,000 metric tons plant in Egypt underscores the move toward local production that trims lead times and import duties

Regulatory Landscape
Regulation centers on pre-market authorization, labeling, and ongoing renewals that determine whether additives can be used in compound aquafeeds and the conditions of inclusion. In the European Union, Regulation (EC) No 1831/2003 governs feed additive approvals across species, with EFSA-led dossier review feeding into Commission Implementing Regulations that renew or amend authorizations. Implementing Regulation (EU) 2026/460 renewed thiamine hydrochloride and thiamine mononitrate for all animal species, and Implementing Regulation (EU) 2026/164 renewed choline chloride aqueous solution and preparations, highlighting the recurring reauthorization cadence that suppliers must support with safety and quality data.
In the United States, the FDA Center for Veterinary Medicine regulates aquaculture feed additives under the Federal Food, Drug, and Cosmetic Act. Market access commonly relies on the Food Additive Petition pathway or GRAS positioning, and FDA guidance such as CVM GFI #53 frames how utility is evaluated in diets fed to aquatic animals. China continues to use catalog-based control overseen by the Ministry of Agriculture and Rural Affairs (MARA), and MARA Announcement No. 862 (December 2024) approved new feed additive varieties and expanded the scope of existing additives. This reinforces the need for multinational suppliers to manage fragmented national catalogs alongside EU and US requirements when selling functional additives into export-oriented aquaculture hubs.
Competitive Landscape
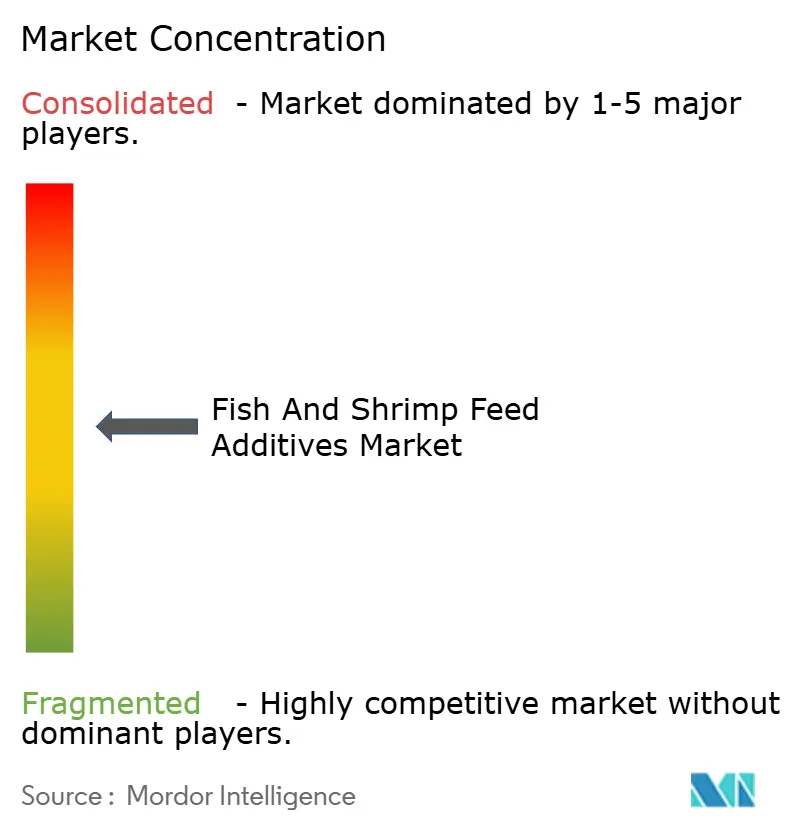
The fish and shrimp feed additives industry remains moderately consolidated, with Cargill Incorporated, Nutreco (SHV Holdings N.V.), Biomar Group (Schouw and Co.), Alltech Inc., and ADM (Archer Daniels Midland Company) together accounting for 52% of global revenue in 2024. These corporations pursue vertical integration so that sourcing, formulation, and distribution sit under one roof, limiting supply‐chain risk and capturing more value along the feed continuum. Cargill Incorporated strengthened its North American footprint in September 2024 through the purchase of two United States feed mills once owned by Compana Pet Brands, boosting regional capacity for specialty additives. ADM expanded its presence in Southeast Asia by acquiring PT Trouw Nutrition Indonesia in January 2025, giving the company locally tailored production for the world’s largest shrimp cluster.
Nutreco’s Skretting arm signed a memorandum of understanding with NewSeas in 2024 to co-develop barramundi farming in Indonesia, a move that aligns additive innovation with on-farm performance goals. Biomar Group advanced its sustainability credentials by publishing a shrimp life-cycle assessment that links additive selection to carbon footprints, helping customers win export certification in Europe and North America. Alltech Inc continues to leverage its extensive probiotic and enzyme catalog to provide turnkey reformulation support as global antibiotic limits tighten. Scale advantages in regulatory compliance allow these five companies to navigate United States Food and Drug Administration and European Food Safety Authority dossiers faster than regional rivals, accelerating time-to-market for new functional ingredients.
Despite their reach, pricing power stays moderate because raw-material volatility and buyer concentration among large shrimp and salmon exporters restrain margin expansion. The majors focus on verified sustainability impacts, life-cycle assessments, and blockchain traceability to differentiate offerings rather than relying on aggressive discounting. Technology alliances that connect on-farm sensors with cloud analytics are becoming common, tying additive sales to guaranteed performance metrics and creating stickier customer relationships. White-space remains in species-specific formulations and precision delivery systems, which smaller innovators can still explore before being acquired or partnered by the big five.
Fish And Shrimp Feed Additives Industry Leaders
Cargill Incorporated
Nutreco (SHV Holdings N.V.)
Biomar Group (Schouw & Co.)
Alltech Inc
ADM (Archer Daniels Midland Company)
- *Disclaimer: Major Players sorted in no particular order

Market Opportunities and Future Outlook
Opportunities are concentrated in functional, science-documented additive packages that replace prophylactic antibiotic positioning with measurable outcomes on survival, robustness, and cost-per-kg produced in intensive systems. Shrimp disease pressure, including challenges such as WSSV, Vibrio, and EHP, keeps demand active for probiotics, organic acids, antioxidants, and immunomodulators that can be embedded into complete feeds and validated through farm trials rather than sold as standalone claims. New product and trial activity supports this direction, including Aquabloom reporting May 2026 trial results for a seaweed-based immunomodulatory additive in Indonesia, and ADM advancing additive concepts in shrimp diets such as plant-sterol-based approaches presented around Aquaculture America 2026, broadening the menu of non-antibiotic performance tools.
A second area of opportunity is delivery and traceability. Additives that can be dosed precisely and audited cleanly fit farms adopting AI-enabled feeding and buyers requesting sustainability documentation. Platforms such as DSM-Firmenich's Sustell, used to quantify feed-linked impacts, can help additive suppliers sell differentiated, lower-footprint formulations into exporters and into regions facing expanding corporate reporting requirements. Circular and alternative inputs also create room for additive innovation that stabilizes performance when fishmeal inclusion falls, and industry initiatives highlighted by Alltech Coppens in early 2026 on circular ingredient usage align with enzyme, probiotic, and gut-health additive programs that help maintain digestibility and resilience as formulations shift.
Recent Industry Developments
- March 2026: ADM and Alltech announced the combination of their respective feed businesses under a new entity named Akralos. The integration pools formulation, manufacturing, and commercial capabilities that can accelerate rollout of functional additive packages across aquaculture species. It also raises competitive pressure on mid-sized additive suppliers as larger integrated groups bundle additives with complete-feed and technical-service contracts.
- September 2025: ADM launched Nutripiscis Oxygen, a nutritional additive blend for tilapia aimed at supporting productivity under environmental stressors such as fluctuating oxygen levels and temperatures. The launch targets a high-volume warmwater species where stress events can quickly translate into feed inefficiency and health issues. It supports a shift toward condition-specific additive solutions rather than generic micronutrient fortification.
- December 2024: BioMar launched SmartCare Endurance, a feed solution featuring a blend of antioxidants, vitamins, and minerals designed to help farmed fish manage oxidative stress and improve disease resistance. By packaging multiple functional components into a branded concept, BioMar strengthened differentiation in premium aquafeed programs. It also increased the role of validated functional additives in salmon-oriented diets.


Research Methodology Framework and Report Scope
Market Definition and Coverage
This market covers feed additives that are intentionally added to formulated aquaculture feed for fish and shrimp to improve nutrition, health support, and feed performance. We capture value at the additive level within finished feed formulations, and track it across the main aquaculture producing and consuming regions.
Scope exclusions: It excludes complete fish or shrimp feed and other farm inputs that are not feed additives (such as equipment, medicines sold outside feed, and on-farm services).
Segmentation Overview
- By Animal Type
- Fish
- Shrimp
- By Additive Type
- Amino Acids
- Antibiotics
- Vitamins
- Antioxidants
- Feed Enzymes
- Probiotics
- Organic Acids
- Essential Oils and Plant Extracts
- Minerals
- Prebiotics
- By Form
- Dry (Powder/Granules)
- Liquid
- Encapsulated/Coated
- By Geography
- North America
- United States
- Canada
- Mexico
- Rest of North America
- South America
- Brazil
- Ecuador
- Chile
- Rest of South America
- Europe
- Germany
- United Kingdom
- France
- Spain
- Norway
- Russia
- Rest of Europe
- Asia-Pacific
- China
- India
- Japan
- Vietnam
- Indonesia
- Rest of Asia-Pacific
- Middle East
- Saudi Arabia
- United Arab Emirates
- Rest of Middle East
- Africa
- Egypt
- Nigeria
- Rest of Africa
- North America
Data Sources, Market Sizing, and Validation
Desk Research
Desk research was used to build the base demand pool and to anchor the model to real-world aquaculture production and feed-use patterns before we moved into interviews. Public sources, such as FAO fisheries and aquaculture datasets, national fisheries and aquaculture statistics, customs and trade portals for key feed ingredients, and publications from aquaculture and feed trade associations, were reviewed to understand production volumes, species mix, and feed intensity trends.
We also used company annual reports, investor presentations, and trusted industry press to map how additive portfolios are positioned across fish and shrimp feed, and how pricing is typically discussed (for example, by additive category and inclusion rate ranges). Patent databases were selectively checked to confirm where innovation is active in enzymes, probiotics, and functional botanicals. In a few cases, paid subscriptions for company financials and for shipment-level trade signals were referenced to cross-check scale and regional flows. The desk sources listed above are illustrative only, and many other public documents were referred to for data collection, validation, and research clarification.
Primary Interviews and Surveys
Primary work focused on validating the share of additives within fish and shrimp feed, typical inclusion rates, and how pricing moves by region and by additive family. We spoke with a mix of feed formulators, aquaculture farm decision-makers, additive distributors, and technical specialists, which helped close gaps that desk sources do not explain well, such as adoption differences between intensive shrimp systems and mainstream fish farming. Coverage was balanced across APAC, EMEA, and the Americas so assumptions around disease pressure, regulatory limits, and feed conversion targets could be checked, then aligned back to the model.
Distribution of primary research fieldwork respondents
| Company type | Respondent position | Region |
|---|---|---|
| Top tier: 28% | CXOs: 17% | APAC: 48% |
| Mid tier: 51% | Functional/Unit leaders: 26% | EMEA: 31% |
| Smaller Players: 21% | Managers: 57% | Americas: 21% |
Market-Sizing & Forecasting
Sizing starts with a top-down demand reconstruction where aquaculture output and species mix are translated into feed consumption, and then into additive spend using representative inclusion rates and pricing by additive category. To keep the model aligned with how the industry buys, we used inputs such as fish and shrimp production volumes, compound feed penetration, typical feed conversion ratios, additive inclusion rates in finished feed, and average selling price ranges by additive family, which were then adjusted for regional regulations and farm intensity levels.
Once the first pass totals were formed, they were corroborated with selective bottom-up approximations, such as sampling supplier portfolios, checking channel markups, and applying ASP times estimated volumes for a limited set of additive categories where data quality was stronger. Where bottom-up signals were incomplete, gaps were handled by using conservative penetration bands that were validated in interviews, followed by sensitivity checks on the two biggest levers, namely inclusion rates and price progression.
Forecasts were built using scenario analysis, since demand can shift with disease cycles, raw material pricing, and farm-level margins. Growth assumptions were informed by expert views on intensification trends, tighter biosecurity, and the gradual move from basic nutrition additives toward functional additives, and then stress-tested against expected aquaculture volume growth and feed-use changes.
Data Validation & Update Cycle
Validation is done by triangulating model outputs with independent signals, including aquaculture production trends, feed manufacturing expansion cues, and trade and pricing movements for key additive inputs. Any unusual jumps are reviewed at the variable level, and if the variance cannot be explained by a known driver, the assumption is revisited and respondents are re-contacted for clarification before sign-off.
Each dataset and calculation step is checked in a multi-stage internal review so that arithmetic, unit conversions, and currency timing are consistent across regions. The report is refreshed annually, and interim updates are triggered when there are material events, such as sharp regulatory changes or sudden disease outbreaks, that can shift additive usage. Before delivery, a final analyst pass is completed so clients receive the latest updated view.
Mordor Intelligence's Global Fish Shrimp Feed Additives Market Market Estimate Compared With Other Published Estimates
Published market sizes for fish and shrimp feed additives can look far apart because the underlying boundaries are not always the same, even when the titles sound similar. The most common reasons are whether complete aquafeed additives are included, how broad the species coverage is, and whether the value is counted at the additive level versus a wider feed and additives bundle.
Differences also come from how firms treat adoption rates in shrimp versus fish diets, how they move prices over time, and whether they use a single global average or region-specific mix and currency timing. When these points are not checked back to aquaculture output and feed-use reality, the final market number can drift upward or downward in a way that is hard to reconcile.
Benchmark comparison
| Source | Market Size | Gaps in Research Methodology |
|---|---|---|
| Mordor Intelligence | USD 4.47 B (2026) | |
| Industry Publisher A | USD 59.63 B (2026) | This figure appears to use a much wider universe that can blend fish feed additives and shrimp feed additives with broader aquafeed additive spend, which lifts totals versus an additive-only view tied to fish and shrimp formulated feed. |
| Research Platform B | USD 20.53 B (2025) | This estimate is for aquafeed additives overall and is not limited to fish and shrimp diets, and it uses a different base year, which makes the number not directly comparable without adjusting for species scope and year. |
The table shows a large spread mainly because some published totals expand the scope to all aquafeed additives or mix in broader feed-related value. In Mordor Intelligence's model, only additives used in fish and shrimp formulated feed are counted, and the measurement is at the additive layer (not as complete feed value). With that scope kept consistent, the size is traceable to practical inputs such as aquaculture output, feed use, and additive inclusion and pricing ranges, which makes the estimate easier to replicate and update.


Key Questions Answered in the Report
What is the current value of the fish and shrimp feed additives market?
The fish and shrimp feed additives market reached USD 4.47 billion in 2026 and is forecast to hit USD 6.11 billion by 2031.
Which region leads demand for fish and shrimp feed additives?
Asia-Pacific generates 36.58% of global revenue and posts the fastest 6.92% CAGR through 2031.
Which additive category is growing fastest?
Probiotics show the highest 9.45% CAGR as producers focus on microbiome management.
What share does fish hold versus shrimp?
Fish account for 70.45% of additive revenue in 2025, while shrimp is the faster-growing segment at 7.38% CAGR.
Page last updated on:


 Your data is secure and never sold or shared.


