Market Overview
| Study Period | 2021 - 2031 |
|---|---|
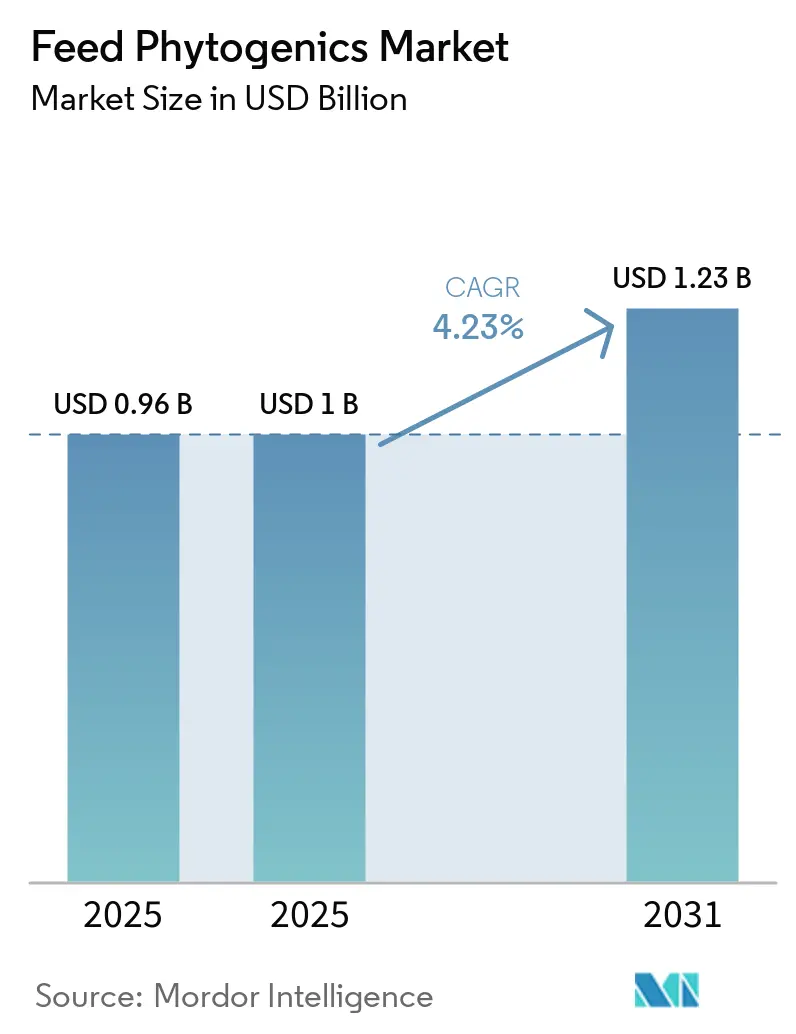
| Market Size (2025) | USD 1 Billion |
| Market Size (2031) | USD 1.23 Billion |
| Growth Rate (2026 - 2031) | 4.23% CAGR |
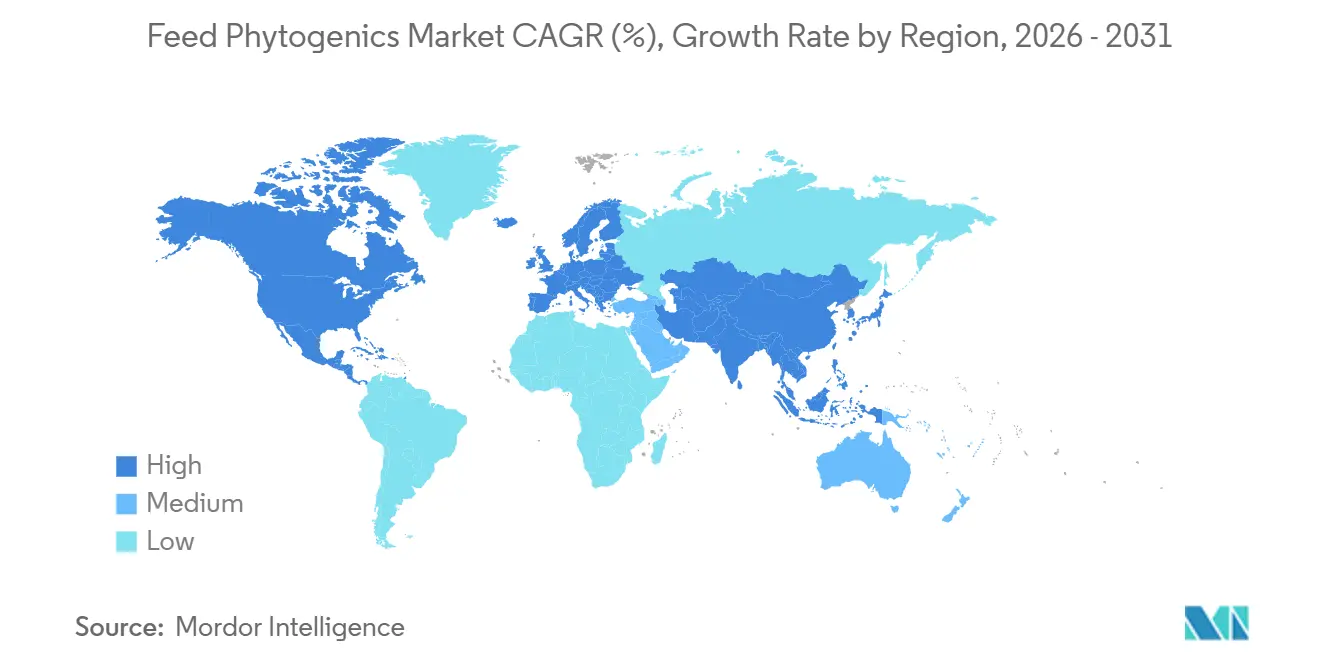
| Fastest Growing Market | North America |
| Largest Market | Asia Pacific |
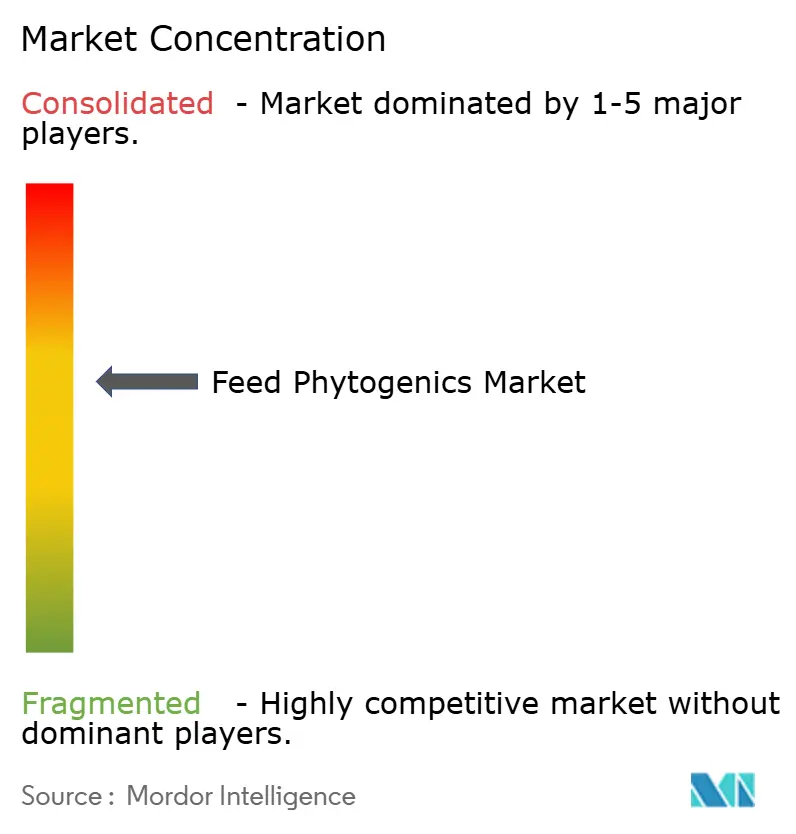
| Market Concentration | Medium |
Major Players *Disclaimer: Major Players sorted in no particular order Image © Mordor Intelligence. Reuse requires attribution under CC BY 4.0. | |
Feed Phytogenics Market Analysis by Mordor Intelligence
The feed phytogenics market size is projected to increase from USD 0.96 billion in 2025 to USD 1.00 billion in 2026 and reach USD 1.23 billion by 2031, growing at a CAGR of 4.23% over 2026 to 2031. The feed phytogenics market is being shaped first by tighter limits on antibiotic growth promoters across major livestock- and aquaculture-producing countries, which are changing additive choices in a lasting way. Adoption is moving beyond simple antibiotic replacement, as producers now use phytogenic blends to support gut health, feed efficiency, and carcass quality in a single formulation. The feed phytogenics market also benefits from broader demand for residue-free animal protein, especially as retailers and foodservice buyers set stricter sourcing standards. Competition remains moderate, with global leaders benefiting from significant scale. However, regional formulators and specialized botanical extractors continue to capitalize on opportunities in niche applications. Volatility in raw material costs and inconsistent regulatory definitions pose challenges to faster adoption. Advancements in microencapsulation and precision delivery are improving the category's commercial viability in cost-sensitive production systems.
Key Report Takeaways
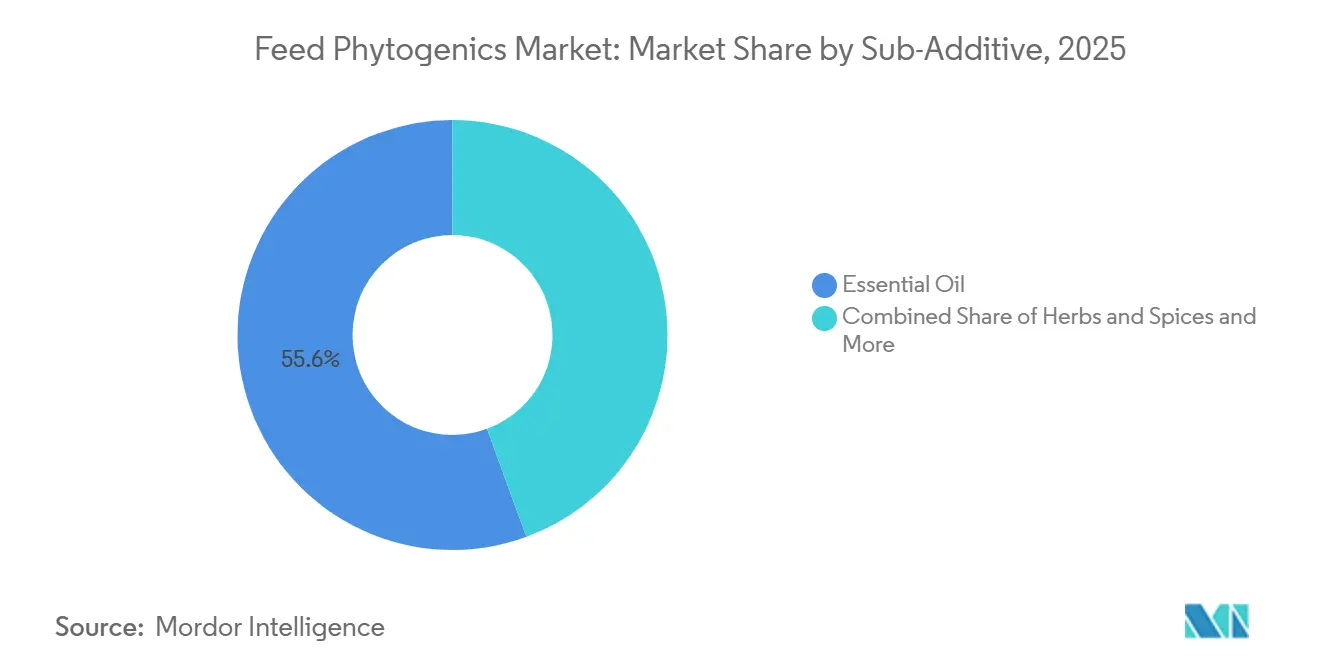
- By sub‐additive, essential oils are the largest segment, capturing 55.6% of the feed phytogenics market share in 2025, whereas herbs and spices are the fastest-growing segment, projected to grow at a 4.1% CAGR from 2026 to 2031.
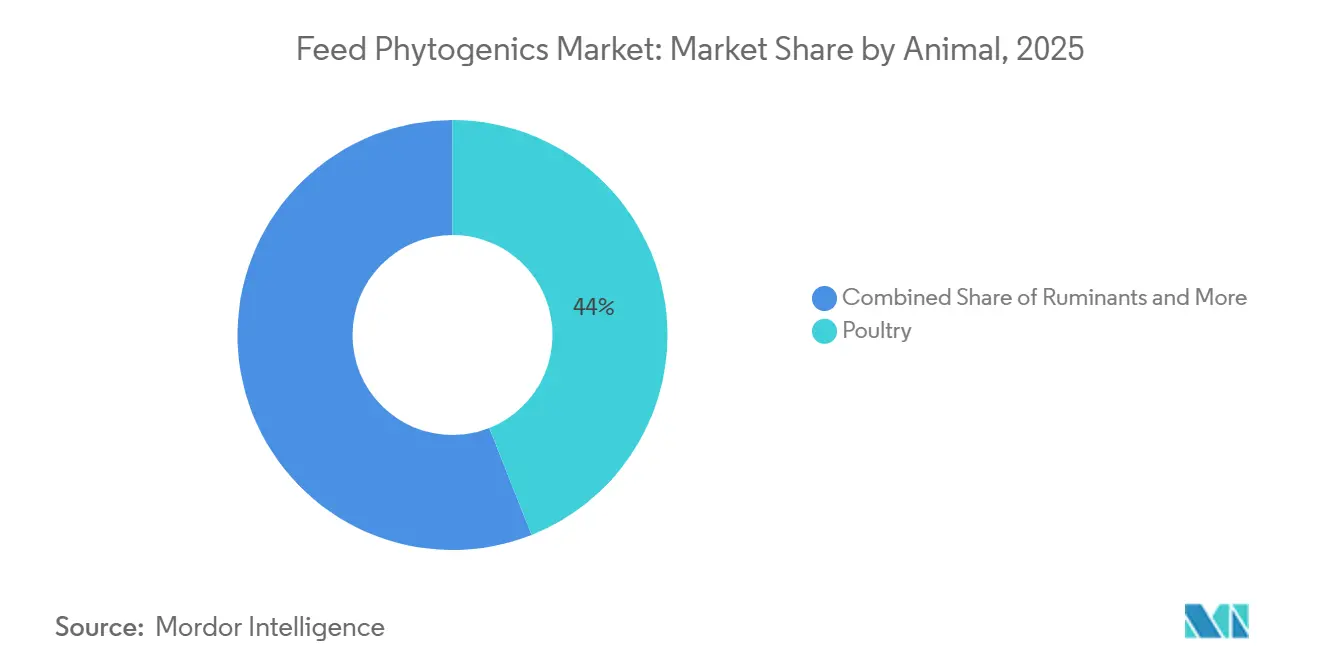
- By animal type, poultry is the largest segment, capturing 44.0% of the feed phytogenics market size in 2025, while aquaculture is the fastest-growing segment, projected to grow at an 8.5% CAGR from 2026 to 2031.
- By geography, Asia-Pacific is the largest region, accounting for 23.8% of the feed phytogenics market share in 2025, while North America is the fastest-growing region, forecast to expand at a 3.5% CAGR through 2026 to 2031.
Note: Market size and forecast figures in this report are generated using Mordor Intelligence’s proprietary estimation framework, updated with the latest available data and insights as of January 2026.
Global Feed Phytogenics Market Trends and Insights
Drivers Impact Analysis*
| Driver | (~) % Impact on CAGR Forecast | Geographic Relevance | Impact Timeline |
|---|---|---|---|
| Regulatory phaseout of antibiotic growth promoters | +1.2% | Global, with faster policy movement in the Europe Union, China, India, and the United States | Short term (≤ 2 years) |
| Residue-free protein demand | +0.7% | Global, concentrated in North America, Europe, and urban Asia-Pacific markets | Medium term (2-4 years) |
| Poultry focus on feed efficiency and gut health | +0.6% | Asia-Pacific, North America, and Europe | Short term (≤ 2 years) |
| Efficacy validation and formulation science | +0.5% | Global | Medium term (2-4 years) |
| Microencapsulation and precision dosing | +0.4% | Global, with earlier uptake in Europe and North America | Medium term (2-4 years) |
| Ruminant methane programs | +0.2% | Europe, Oceania, North America, and spillover into Brazil | Long term (≥ 4 years) |
| Source: Mordor Intelligence | |||


Regulatory Phaseout of Antibiotic Growth Promoters
Government restrictions on veterinary antibiotic use continue to turn interest in botanical additives into real commercial demand across the feed phytogenics market. The European Medicines Agency reported that the European Commission has set targets as part of its efforts to address antimicrobial resistance, including an aspirational goal to reduce overall European Union sales of antimicrobials for farmed animals and in aquaculture by 50% by 2030[1]Source: European Medicines Agency, “European Surveillance of Veterinary Antimicrobial Consumption — Annual Surveillance Report 2024,” European Medicines Agency, ema.europa.eu. India also moved ahead with restrictions that took effect in April 2025, adding momentum to one of the world’s largest broiler and aquaculture production bases. As these national rules expand at different speeds, multinational feed companies are finding that broad-spectrum phytogenic formulations are easier to manage than antibiotic approvals that vary by jurisdiction.
Residue-Free Protein Demand
The feed phytogenics market is also being pulled forward by retailer and foodservice demand for residue-free meat, eggs, dairy, and aquaculture products. By 2025, antibiotic-free sourcing requirements had moved further into mainstream procurement standards in North America and Europe, pushing suppliers to support the claim at the feed level. A 2025 study in Frontiers in Veterinary Science found that phytogenics modulate gut microbiota and immune function in commercial poultry, which supports their use in performance programs tied to residue-free production. Producers that accept the additive cost can often recover it through premium pricing or stronger buyer acceptance in antibiotic-free channels. That makes demand more durable than a short replacement cycle because the buying signal is increasingly coming from downstream protein procurement rather than only from feed additive suppliers.
Poultry Focus on Feed Efficiency and Gut Health
Poultry remains the volume center of the feed phytogenics market because broiler and layer producers have the clearest performance case for adoption. Research published in Poultry Science in 2025 showed that a phytogenic blend at 0.25% of the diet improved intestinal villus width by 5.3%, villus height by 4.8%, and absorptive surface area by 12.5% in commercial broilers. These kinds of measured outputs matter because poultry nutrition teams need repeatable data before they expand inclusion across integrated systems. As the evidence base grows, older growth-promoter programs are becoming harder to defend, where phytogenic products can show both biological and commercial value.
Efficacy Validation and Formulation Science
A more structured efficacy pathway is strengthening confidence across the feed phytogenics market, especially in regions that use European standards as a reference point. The European Food Safety Authority (EFSA) issued guidance in 2024 on the efficacy of feed additives, establishing a clearer framework for assessing and documenting phytogenic claims in the European Union. That framework has been followed by new authorizations, including cinnamon bark essential oil in 2024 and cajeput essential oil in 2025 for broad species use. As more products clear this type of review, registration in other markets can move faster, as European Union approval often serves as a practical quality signal beyond Europe.
Restraints Impact Analysis*
| Restraint | (~) % Impact on CAGR Forecast | Geographic Relevance | Impact Timeline |
|---|---|---|---|
| Raw-material price volatility and cost premium | -0.6% | Global, with stronger sensitivity in Southeast Asia and Latin America | Short term (≤ 2 years) |
| Regulatory fragmentation | -0.5% | Global, especially where the rules of European Union, United States, and the Asia-Pacific rules diverge | Medium term (2-4 years) |
| Limited encapsulation and toll-processing capacity | -0.3% | Europe and North America | Medium term (2-4 years) |
| Botanical supply variability and traceability pressure | -0.2% | Mediterranean, South Asian, and Andean sourcing regions | Long term (≥ 4 years) |
| Source: Mordor Intelligence | |||
Raw-Material Price Volatility and Cost Premium
Raw-material price volatility remains one of the clearest limits on broader adoption in the feed phytogenics market. Unlike synthetic additives, essential oils and botanical extracts depend on crop cycles, weather conditions, harvest volumes, and supply disruptions in agricultural regions. In cost-sensitive livestock systems, even a moderate rise in botanical input prices can push buyers back toward cheaper synthetic alternatives. The problem is sharper in Southeast Asia and Latin America, where feed already accounts for a large share of total production cost. Because most aromatic plants are not actively hedged through standardized futures contracts, buyers still have few tools to manage price risk over longer procurement cycles.
Regulatory Fragmentation
The feed phytogenics market also faces a compliance burden because jurisdictions still lack a single definition for phytogenic products. A formula that is treated as a flavoring in one country may be reviewed as a zootechnical additive or a medicinal product in another, which changes the evidence and labeling requirements. European Union Regulation 2025/2575 withdrew authorization for more than 30 botanical substances from the European Union feed additive registry, creating immediate portfolio pressure for affected suppliers. That kind of regulatory reset raises recurring compliance costs for companies that maintain registrations across many markets. It also favors larger firms with deeper regulatory affairs capacity and makes broad international expansion harder for smaller developers.
*Our forecasts treat driver/restraint impacts as directional, not additive. The impact forecasts reflect baseline growth, mix effects, and variable interactions.
Segment Analysis
By Sub Additive: Essential Oils Lead, Herbs and Spices Gain Traction
Sub-additive essential oils accounted for 55.6% of the feed phytogenics market in 2025, making them the largest segment. This dominance is attributed to their long-standing commercial use and well-established antimicrobial, antioxidant, and digestive-support properties. Thymol and carvacrol, derived from thyme and oregano, still anchor a large share of essential-oil-based commercial formulations. Their appeal remains strongest in monogastric diets, where the response is better documented and easier to link to production outcomes. This evidence base helps establish essential oils in a central position in the feed phytogenics market, even as newer product types gain attention.
Herbs and spices are the fastest-growing segment, projected to grow at a 4.1% CAGR from 2026 to 2031. The market is driven by cost advantages and expanding research supporting the bioactive properties of these products. Oregano oil dominates essential oil applications due to its proven antimicrobial efficacy, while thyme and rosemary oils are gaining popularity in European markets following European Food Safety Authority (EFSA) approvals in 2024. Oleoresins are used in specialized applications that require concentrated bioactive compounds, particularly in aquaculture feeds, where water stability is a critical factor.


By Animal: Poultry Applications Drive Commercial Adoption
Poultry is the largest segment, capturing 44.0% of the feed phytogenics market in 2025, making it the primary animal segment, as broilers and layers have the deepest commercial experience with phytogenic additives. Species-specific formulation data are more developed in poultry than in any other segment, which lowers adoption risk for integrators. Swine remained the second-largest segment, where phytogenics are used for both AGP replacement and post-weaning gut support. Ruminants are advancing more slowly, but encapsulation is helping protect bioactives from rumen conditions that once limited the category.
Aquaculture is the fastest-growing segment, projected to grow at an 8.5% CAGR from 2026 to 2031. making it the fastest-growing animal segment. Growth is tied to rising resistance to synthetic sea-lice treatments, stronger interest in antibiotic-free aquaculture certification, and broader use of plant-derived compounds for gut and immune support. Commercial development is also improving as suppliers design products specifically for fish and shrimp feeding systems rather than adapting livestock formulations. That combination is expanding the role of the feed phytogenics market beyond poultry and swine, bringing more balance to the long-term animal mix.
Geography Analysis
Asia-Pacific is the largest region, accounting for 23.8% of the feed phytogenics market share in 2025. China, India, Vietnam, and Thailand combine large poultry and swine output with stricter expectations for antibiotic use. China’s broad push toward agricultural modernization and India’s 2024 antibiotic ban, effective from April 2025, are reinforcing adoption from different policy angles. A 2025 study in Veterinary Sciences reported a 21% improvement in average daily gain in Chinese commercial white-feathered broilers fed a phytogenic formula, providing the region with stronger local evidence for adoption[2]Source: J. Blue et al., “Phytogenic Blends Improve Feed Conversion Ratios Under Necrotic Enteritis Challenge in Commercial Broilers,” Poultry, mdpi.com. Asia-Pacific is also important for aquaculture, where suppliers are building products for shrimp and fish systems that need more targeted delivery and biosecurity support.
North America is the fastest-growing region, forecast to expand at a 3.5% CAGR through 2026 to 2031. The United States Food and Drug Administration (FDA) Veterinary Feed Directive and state-level restrictions in California have generated regulatory support for natural alternatives. Additionally, major food retailers' antibiotic-free sourcing requirements are encouraging producers to implement phytogenic solutions, enabling market premiums that offset higher ingredient costs. In Canada, the organic livestock sector is driving demand for certified natural feed additives, while Mexico's export-focused poultry industry is adopting phytogenics to comply with international buyer requirements.
South America is becoming more relevant as Brazil and Argentina connect large-scale livestock output with rising interest in sustainability-linked feed solutions, especially for ruminants. The Middle East and Africa remained the smallest regional contributor in 2025, but investments in domestic food security and vertically integrated poultry production are building a base for medium-term growth in the feed phytogenics market.

Competitive Landscape
The feed phytogenics market is moderately consolidated, with the top five companies such as Adisseo, IFF (Danisco Animal Nutrition), Land O'Lakes, DSM-Firmenich AG, and Cargill, Incorporated are accounting for a significant share of global sales. DSM-Firmenich AG solidified its leadership position following the 2023 merger of DSM and Firmenich, focusing investments on high-growth phytogenic solutions and precision nutrition platforms[3]Source: DSM-Firmenich, “Annual Report 2024,” DSM-Firmenich, dsm-firmenich.com. Cargill, Incorporated, enhanced its market presence by integrating Delacon Biotechnik GmbH's botanical expertise into its extensive global distribution network, maintaining its position among the leading industry participants.
Competitive differentiation increasingly hinges on proprietary extraction methods, encapsulation technologies, and advanced delivery systems. Patent activity related to heat-stable essential oil encapsulation saw a notable increase in 2024, with DSM-Firmenich AG and Kemin Industries, Inc. filing multiple applications to improve stability, bioavailability, and feed performance. Major companies are intensifying research and development (R&D) efforts to create innovative phytogenic feed additives, driven by the growing demand for antibiotic alternatives in animal nutrition. Industry participants are also collaborating with universities and research institutions to validate efficacy claims through scientifically rigorous trials. Approvals from regulatory bodies such as the European Food Safety Authority (EFSA) and the United States Food and Drug Administration (FDA) are recognized as critical for enhancing global market credibility and regulatory acceptance.
Regionally, emerging companies are focusing on niche opportunities, including aquaculture-specific phytogenic blends and lignin-based carrier technologies designed to attract sustainability-conscious customers. Supply chain resilience is becoming a key competitive factor, with manufacturers forming strategic partnerships with essential oil distillers in India and Vietnam to secure stable and competitively priced raw material supplies. These partnerships enable companies to mitigate cost volatility, ensure year-round ingredient availability, and maintain consistent product potency across seasonal production cycles.
Feed Phytogenics Industry Leaders
Adisseo
IFF(Danisco Animal Nutrition)
Land O'Lakes
DSM-Firmenich AG
Cargill, Incorporated
- *Disclaimer: Major Players sorted in no particular order

Recent Industry Developments
- February 2026: DSM-Firmenich announced that it has agreed to divest its Animal Nutrition & Health (ANH) division to CVC, a global private markets manager. ANH is a global provider of science-based solutions in animal nutrition and health. Its product portfolio includes vitamins, premixes, and feed additives, such as feed phytogenics, which enhance animal health, performance, feed efficiency, and sustainability in livestock production.
- March 2025: HealthTech Bioactives partnered with Abolis Biotechnologies to co-develop precision fermentation routes for high-value phytogenic actives, aiming to shield customers from raw botanical price swings while matching natural compound profiles.
- January 2025: The United States Food and Drug Administration (FDA) introduced the Animal Food Ingredient Consultation (AFIC) framework, creating an interim regulatory pathway for new animal feed ingredients following the FDA–Association of American Feed Control Officials (AAFCO) agreement's expiration. This is significant for the animal feed phytogenics market, offering companies a clearer process to consult regulators on ingredient safety and commercialization in the United States.


Global Feed Phytogenics Market Report Scope
Feed phytogenics are natural bioactive compounds sourced from plants and added to animal feed to enhance growth performance, digestion, immunity, and overall animal health. The feed phytogenics market report is segmented by sub-additive (essential oils, herbs and spices, and other phytogenics), by animal (aquaculture, poultry, ruminants, swine, and other animals), and by geography (North America, South America, Europe, Asia-Pacific, Middle East, and Africa). The market forecasts are provided in terms of Value (USD) and Volume (metric Tons).
Sub Additive
| Essential Oil |
| Herbs & Spices |
| Other Phytogenics |
Animal
| Aquaculture | Fish |
| Shrimp | |
| Other Aquaculture Species | |
| Poultry | Broiler |
| Layer | |
| Other Poultry Birds | |
| Ruminants | Beef Cattle |
| Dairy Cattle | |
| Other Ruminants | |
| Swine | |
| Other Animals |
Geography
| Africa | Egypt |
| Kenya | |
| South Africa | |
| Rest of Africa | |
| Asia-Pacific | Australia |
| China | |
| India | |
| Indonesia | |
| Japan | |
| Philippines | |
| South Korea | |
| Thailand | |
| Vietnam | |
| Rest of Asia-Pacific | |
| Europe | France |
| Germany | |
| Italy | |
| Netherlands | |
| Russia | |
| Spain | |
| Turkey | |
| United Kingdom | |
| Rest of Europe | |
| Middle East | Iran |
| Saudi Arabia | |
| Rest of Middle East | |
| North America | Canada |
| Mexico | |
| United States | |
| Rest of North America | |
| South America | Argentina |
| Brazil | |
| Chile | |
| Rest of South America |
| Sub Additive | Essential Oil | |
| Herbs & Spices | ||
| Other Phytogenics | ||
| Animal | Aquaculture | Fish |
| Shrimp | ||
| Other Aquaculture Species | ||
| Poultry | Broiler | |
| Layer | ||
| Other Poultry Birds | ||
| Ruminants | Beef Cattle | |
| Dairy Cattle | ||
| Other Ruminants | ||
| Swine | ||
| Other Animals | ||
| Geography | Africa | Egypt |
| Kenya | ||
| South Africa | ||
| Rest of Africa | ||
| Asia-Pacific | Australia | |
| China | ||
| India | ||
| Indonesia | ||
| Japan | ||
| Philippines | ||
| South Korea | ||
| Thailand | ||
| Vietnam | ||
| Rest of Asia-Pacific | ||
| Europe | France | |
| Germany | ||
| Italy | ||
| Netherlands | ||
| Russia | ||
| Spain | ||
| Turkey | ||
| United Kingdom | ||
| Rest of Europe | ||
| Middle East | Iran | |
| Saudi Arabia | ||
| Rest of Middle East | ||
| North America | Canada | |
| Mexico | ||
| United States | ||
| Rest of North America | ||
| South America | Argentina | |
| Brazil | ||
| Chile | ||
| Rest of South America | ||


Market Definition
- FUNCTIONS - For the study, feed additives are considered to be commercially manufactured products that are used to enhance characteristics such as weight gain, feed conversion ratio, and feed intake when fed in appropriate proportions.
- RESELLERS - Companies engaged in reselling feed additives without value addition have been excluded from the market scope, to avoid double counting.
- END CONSUMERS - Compound feed manufacturers are considered to be end-consumers in the market studied. The scope excludes farmers buying feed additives to be used directly as supplements or premixes.
- INTERNAL COMPANY CONSUMPTION - Companies engaged in the production of compound feed as well as the manufacturing of feed additives are part of the study. However, while estimating the market sizes, the internal consumption of feed additives by such companies has been excluded.
| Keyword | Definition |
|---|---|
| Feed additives | Feed additives are products used in animal nutrition for purposes of improving the quality of feed and the quality of food from animal origin, or to improve the animals’ performance and health. |
| Probiotics | Probiotics are microorganisms introduced into the body for their beneficial qualities. (It maintains or restores beneficial bacteria to the gut). |
| Antibiotics | Antibiotic is a drug that is specifically used to inhibit the growth of bacteria. |
| Prebiotics | A non-digestible food ingredient that promotes the growth of beneficial microorganisms in the intestines. |
| Antioxidants | Antioxidants are compounds that inhibit oxidation, a chemical reaction that produces free radicals. |
| Phytogenics | Phytogenics are a group of natural and non-antibiotic growth promoters derived from herbs, spices, essential oils, and oleoresins. |
| Vitamins | Vitamins are organic compounds, which are required for normal growth and maintenance of the body. |
| Metabolism | A chemical process that occurs within a living organism in order to maintain life. |
| Amino acids | Amino acids are the building blocks of proteins and play an important role in metabolic pathways. |
| Enzymes | Enzyme is a substance that acts as a catalyst to bring about a specific biochemical reaction. |
| Anti-microbial resistance | The ability of a microorganism to resist the effects of an antimicrobial agent. |
| Anti-microbial | Destroying or inhibiting the growth of microorganisms. |
| Osmotic balance | It is a process of maintaining salt and water balance across membranes within the body's fluids. |
| Bacteriocin | Bacteriocins are the toxins produced by bacteria to inhibit the growth of similar or closely related bacterial strains. |
| Biohydrogenation | It is a process that occurs in the rumen of an animal in which bacteria convert unsaturated fatty acids (USFA) to saturated fatty acids (SFA). |
| Oxidative rancidity | It is a reaction of fatty acids with oxygen, which generally causes unpleasant odors in animals. To prevent these, antioxidants were added. |
| Mycotoxicosis | Any condition or disease caused by fungal toxins, mainly due to contamination of animal feed with mycotoxins. |
| Mycotoxins | Mycotoxins are toxin compounds that are naturally produced by certain types of molds (fungi). |
| Feed Probiotics | Microbial feed supplements positively affect gastrointestinal microbial balance. |
| Probiotic yeast | Feed yeast (single-cell fungi) and other fungi used as probiotics. |
| Feed enzymes | They are used to supplement digestive enzymes in an animal’s stomach to break down food. Enzymes also ensure that meat and egg production is improved. |
| Mycotoxin detoxifiers | They are used to prevent fungal growth and to stop any harmful mold from being absorbed in the gut and blood. |
| Feed antibiotics | They are used both for the prevention and treatment of diseases but also for rapid growth and development. |
| Feed antioxidants | They are used to protect the deterioration of other feed nutrients in the feed such as fats, vitamins, pigments, and flavoring agents, thus providing nutrient security to the animals. |
| Feed phytogenics | Phytogenics are natural substances, added to livestock feed to promote growth, aid in digestion, and act as anti-microbial agents. |
| Feed vitamins | They are used to maintain the normal physiological function and normal growth and development of animals. |
| Feed flavors and sweetners | These flavors and sweeteners help to mask tastes and odors during changes in additives or medications and make them ideal for animal diets undergoing transition. |
| Feed acidifiers | Animal feed acidifiers are organic acids incorporated into the feed for nutritional or preservative purposes. Acidifiers enhance congestion and microbiological balance in the alimentary and digestive tracts of livestock. |
| Feed minerals | Feed minerals play an important role in the regular dietary requirements of animal feed. |
| Feed binders | Feed binders are the binding agents used in the manufacture of safe animal feed products. It enhances the taste of food and prolongs the storage period of the feed. |
| Key Terms | Abbreviation |
| LSDV | Lumpy Skin Disease Virus |
| ASF | African Swine Fever |
| GPA | Growth Promoter Antibiotics |
| NSP | Non-Starch Polysaccharides |
| PUFA | Polyunsaturated Fatty Acid |
| Afs | Aflatoxins |
| AGP | Antibiotic Growth Promoters |
| FAO | The Food And Agriculture Organization of the United Nations |
| USDA | The United States Department of Agriculture |


Research Methodology
Mordor Intelligence follows a four-step methodology in all our reports.
- Step-1: IDENTIFY KEY VARIABLES: In order to build a robust forecasting methodology, the variables and factors identified in Step-1 are tested against available historical market numbers. Through an iterative process, the variables required for market forecast are set and the model is built on the basis of these variables.
- Step-2: Build a Market Model: Market-size estimations for the forecast years are in nominal terms. Inflation is not a part of the pricing, and the average selling price (ASP) is kept constant throughout the forecast period.
- Step-3: Validate and Finalize: In this important step, all market numbers, variables and analyst calls are validated through an extensive network of primary research experts from the market studied. The respondents are selected across levels and functions to generate a holistic picture of the market studied.
- Step-4: Research Outputs: Syndicated Reports, Custom Consulting Assignments, Databases & Subscription Platforms


