Market Overview
| Study Period | 2021 - 2031 |
|---|---|
| Forecast Data Period | 2026 - 2031 |
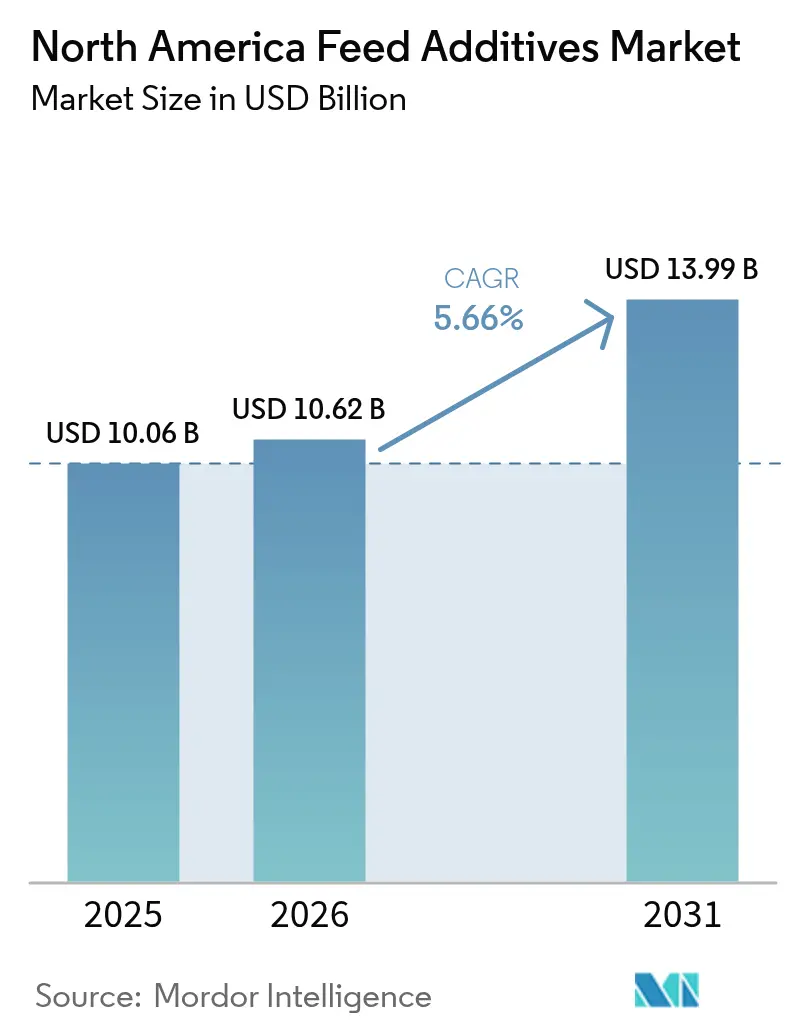
| Base Year Market Size (2025) | USD 10.06 Billion |
| Market Size (2026) | USD 10.62 Billion |
| Market Size (2031) | USD 13.99 Billion |
| Growth Rate (2026 - 2031) | 5.66% CAGR |
| Market Concentration | Medium |
Major Players *Disclaimer: Major Players sorted in no particular order Image © Mordor Intelligence. Reuse requires attribution under CC BY 4.0. | |
North America Feed Additives Market Analysis by Mordor Intelligence
The North America feed additives market size is estimated at USD 10.06 billion in 2025 and projected to reach USD 10.62 billion in 2026 and USD 13.99 billion by 2031, registering a CAGR of 5.66% between 2026 and 2031. Robust demand for precision livestock nutrition, regulatory limits on antibiotic growth promoters, and rising sustainability mandates underpin the steady expansion of the North America feed additives market. The region’s move toward precision nutrition, tightening greenhouse-gas rules, and escalating feed-cost volatility keep additive demand resilient. Amino-acid inclusion remains the primary lever for cutting crude-protein excess, while acidifiers and enzymes gain ground as antibiotic replacements that also deliver compliance benefits. Vertically integrated poultry and swine systems accelerate technology uptake, but dairy herds now pivot faster to monetizable methane credits. Regulatory timelines still shape the launch cadence, forcing suppliers to stagger product rollouts and maintain higher working capital[1]Source: United States Department of Agriculture, “Feed Grains: Yearbook Tables,” USDA.gov.
Key Report Takeaways
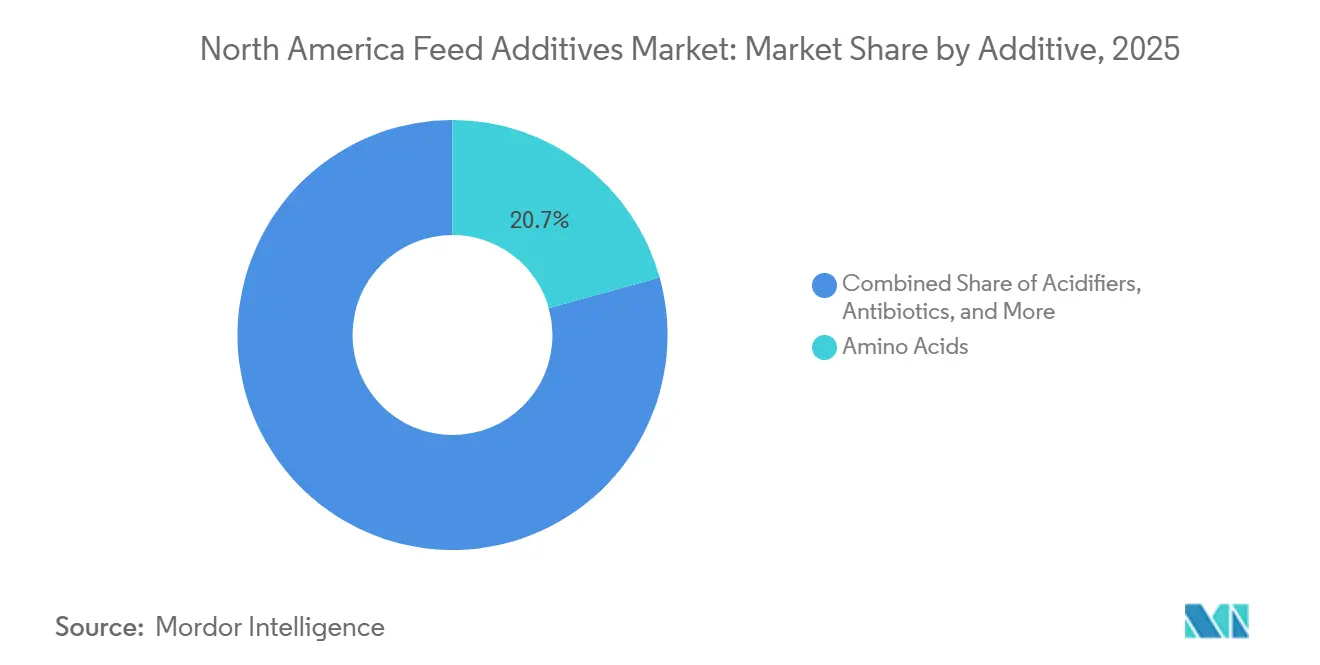
- By additive, amino acids commanded 20.7% of the North America feed additives market share in 2025, whereas acidifiers are forecast to expand at a 6.8% CAGR through 2031.
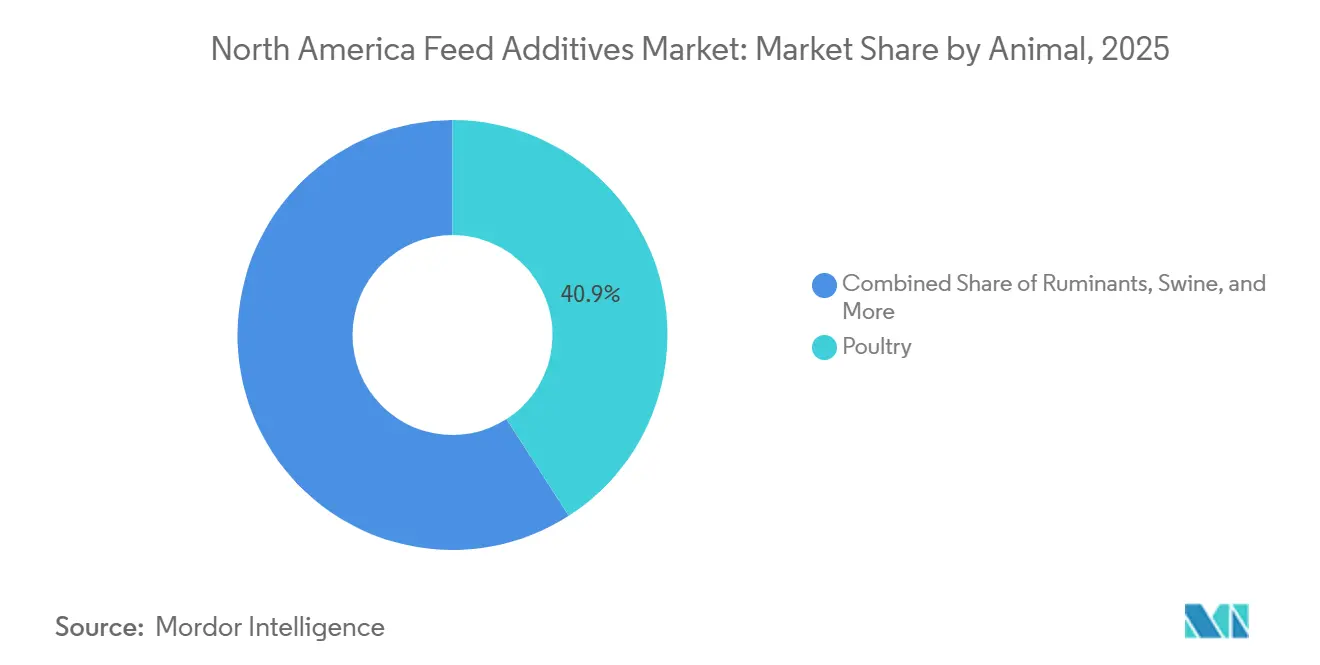
- By animal, poultry accounted for 40.9% of the North America feed additives market size in 2025, and ruminants showed the fastest growth outlook at a 6.1% CAGR to 2031.
- By geography, the United States dominated with a 70.7% market share in 2025, and is forecast to record the highest CAGR at 6.1% through 2031.
- The North America feed additives market exhibits moderate fragmentation, with the top five players Archer Daniels Midland Co., DSM-Firmenich AG, SHV (Nutreco NV), Evonik Industries AG, and Adisseo France S.A.S accounting for a significant share of the market.
Note: Market size and forecast figures in this report are generated using Mordor Intelligence’s proprietary estimation framework, updated with the latest available data and insights as of 2026.
North America Feed Additives Market Trends and Insights
Drivers Impact Analysis*
| Driver | (~) % Impact on CAGR Forecast | Geographic Relevance | Impact Timeline |
|---|---|---|---|
| Precision‑fermentation proteins lowering amino‑acid demand volatility | +1.2% | United States and Canada | Medium term (2–4 years) |
| Biogas‑linked manure credits funding feed‑additive adoption | +0.9% | United States dairy clusters | Short term (≤ 2 years) |
| Methane‑inhibiting feed enzymes gaining Environmental Protection Agency (EPA) fast‑track status | +1.1% | United States and Canada | Medium term (2–4 years) |
| AI‑based micro‑dosing systems reducing inclusion‑rate waste | +0.7% | United States integrators | Long term (≥ 4 years) |
| Surge in insect‑protein plants boosting tailored premix usage | +0.5% | United States and Canada | Long term (≥ 4 years) |
| Phosphate‑recycling regulations accelerating phytase demand | +0.8% | Mexico and United States | Short term (≤ 2 years) |
| Source: Mordor Intelligence | |||


Precision‑fermentation Proteins Lowering Amino‑acid Demand Volatility
Precision‑fermentation technologies are decoupling lysine and methionine supply from crop yields and geopolitics, allowing nutritionists to secure long‑term contracts at stable prices. Dozens of fermentation‑derived feed ingredients are under development in North America, with pilot plants already producing in Ontario and Iowa. New microbial strains convert industrial waste streams into amino acids at higher yields than conventional methods, pushing production costs down and narrowing the gap with soybean meal on a digestible‑lysine basis. By insulating integrators from raw‑material price shocks, precision fermentation supports long‑range ration planning and reduces the need for crude‑protein “insurance” that drives nitrogen excretion. The technology also aligns with corporate emissions goals by reducing land and water footprints compared with crop‑based amino acids. Regulatory clearance is progressing smoothly under the Food and Drug Administration (FDA)’s Generally Recognized as Safe framework, with most pilot lines already meeting purity thresholds[2]Source: U.S. Food and Drug Administration, “Judicious Use of Medically Important Antimicrobials in Food-Producing Animals,” fda.gov.
Biogas‑linked Manure Credits Funding Feed‑additive Adoption
Manure credits created under the United States Renewable Fuel Standard are providing new revenue streams that dairies and hog farms reinvest in feed enzymes. Operations that capture methane from anaerobic digesters earn renewable identification numbers that translate into significant cash flow[3]Source: United States Environmental Protection Agency, “Renewable Fuel Standard Program,” EPA.gov. Large dairies can recover digester investments within a few years, then redirect annual methane credits into additives such as 3‑nitrooxypropanol that further cut enteric emissions. These purchases generate additional carbon credits under California’s Low Carbon Fuel Standard, multiplying financial upside. Because credits arrive as cash, they offset the incremental cost of enzymes, accelerating adoption beyond what feed‑cost savings alone would justify. This feedback loop is strongest in dairy clusters across Wisconsin, California, and North Carolina, where digester density and credit liquidity are high.
Methane‑inhibiting Feed Enzymes Gaining Environmental Protection Agency (EPA) Fast‑track Status
Methane‑inhibiting feed enzymes gained regulatory momentum when the Food and Drug Administration (FDA) granted approval to 3‑nitrooxypropanol, opening commercial sales that reduce enteric emissions in lactating cows. The EPA fast‑tracked review after identifying livestock methane as a major contributor to agricultural greenhouse gases, positioning feed additives as a primary mitigation lever. Early adopters report energy savings that translate into more milk per cow per day, improving revenue while advancing sustainability metrics. Carbon‑credit eligibility under state programs further raises returns, making payback periods short for high‑producing herds. Canada is conducting parallel trials on Holstein genetics, signaling regional expansion once efficacy data are validated. Policy support and measurable on‑farm gains position methane‑cutting enzymes as a core growth driver through the next decade.
AI-based Micro‑dosing Systems Reducing Inclusion‑rate Waste
AI‑based micro‑dosing systems are reducing amino‑acid over‑formulation by adjusting inclusion rates in real time with machine‑learning models that integrate ingredient prices, growth curves, and environmental data. Platforms like Cargill’s Galleon analyze microbiome samples from bird cohorts and trim lysine use without compromising weight gain, saving substantial costs at scale. Computer‑vision tools such as Birdoo track individual broiler growth and flag birds deviating from projected patterns, enabling tailored rations rather than over‑feeding entire flocks. Trials show that microbiome‑informed dosing improves feed‑conversion ratios compared to static formulations, resulting in less feed per unit of live weight. Hardware and data‑infrastructure costs currently favor vertically integrated operations, but as accuracy improves, suppliers bundle dosing algorithms with additive contracts, locking in market share and reinforcing the value proposition.
Restraints Impact Analysis*
| Restraint | (~) % Impact on CAGR Forecast | Geographic Relevance | Impact Timeline |
|---|---|---|---|
| Lysine price shock from Chinese plant outages | -0.90% | North America, with global supply-chain dependencies | Short term (≤ 2 years) |
| Lengthy FDA (Food and Drug Administration) and CFIA (Canadian Food Inspection Agency) approval timelines for new additives | -0.60% | North America regulatory jurisdictions | Long term (≥ 4 years) |
| Consumer skepticism toward synthetic additives | -0.40% | North America consumer markets, premium segments | Medium term (2-4 years) |
| Supply-chain risk from geographic concentration of amino-acid production | -0.70% | Global, with North America import dependencies | Medium term (2-4 years) |
| Source: Mordor Intelligence | |||
Lysine Price Shock From Chinese Plant Outages
Flooding in China that shut several lysine plants removed a significant portion of global capacity, pushing spot prices sharply higher and costing North American poultry integrators millions in unhedged expenses. Domestic output covers less than half of the United States, leaving buyers exposed despite local fermentation capacity. To cap volatility, major integrators locked in long‑term lysine contracts at fixed prices, sacrificing potential upside if markets soften. High prices force nutritionists to trim inclusion rates, sacrificing feed conversion efficiency and increasing nitrogen excretion. The episode underscores systemic risk from geographic concentration, as a handful of Chinese provinces still account for most global lysine production. Until regional plants in North America come online, supply‑security fears will temper overall market growth.
Lengthy FDA (Food and Drug Administration) and CFIA (Canadian Food Inspection Agency) Approval Timelines for New Additives
Lengthy approval timelines at the FDA (Food and Drug Administration) and CFIA (Canadian Food Inspection Agency) delay the launch of novel enzymes, probiotics, and rumen‑protected nutrients, significantly inflating development costs. The United States' new animal drug pathway requires extended safety and efficacy data, while Canada requires additional trials using local genetics, further delaying approvals. Suppliers often postpone launches, losing revenue opportunities and raising working‑capital needs due to staggered regional rollouts. Smaller innovators without deep regulatory teams struggle to navigate these hurdles, limiting competitive diversity. Although Mexico offers a fast‑track for additives already cleared in the United States, the rule excludes ingredients with no prior precedent, keeping the bottleneck intact.
*Our forecasts treat driver/restraint impacts as directional, not additive. The impact forecasts reflect baseline growth, mix effects, and variable interactions.
Segment Analysis
By Additive: Amino Acids Dominance Meets Acidifier Innovation
Amino acids accounted for the largest portion of the North America feed additives market share by additive, representing 20.7% in 2025, sustained by relentless methionine and lysine demand from high-density poultry and swine units. Elevated lysine and methionine use keep crude protein levels in check and reduce nitrogen excretion, while the adoption of threonine and tryptophan advances ideal‑protein models. Enzymes, particularly thermostable phytase, continue to gain share under stricter phosphorus rules across multiple regions. Vitamins and minerals stay foundational, but encapsulated formats now dominate because they survive pelleting heat and preserve bioactivity. This shift reflects the industry’s push toward efficiency, sustainability, and compliance with evolving environmental regulations.
Acidifiers are forecast to log a 6.8% CAGR through 2031, the fastest among additives, as regulators curtail zinc oxide, and consumers push for antibiotic-free labels. Propionic and fumaric blends that stabilize gastric pH deter pathogens such as Salmonella and Clostridium, reducing post‑weaning losses. Thermostable variants that endure pelleting in high‑throughput mills are widening demand further. Rising insect‑protein inclusion also drives bespoke premixes that rebalance sulfur amino acids, lifting encapsulated methionine sales. Acidifiers thus represent the fastest‑growing additive category, combining regulatory momentum with consumer preference shifts. Their role in health management and compliance positions them as a critical lever for producers navigating both biological and market pressures.


By Animal: Poultry Leadership Challenged by Ruminant Growth
Poultry held 40.9% of the North America feed additives market size in 2025, an outgrowth of its vertically integrated model that reformulates rations weekly to chase feed-conversion gains. Broiler complexes now deploy microbiome analytics to trim lysine usage without harming growth, saving costs while reducing waste. Layers emphasize calcium, phosphorus, and vitamin D to sustain shell integrity, while omega‑3 enrichments command shelf premiums. The poultry sector’s agility in adopting new technologies ensures it remains the largest and most dynamic segment, with integrators leveraging data‑driven nutrition to maintain competitiveness.
Ruminants will pace expansion at a 6.1% CAGR through 2031, as dairies embrace methane‑cutting additives such as 3‑nitrooxypropanol, which reduce emissions while recycling saved energy into higher milk output. Rumen‑protected amino acids and choline safeguard liver health during peak lactation, supporting productivity under quota frameworks and carbon‑credit regimes. Beef feedlots increase ionophore and enzyme use to offset high‑grain diets and volatile corn pricing. Together, these innovations position ruminants as the fastest‑expanding segment, driven by sustainability incentives and measurable productivity gains.
Geography Analysis
The United States dominated with a 70.7% share of the North America feed additives market size in 2025, and is forecast to record the highest CAGR of 6.1% through 2031, propelled by fast regulatory approvals, methane‑credit monetization, and highly integrated poultry and swine supply chains. California’s Low Carbon Fuel Standard credits allow dairies to fund enzyme inclusion beyond feed‑cost savings. State phosphorus caps spur phytase uptake, while federal clearance for methane‑inhibiting additives provides first‑mover advantage. The United States market benefits from scale, integration, and policy support, ensuring rapid diffusion of new technologies.
Canada holds a significant share but faces slower growth due to CFIA protocols requiring trials on local genetics, which extend approval timelines. Ontario and Quebec lead the adoption of encapsulated vitamins and rumen‑protected fats, reflecting their dominance in broiler and dairy output. Western feedlots increase ionophore use to improve feed efficiency but face labor shortages that temper overall expansion. Investments in encapsulation plants anchor export ambitions in the Midwest, reinforcing Canada’s role as a specialized supplier.
Mexico is expanding steadily as the poultry and swine sectors scale. Regulatory decrees mandating phosphate recycling fuel phytase demand, while integrated complexes mirror the United States additive protocols, achieving superior feed‑conversion ratios compared to smaller domestic mills. Fragmented milling capacity still curbs enzyme and probiotic penetration, but rising export opportunities into Central America encourage modernization. Mexico’s trajectory reflects regulatory pressure combined with regional integration, positioning it as a growth market with increasing sophistication.
Competitive Landscape
The North America feed additives market exhibits moderate fragmentation, with the top five players accounting for a significant combined share. Global majors such as Archer Daniels Midland Co., DSM-Firmenich AG, and Evonik Industries AG leverage adjacency to crush plants, encapsulation expertise, and amino‑acid balancing software to secure competitive positions. Technology platforms now serve as differentiators, blending microbiome scans and machine learning to optimize inclusion rates, cut waste, and reduce emissions.
Emerging technologies such as seaweed‑based methane inhibitors and thermostable enzymes highlight the innovation race. Regulatory compliance costs remain high, reinforcing barriers that favor capital‑rich incumbents. Patent filings show momentum toward lignocellulosic fermentation strains and advanced encapsulation methods. Compliance burdens, however, limit smaller entrants, keeping competition tilted toward established players.
Consolidation remains muted as antitrust watchdogs block large tie‑ups, steering majors toward vertical integration. Companies like Land O’Lakes produce enzymes and vitamins internally to secure supply and lock in margins. Direct sales to integrators are rising, reflecting buyers’ preference for bundled technical support and near‑real‑time reformulation assistance. Distributor roles shrink as nutritionists demand closer collaboration with suppliers, reshaping the competitive landscape toward integrated service models.
North America Feed Additives Industry Leaders
Evonik Industries AG
SHV (Nutreco NV)
Archer Daniels Midland Co.
DSM-Firmenich AG
Adisseo France S.A.S.
- *Disclaimer: Major Players sorted in no particular order

Recent Industry Developments
- February 2025: DSM-Firmenich completed the sale of its stake in the Feed Enzymes Alliance to partner Novonesis for EUR 1.5 billion (USD 1.61 billion), with the disposed feed-enzyme activities generating approximately EUR 300 million (USD 321 million) net revenue in 2024, as part of the company's broader strategy to divest its Animal Nutrition and Health unit during 2025.
- November 2024: Phibro Animal Health Corporation completed its USD 350 million acquisition of Zoetis' medicated feed additive product portfolio and certain water-soluble products, adding over 37 product lines sold in approximately 80 countries and six manufacturing sites located in the United States, Italy, and China, along with more than 300 employees supporting manufacturing and distribution operations.
- September 2024: Anpario plc completed the acquisition of Bio-Vet Inc., a Wisconsin-based direct-fed microbials specialist, for USD 7.3 million, gaining access to the US dairy market and proprietary Capsule-In-A-Capsule delivery technology, with Bio-Vet generating USD 8.2 million revenue in 2023 and direct-fed microbials accounting for approximately 50% of sales.


North America Feed Additives Market Report Scope
Feed additives are specialized nutritional or functional compounds added to animal feed to enhance growth, health, and efficiency, while reducing waste and meeting regulatory or consumer requirements.
The North America feed additives market report is segmented by additive (acidifiers, amino acids, antibiotics, binders, enzymes, and others), by animal (aquaculture, poultry, ruminants, and others), and by geography (Canada, Mexico, the United States, and others). The market forecasts are provided in terms of value (USD) and volume (metric tons).
Additive
| Acidifiers | By Sub Additive | Fumaric Acid |
| Lactic Acid | ||
| Propionic Acid | ||
| Other Acidifiers | ||
| Amino Acids | By Sub Additive | Lysine |
| Methionine | ||
| Threonine | ||
| Tryptophan | ||
| Other Amino Acids | ||
| Antibiotics | By Sub Additive | Bacitracin |
| Penicillins | ||
| Tetracyclines | ||
| Tylosin | ||
| Other Antibiotics | ||
| Antioxidants | By Sub Additive | Butylated Hydroxyanisole (BHA) |
| Butylated Hydroxytoluene (BHT) | ||
| Citric Acid | ||
| Ethoxyquin | ||
| Propyl Gallate | ||
| Tocopherols | ||
| Other Antioxidants | ||
| Binders | By Sub Additive | Natural Binders |
| Synthetic Binders | ||
| Enzymes | By Sub Additive | Carbohydrases |
| Phytases | ||
| Other Enzymes | ||
| Flavors and Sweeteners | By Sub Additive | Flavors |
| Sweeteners | ||
| Minerals | By Sub Additive | Macrominerals |
| Microminerals | ||
| Mycotoxin Detoxifiers | By Sub Additive | Binders |
| Biotransformers | ||
| Phytogenics | By Sub Additive | Essential Oil |
| Herbs and Spices | ||
| Other Phytogenics | ||
| Pigments | By Sub Additive | Carotenoids |
| Curcumin and Spirulina | ||
| Prebiotics | By Sub Additive | Fructo Oligosaccharides |
| Galacto Oligosaccharides | ||
| Inulin | ||
| Lactulose | ||
| Mannan Oligosaccharides | ||
| Xylo Oligosaccharides | ||
| Other Prebiotics | ||
| Probiotics | By Sub Additive | Bifidobacteria |
| Enterococcus | ||
| Lactobacilli | ||
| Pediococcus | ||
| Streptococcus | ||
| Other Probiotics | ||
| Vitamins | By Sub Additive | Vitamin A |
| Vitamin B | ||
| Vitamin C | ||
| Vitamin E | ||
| Other Vitamins | ||
| Yeast | By Sub Additive | Live Yeast |
| Selenium Yeast | ||
| Spent Yeast | ||
| Torula Dried Yeast | ||
| Whey Yeast | ||
| Yeast Derivatives |
Animal
| Aquaculture | By Sub Animal | Fish |
| Shrimp | ||
| Other Aquaculture Species | ||
| Poultry | By Sub Animal | Broiler |
| Layer | ||
| Other Poultry Birds | ||
| Ruminants | By Sub Animal | Beef Cattle |
| Dairy Cattle | ||
| Other Ruminants | ||
| Swine | ||
| Other Animals |
Geography
| Canada |
| Mexico |
| United States |
| Rest of North America |
| Additive | Acidifiers | By Sub Additive | Fumaric Acid |
| Lactic Acid | |||
| Propionic Acid | |||
| Other Acidifiers | |||
| Amino Acids | By Sub Additive | Lysine | |
| Methionine | |||
| Threonine | |||
| Tryptophan | |||
| Other Amino Acids | |||
| Antibiotics | By Sub Additive | Bacitracin | |
| Penicillins | |||
| Tetracyclines | |||
| Tylosin | |||
| Other Antibiotics | |||
| Antioxidants | By Sub Additive | Butylated Hydroxyanisole (BHA) | |
| Butylated Hydroxytoluene (BHT) | |||
| Citric Acid | |||
| Ethoxyquin | |||
| Propyl Gallate | |||
| Tocopherols | |||
| Other Antioxidants | |||
| Binders | By Sub Additive | Natural Binders | |
| Synthetic Binders | |||
| Enzymes | By Sub Additive | Carbohydrases | |
| Phytases | |||
| Other Enzymes | |||
| Flavors and Sweeteners | By Sub Additive | Flavors | |
| Sweeteners | |||
| Minerals | By Sub Additive | Macrominerals | |
| Microminerals | |||
| Mycotoxin Detoxifiers | By Sub Additive | Binders | |
| Biotransformers | |||
| Phytogenics | By Sub Additive | Essential Oil | |
| Herbs and Spices | |||
| Other Phytogenics | |||
| Pigments | By Sub Additive | Carotenoids | |
| Curcumin and Spirulina | |||
| Prebiotics | By Sub Additive | Fructo Oligosaccharides | |
| Galacto Oligosaccharides | |||
| Inulin | |||
| Lactulose | |||
| Mannan Oligosaccharides | |||
| Xylo Oligosaccharides | |||
| Other Prebiotics | |||
| Probiotics | By Sub Additive | Bifidobacteria | |
| Enterococcus | |||
| Lactobacilli | |||
| Pediococcus | |||
| Streptococcus | |||
| Other Probiotics | |||
| Vitamins | By Sub Additive | Vitamin A | |
| Vitamin B | |||
| Vitamin C | |||
| Vitamin E | |||
| Other Vitamins | |||
| Yeast | By Sub Additive | Live Yeast | |
| Selenium Yeast | |||
| Spent Yeast | |||
| Torula Dried Yeast | |||
| Whey Yeast | |||
| Yeast Derivatives | |||
| Animal | Aquaculture | By Sub Animal | Fish |
| Shrimp | |||
| Other Aquaculture Species | |||
| Poultry | By Sub Animal | Broiler | |
| Layer | |||
| Other Poultry Birds | |||
| Ruminants | By Sub Animal | Beef Cattle | |
| Dairy Cattle | |||
| Other Ruminants | |||
| Swine | |||
| Other Animals | |||
| Geography | Canada | ||
| Mexico | |||
| United States | |||
| Rest of North America | |||


Market Definition
- FUNCTIONS - For the study, feed additives are considered to be commercially manufactured products that are used to enhance characteristics such as weight gain, feed conversion ratio, and feed intake when fed in appropriate proportions.
- RESELLERS - Companies engaged in reselling feed additives without value addition have been excluded from the market scope, to avoid double counting.
- END CONSUMERS - Compound feed manufacturers are considered to be end-consumers in the market studied. The scope excludes farmers buying feed additives to be used directly as supplements or premixes.
- INTERNAL COMPANY CONSUMPTION - Companies engaged in the production of compound feed as well as the manufacturing of feed additives are part of the study. However, while estimating the market sizes, the internal consumption of feed additives by such companies has been excluded.
| Keyword | Definition |
|---|---|
| Feed additives | Feed additives are products used in animal nutrition for purposes of improving the quality of feed and the quality of food from animal origin, or to improve the animals’ performance and health. |
| Probiotics | Probiotics are microorganisms introduced into the body for their beneficial qualities. (It maintains or restores beneficial bacteria to the gut). |
| Antibiotics | Antibiotic is a drug that is specifically used to inhibit the growth of bacteria. |
| Prebiotics | A non-digestible food ingredient that promotes the growth of beneficial microorganisms in the intestines. |
| Antioxidants | Antioxidants are compounds that inhibit oxidation, a chemical reaction that produces free radicals. |
| Phytogenics | Phytogenics are a group of natural and non-antibiotic growth promoters derived from herbs, spices, essential oils, and oleoresins. |
| Vitamins | Vitamins are organic compounds, which are required for normal growth and maintenance of the body. |
| Metabolism | A chemical process that occurs within a living organism in order to maintain life. |
| Amino acids | Amino acids are the building blocks of proteins and play an important role in metabolic pathways. |
| Enzymes | Enzyme is a substance that acts as a catalyst to bring about a specific biochemical reaction. |
| Anti-microbial resistance | The ability of a microorganism to resist the effects of an antimicrobial agent. |
| Anti-microbial | Destroying or inhibiting the growth of microorganisms. |
| Osmotic balance | It is a process of maintaining salt and water balance across membranes within the body's fluids. |
| Bacteriocin | Bacteriocins are the toxins produced by bacteria to inhibit the growth of similar or closely related bacterial strains. |
| Biohydrogenation | It is a process that occurs in the rumen of an animal in which bacteria convert unsaturated fatty acids (USFA) to saturated fatty acids (SFA). |
| Oxidative rancidity | It is a reaction of fatty acids with oxygen, which generally causes unpleasant odors in animals. To prevent these, antioxidants were added. |
| Mycotoxicosis | Any condition or disease caused by fungal toxins, mainly due to contamination of animal feed with mycotoxins. |
| Mycotoxins | Mycotoxins are toxin compounds that are naturally produced by certain types of molds (fungi). |
| Feed Probiotics | Microbial feed supplements positively affect gastrointestinal microbial balance. |
| Probiotic yeast | Feed yeast (single-cell fungi) and other fungi used as probiotics. |
| Feed enzymes | They are used to supplement digestive enzymes in an animal’s stomach to break down food. Enzymes also ensure that meat and egg production is improved. |
| Mycotoxin detoxifiers | They are used to prevent fungal growth and to stop any harmful mold from being absorbed in the gut and blood. |
| Feed antibiotics | They are used both for the prevention and treatment of diseases but also for rapid growth and development. |
| Feed antioxidants | They are used to protect the deterioration of other feed nutrients in the feed such as fats, vitamins, pigments, and flavoring agents, thus providing nutrient security to the animals. |
| Feed phytogenics | Phytogenics are natural substances, added to livestock feed to promote growth, aid in digestion, and act as anti-microbial agents. |
| Feed vitamins | They are used to maintain the normal physiological function and normal growth and development of animals. |
| Feed flavors and sweetners | These flavors and sweeteners help to mask tastes and odors during changes in additives or medications and make them ideal for animal diets undergoing transition. |
| Feed acidifiers | Animal feed acidifiers are organic acids incorporated into the feed for nutritional or preservative purposes. Acidifiers enhance congestion and microbiological balance in the alimentary and digestive tracts of livestock. |
| Feed minerals | Feed minerals play an important role in the regular dietary requirements of animal feed. |
| Feed binders | Feed binders are the binding agents used in the manufacture of safe animal feed products. It enhances the taste of food and prolongs the storage period of the feed. |
| Key Terms | Abbreviation |
| LSDV | Lumpy Skin Disease Virus |
| ASF | African Swine Fever |
| GPA | Growth Promoter Antibiotics |
| NSP | Non-Starch Polysaccharides |
| PUFA | Polyunsaturated Fatty Acid |
| Afs | Aflatoxins |
| AGP | Antibiotic Growth Promoters |
| FAO | The Food And Agriculture Organization of the United Nations |
| USDA | The United States Department of Agriculture |


Research Methodology
Mordor Intelligence follows a four-step methodology in all our reports.
- Step-1: IDENTIFY KEY VARIABLES: In order to build a robust forecasting methodology, the variables and factors identified in Step-1 are tested against available historical market numbers. Through an iterative process, the variables required for market forecast are set and the model is built on the basis of these variables.
- Step-2: Build a Market Model: Market-size estimations for the forecast years are in nominal terms. Inflation is not a part of the pricing, and the average selling price (ASP) is kept constant throughout the forecast period.
- Step-3: Validate and Finalize: In this important step, all market numbers, variables and analyst calls are validated through an extensive network of primary research experts from the market studied. The respondents are selected across levels and functions to generate a holistic picture of the market studied.
- Step-4: Research Outputs: Syndicated Reports, Custom Consulting Assignments, Databases & Subscription Platforms


