Market Overview
| Study Period | 2017 - 2030 |
|---|---|
| Forecast Data Period | 2025 - 2030 |
| Historical Data Period | 2017 - 2023 |
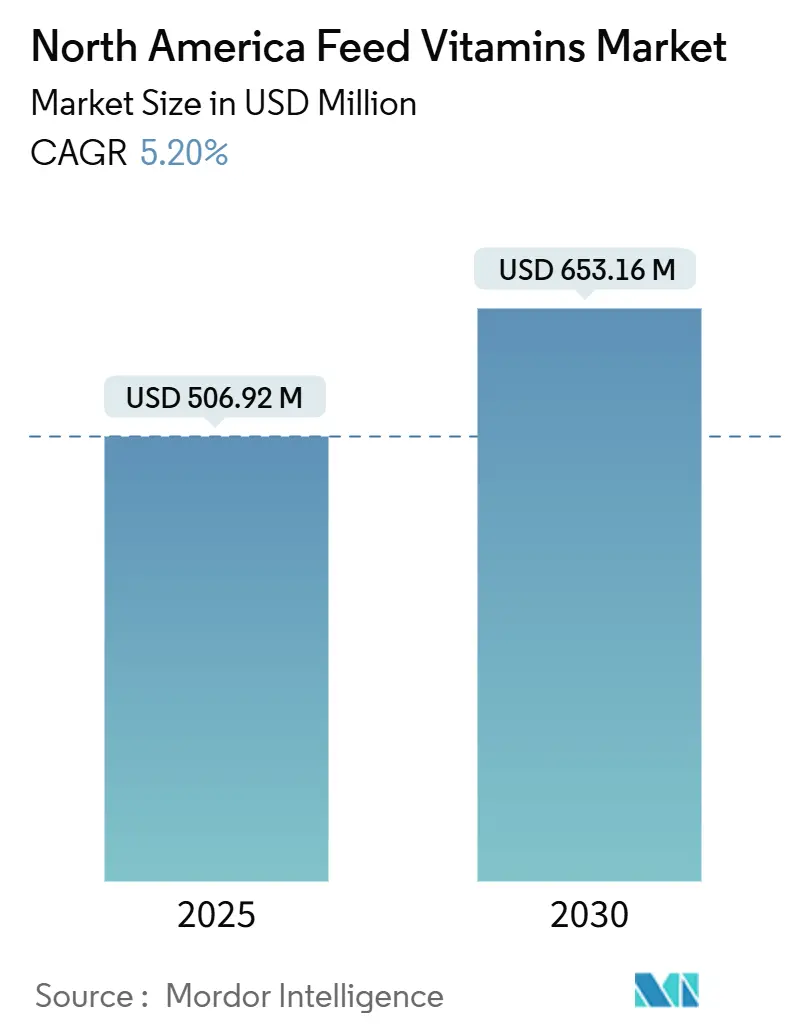
| Market Size (2025) | USD 506.92 Million |
| Market Size (2030) | USD 653.16 Million |
| Growth Rate (2025 - 2030) | 5.20% CAGR |
| Market Concentration | Medium |
Major Players
*Disclaimer: Major Players sorted in no particular order Image © Mordor Intelligence. Reuse requires attribution under CC BY 4.0. |
|
North America Feed Vitamins Market Analysis by Mordor Intelligence
The North America feed vitamins market size stood at USD 506.92 million in 2025 and is forecast to advance at a 5.2% CAGR to reach USD 653.16 million by 2030. The growth outlook reflects the transition from post-pandemic recovery to strategic expansion, led by integrated poultry mega-farms that raise vitamin inclusion rates, and by post-African Swine Fever swine herd rebuilding across the United States and Mexico. Price volatility stemming from the July 2024 shutdown of a large German facility created temporary profit gains of EUR 80 million (USD 86 million) for leading suppliers in late 2024, underscoring the sensitivity of the North America feed vitamins market to capacity disruptions. Carbon-credit monetization for vitamin-driven methane reduction now adds an economic layer to ruminant demand, while FDA GRAS status for algae-based concentrates diversifies sourcing and supports premium positioning. Regulatory incentives, such as the Inflation Reduction Act tax credits for “low-methane” feed, further stimulate segment innovation in the North America feed vitamins market [1]Source: United States Department of Agriculture, “Poultry Production and Value,” usda.gov.
Key Report Takeaways
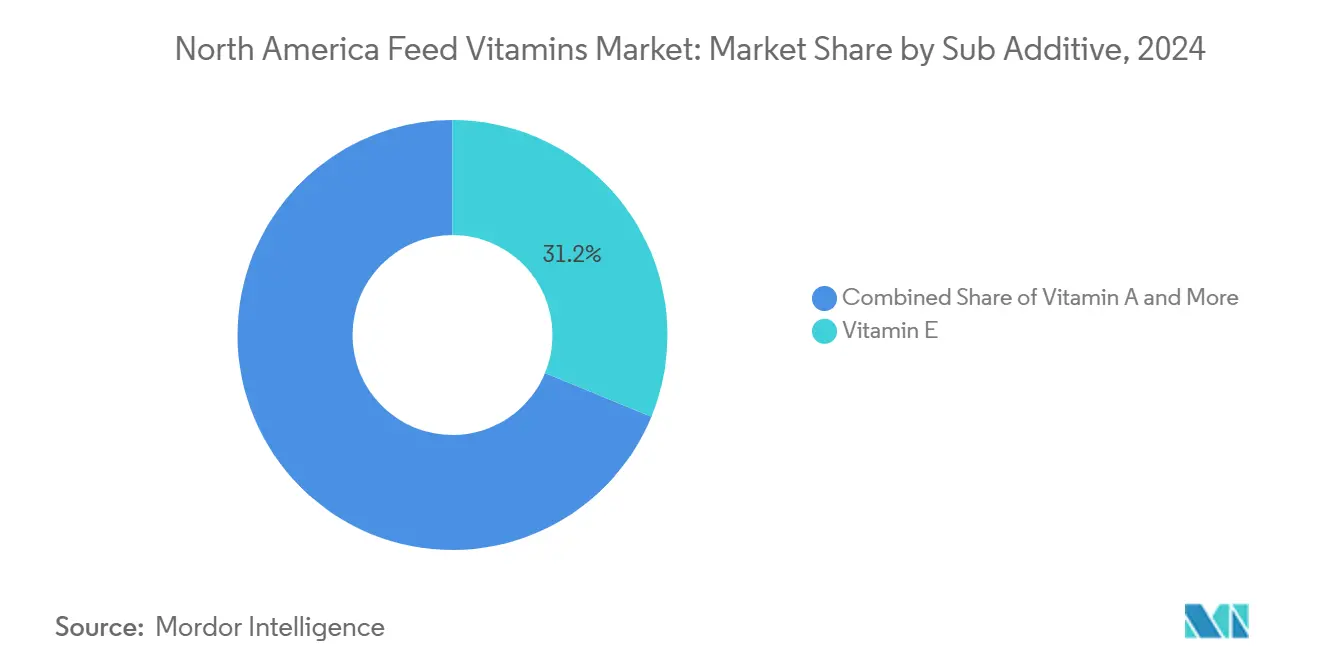
- By sub additive, Vitamin E led with 31.2% revenue share of the North America feed vitamins market in 2024, while Vitamin A is the fastest growing sub additive, projected to expand at a 5.5% CAGR through 2030.
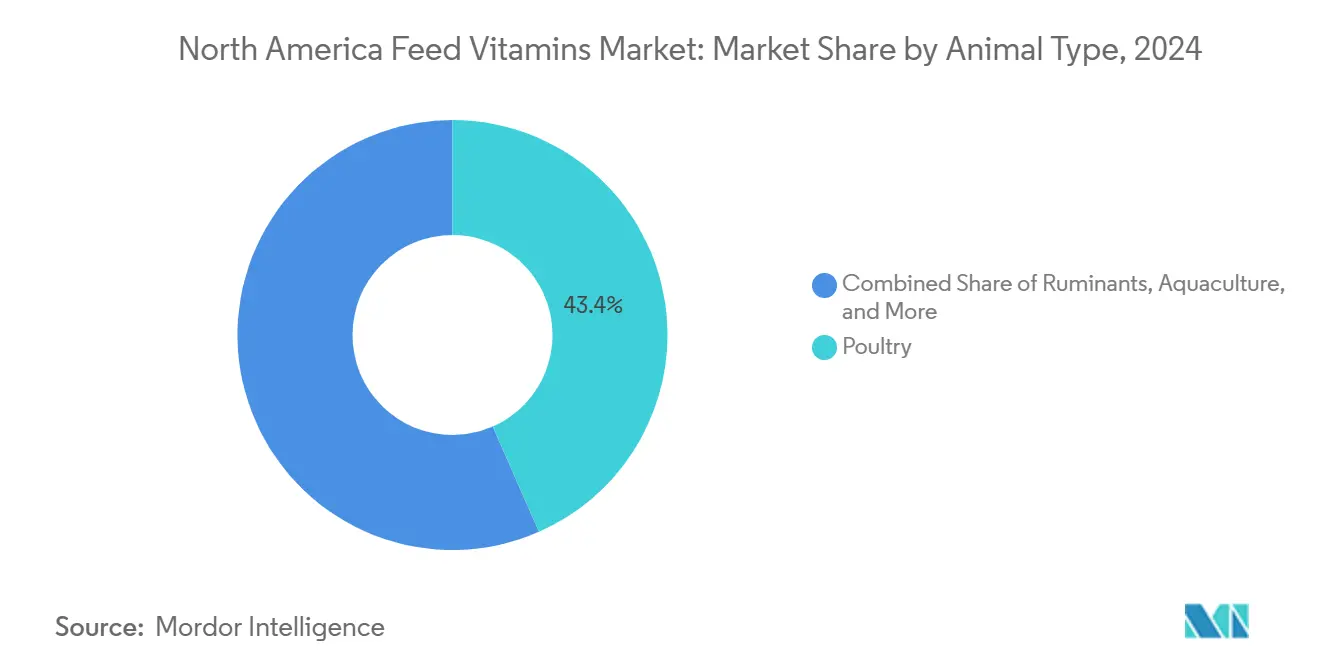
- By animal type, poultry accounted for 43.4% of the North America feed vitamins market share in 2024, whereas ruminants posted the fastest growth at a 5.9% CAGR to 2030.
- By geography, the United States dominated with a 70.6% share of the North America feed vitamins market size in 2024; Mexico is forecast to record the highest CAGR at 5.8% through 2030.
North America Feed Vitamins Market Trends and Insights
Drivers Impact Analysis*
| Driver | (~) % Impact on CAGR Forecast | Geographic Relevance | Impact Timeline |
|---|---|---|---|
| Rapid expansion of integrated poultry mega-farms | +1.20% | United States and Canada with spillover to Mexico | Medium term (2-4 years) |
| Post-ASF swine herd rebuilding in the United States and Mexico | +0.90% | United States and Mexico dominant | Short term (≤ 2 years) |
| DSM-5 enforced fortification guidelines for humane husbandry | +0.70% | Region-wide, strongest in Canada | Long term (≥ 4 years) |
| U.S. Inflation Reduction Act tax credits for vitamin-rich low-methane feed | +0.60% | United States core, Mexico emerging | Medium term (2-4 years) |
| Algae-based vitamin concentrates gaining GRAS status | +0.50% | Early adoption in North America | Long term (≥ 4 years) |
| Carbon-credit monetization for vitamin-driven enteric Methane reduction | +0.40% | United States and Mexico focus | Medium term (2-4 years) |
| Source: Mordor Intelligence | |||


Rapid Expansion of Integrated Poultry Mega-Farms
Vertically integrated operations now specify vitamin premixes that cost 15-20% more each year because fortified profiles have risen 25-30% to sustain bird welfare in dense houses. Contracts covering flocks of 50,000 or more standardize demand, giving large suppliers leverage in the North America feed vitamins market. Updated welfare rules also extend vitamin D3 and E requirements, promoting consistent adoption across major poultry belts.
Post-ASF Swine Herd Rebuilding in the United States and Mexico
Restocking herds in the United States and Mexico adopt nursery rations with B-complex concentrations 40-60% above pre-2024 levels. Vitamin A inclusion rates in starter feeds have increased 35% since 2024, as producers prioritize immune system development in replacement stock. The economic imperative to compress growing periods from 24 to 20 weeks drives vitamin E supplementation rates 25% above historical norms, with Mexican operations leading adoption due to government-supported restocking incentives.
Algae-based Vitamin Concentrates Gaining GRAS Status
Schizochytrium-derived vitamin E shows 95% bioequivalence to synthetic grades and secures 15-20% price premiums in organic feed channels[2]Source: U.S. Food and Drug Administration, “GRAS Notices for Algae-Derived Ingredients,” fda.gov. Chlorella-based B-complex powders reduce premix complexity and improve pelleting stability, though regional output of 2,500 tons covers only a fraction of the 45,000-ton vitamin requirement. Planned capacity additions through 2026 could lift the share to 15% of the North America feed vitamins market.
Carbon-Credit Monetization for Vitamin-Driven Enteric Methane Reduction
The Gold Standard's 2024 methodology for quantifying methane reductions from feed supplements establishes a direct economic link between vitamin supplementation and carbon credit generation. Ruminant operations utilizing vitamin-enriched feed formulations that reduce enteric methane by 15-30% can now monetize these reductions through verified carbon offset markets. Early adopters report carbon credit revenues of USD 8-12 per head annually, with vitamin costs representing only USD 3-5 of this value creation. The U.S. Inflation Reduction Act's tax credit provisions further enhance economics, providing 30% cost offsets for qualifying "low-methane" feed formulations that incorporate specific vitamin profiles designed to optimize rumen fermentation patterns.
Restraints Impact Analysis*
| Restraint | (~) % Impact on CAGR Forecast | Geographic Relevance | Impact Timeline |
|---|---|---|---|
| Volatility in petro-derived raw materials (acetone, phenol) | -0.80% | Region-wide, highest in United States | Short term (≤ 2 years) |
| Tightening maximum inclusion limits for vitamin A in Canadian feed code | -0.60% | Canada only | Medium term (2-4 years) |
| Supply bottlenecks for citral: key precursor for vitamin E | -0.50% | Global constraint felt regionally | Short term (≤ 2 years) |
| Price under-cutting by Chinese contract manufacturers | -0.70% | Mexico most exposed | Long term (≥ 4 years) |
| Source: Mordor Intelligence | |||
Tightening Maximum Inclusion Limits for Vitamin A in Canadian Feed Code
Health Canada's Canadian Food Inspection Agency (CFIA) implemented revised maximum inclusion limits for vitamin A in feed formulations effective January 2025, reducing allowable concentrations by 20% across poultry and swine categories[3]Source: Health Canada. "Canadian Food Inspection Agency: Feed Regulations." https://www.canada.ca. The regulatory change, driven by bioaccumulation concerns in meat products, forces Canadian feed mills to reformulate existing premix specifications and source lower-potency vitamin A concentrates. Cross-border trade implications emerge as U.S.-manufactured feeds exceeding Canadian limits face import restrictions, creating market segmentation that benefits domestic Canadian vitamin suppliers.
Supply Bottlenecks for Citral: Key Precursor for Vitamin E
The explosion at a major German vitamin production facility in July 2024 eliminated 40% of global vitamin E capacity and 25% of vitamin A capacity through mid-2025, creating unprecedented supply tightness. North American feed mills report 8-12 week lead times for vitamin E compared to historical 2-4 week delivery schedules. Citral supply bottlenecks, affecting vitamin E precursor availability, have pushed contract prices 35% higher year-over-year, with some suppliers implementing allocation protocols for existing customers. Chinese environmental regulations in Zhejiang province further constrain global supply, as three major vitamin production facilities operate under reduced schedules, affecting B-complex vitamin availability and forcing North American buyers toward higher-cost European alternatives.
*Our forecasts treat driver/restraint impacts as directional, not additive. The impact forecasts reflect baseline growth, mix effects, and variable interactions.
Segment Analysis
By Sub Additive: Vitamin E Dominance Faces Supply Constraints
Vitamin E retained 31.2% revenue share of the North America feed vitamins market in 2024, yet a temporary loss of German capacity pushed regional prices 35% higher as lead times stretched to three months. The ongoing shortage forces feed mills to secure allocations well in advance, allowing diversified suppliers to capture new accounts. Vitamin A, buoyed by swine restocking and enhanced poultry immunity programs, is forecast to grow at a 5.5% CAGR through 2030 and lift its share of the North America feed vitamins market size by the end of the decade.
B-complex demand holds steady despite tighter Chinese exports, with thiamine seeing the sharpest 25% price jump. Vitamin C remains oversupplied, while vitamin D3 commands premium pricing because only a handful of firms meet North American quality standards. Other vitamins, such as biotin and folic acid, show stable, low-volume demand profiles that cushion supply shocks. Producers that balance single-site risk with multi-regional sourcing gain an edge in the North America feed vitamins market.


By Animal Type: Poultry Leadership and Ruminant Growth
Poultry accounted for 43.4% of the North America feed vitamins market share in 2024, reflecting industrialized vitamin programs that support dense broiler and layer operations. Vitamin E and A inclusion now runs 20-25% above historic norms, while vitamin D3 fortification in layers preserves shell integrity.
Ruminants are projected to expand at a 5.9% CAGR, driven by carbon credit revenue that offsets diet costs. Beef producers adopt vitamin-infused formulations to cut methane 15-30%, whereas dairy herds emphasize reproductive efficiency with vitamin E levels 30% higher than past baselines. Swine continue to rebuild post-ASF, and aquaculture remains a niche but premium segment requiring marine-grade vitamins. The steady roll-out of welfare-linked standards ensures broad-based vitamin fortification across every animal class in the North America feed vitamins market.
Geography Analysis
The United States commanded 70.6% of the North America feed vitamins market in 2024. Large poultry complexes in Georgia, Arkansas, and North Carolina, and expansive cattle herds in Texas, Nebraska, and Kansas, underpin consistent demand. Inflation Reduction Act incentives covering 30% of “low-methane” feed costs accelerate vitamin-rich formulations, while FDA approvals for algae concentrates diversify sourcing and reduce reliance on single overseas plants.
Mexico is the fastest-growing geography at a 5.8% CAGR. Government-backed livestock expansion and ASF herd rebuilding raise vitamin volume, especially in Jalisco and Sonora. Producers capitalize on Gold Standard carbon methodologies, reporting USD 8-12 per head in offset income, which comfortably exceeds incremental vitamin expense. Cross-border trade with U.S. premix makers keeps pricing competitive, and regulatory harmonization around sustainability further elevates demand.
Canada holds a steady share but faces headwinds from tighter vitamin A limits that took effect in 2025. Feed mills re-engineer formulations, creating openings for local suppliers of compliant low-potency concentrates. Strong welfare standards push vitamin D3 and E inclusion 25-30% above baseline. Elsewhere in North America, nascent aquaculture clusters in Central America source specialized marine vitamins at premium prices, adding a modest yet profitable layer to the North America feed vitamins market.
Competitive Landscape
The North America feed vitamins market is moderately concentrated, with the top five players being DSM-Firmenich AG, Archer Daniels Midland Co., Lonza Group Ltd., Brenntag SE, and Adisseo. DSM-Firmenich AG leads, followed by Archer Daniels Midland Co. and Lonza Group Ltd. DSM-Firmenich is divesting its Animal Nutrition and Health unit by 2025 to reduce exposure to vitamin cyclicality, a business worth EUR 1.5 billion (USD 1.6 billion) sold to Novonesis in February 2025.
Supply shocks since mid-2024 have rewarded firms with diversified footprints. DSM-Firmenich reported EUR 80 million (USD 86 million) in temporary profit gains during Q4 2024, while single-site producers grappled with allocations. Cargill’s September 2024 purchase of two U.S. feed mills expanded its animal nutrition footprint and gave the firm greater purchasing leverage for vitamins.
Regulatory capabilities now differentiate leading suppliers. Companies obtaining GRAS for algae-based concentrates win premium contracts in organic channels, and those able to document methane-reduction efficacy secure deals tied to carbon credit programs. Localized premix blenders that maintain agile inventory also capture share during supply disruptions, reinforcing competitive flux in the North America feed vitamins market.
North America Feed Vitamins Industry Leaders
-
Adisseo
-
Brenntag SE
-
Lonza Group Ltd.
-
DSM-Firmenich AG
-
Archer Daniels Midland Co.
- *Disclaimer: Major Players sorted in no particular order


Recent Industry Developments
- February 2025: DSM-Firmenich completed the sale of its stake in the Feed Enzymes Alliance to partner Novonesis for EUR 1.5 billion (USD 1.6 billion), marking the strategic repositioning of feed enzyme assets as the company prepares Animal Nutrition and Health unit separation.
- September 2024: Cargill acquired two feed mills from Compana Pet Brands, expanding Animal Nutrition and Health presence with facilities in Denver, Colorado, and Kansas City, Missouri, to serve agriculture retail, livestock operations, and pet nutrition markets.
- June 2024: GC Rieber VivoMega completed a USD 75 million omega-3 production expansion, increasing manufacturing capacity for marine-derived nutritional ingredients used in aquaculture and premium feed formulations.


North America Feed Vitamins Market Report Scope
Vitamin A, Vitamin B, Vitamin C, Vitamin E are covered as segments by Sub Additive. Aquaculture, Poultry, Ruminants, Swine are covered as segments by Animal. Canada, Mexico, United States are covered as segments by Country.
By Sub Additive
| Vitamin A |
| Vitamin B |
| Vitamin C |
| Vitamin E |
| Other Vitamins |
By Animal Type
| Aquaculture | By Sub Animal | Fish |
| Shrimp | ||
| Other Aquaculture Species | ||
| Poultry | By Sub Animal | Broiler |
| Layer | ||
| Other Poultry Birds | ||
| Ruminants | By Sub Animal | Beef Cattle |
| Dairy Cattle | ||
| Other Ruminants | ||
| Swine | ||
| Other Animals |
By Geography
| Canada |
| Mexico |
| United States |
| Rest of North America |
| By Sub Additive | Vitamin A | ||
| Vitamin B | |||
| Vitamin C | |||
| Vitamin E | |||
| Other Vitamins | |||
| By Animal Type | Aquaculture | By Sub Animal | Fish |
| Shrimp | |||
| Other Aquaculture Species | |||
| Poultry | By Sub Animal | Broiler | |
| Layer | |||
| Other Poultry Birds | |||
| Ruminants | By Sub Animal | Beef Cattle | |
| Dairy Cattle | |||
| Other Ruminants | |||
| Swine | |||
| Other Animals | |||
| By Geography | Canada | ||
| Mexico | |||
| United States | |||
| Rest of North America | |||


Market Definition
- FUNCTIONS - For the study, feed additives are considered to be commercially manufactured products that are used to enhance characteristics such as weight gain, feed conversion ratio, and feed intake when fed in appropriate proportions.
- RESELLERS - Companies engaged in reselling feed additives without value addition have been excluded from the market scope, to avoid double counting.
- END CONSUMERS - Compound feed manufacturers are considered to be end-consumers in the market studied. The scope excludes farmers buying feed additives to be used directly as supplements or premixes.
- INTERNAL COMPANY CONSUMPTION - Companies engaged in the production of compound feed as well as the manufacturing of feed additives are part of the study. However, while estimating the market sizes, the internal consumption of feed additives by such companies has been excluded.
| Keyword | Definition |
|---|---|
| Feed additives | Feed additives are products used in animal nutrition for purposes of improving the quality of feed and the quality of food from animal origin, or to improve the animals’ performance and health. |
| Probiotics | Probiotics are microorganisms introduced into the body for their beneficial qualities. (It maintains or restores beneficial bacteria to the gut). |
| Antibiotics | Antibiotic is a drug that is specifically used to inhibit the growth of bacteria. |
| Prebiotics | A non-digestible food ingredient that promotes the growth of beneficial microorganisms in the intestines. |
| Antioxidants | Antioxidants are compounds that inhibit oxidation, a chemical reaction that produces free radicals. |
| Phytogenics | Phytogenics are a group of natural and non-antibiotic growth promoters derived from herbs, spices, essential oils, and oleoresins. |
| Vitamins | Vitamins are organic compounds, which are required for normal growth and maintenance of the body. |
| Metabolism | A chemical process that occurs within a living organism in order to maintain life. |
| Amino acids | Amino acids are the building blocks of proteins and play an important role in metabolic pathways. |
| Enzymes | Enzyme is a substance that acts as a catalyst to bring about a specific biochemical reaction. |
| Anti-microbial resistance | The ability of a microorganism to resist the effects of an antimicrobial agent. |
| Anti-microbial | Destroying or inhibiting the growth of microorganisms. |
| Osmotic balance | It is a process of maintaining salt and water balance across membranes within the body's fluids. |
| Bacteriocin | Bacteriocins are the toxins produced by bacteria to inhibit the growth of similar or closely related bacterial strains. |
| Biohydrogenation | It is a process that occurs in the rumen of an animal in which bacteria convert unsaturated fatty acids (USFA) to saturated fatty acids (SFA). |
| Oxidative rancidity | It is a reaction of fatty acids with oxygen, which generally causes unpleasant odors in animals. To prevent these, antioxidants were added. |
| Mycotoxicosis | Any condition or disease caused by fungal toxins, mainly due to contamination of animal feed with mycotoxins. |
| Mycotoxins | Mycotoxins are toxin compounds that are naturally produced by certain types of molds (fungi). |
| Feed Probiotics | Microbial feed supplements positively affect gastrointestinal microbial balance. |
| Probiotic yeast | Feed yeast (single-cell fungi) and other fungi used as probiotics. |
| Feed enzymes | They are used to supplement digestive enzymes in an animal’s stomach to break down food. Enzymes also ensure that meat and egg production is improved. |
| Mycotoxin detoxifiers | They are used to prevent fungal growth and to stop any harmful mold from being absorbed in the gut and blood. |
| Feed antibiotics | They are used both for the prevention and treatment of diseases but also for rapid growth and development. |
| Feed antioxidants | They are used to protect the deterioration of other feed nutrients in the feed such as fats, vitamins, pigments, and flavoring agents, thus providing nutrient security to the animals. |
| Feed phytogenics | Phytogenics are natural substances, added to livestock feed to promote growth, aid in digestion, and act as anti-microbial agents. |
| Feed vitamins | They are used to maintain the normal physiological function and normal growth and development of animals. |
| Feed flavors and sweetners | These flavors and sweeteners help to mask tastes and odors during changes in additives or medications and make them ideal for animal diets undergoing transition. |
| Feed acidifiers | Animal feed acidifiers are organic acids incorporated into the feed for nutritional or preservative purposes. Acidifiers enhance congestion and microbiological balance in the alimentary and digestive tracts of livestock. |
| Feed minerals | Feed minerals play an important role in the regular dietary requirements of animal feed. |
| Feed binders | Feed binders are the binding agents used in the manufacture of safe animal feed products. It enhances the taste of food and prolongs the storage period of the feed. |
| Key Terms | Abbreviation |
| LSDV | Lumpy Skin Disease Virus |
| ASF | African Swine Fever |
| GPA | Growth Promoter Antibiotics |
| NSP | Non-Starch Polysaccharides |
| PUFA | Polyunsaturated Fatty Acid |
| Afs | Aflatoxins |
| AGP | Antibiotic Growth Promoters |
| FAO | The Food And Agriculture Organization of the United Nations |
| USDA | The United States Department of Agriculture |


Research Methodology
Mordor Intelligence follows a four-step methodology in all our reports.
- Step-1: IDENTIFY KEY VARIABLES: In order to build a robust forecasting methodology, the variables and factors identified in Step-1 are tested against available historical market numbers. Through an iterative process, the variables required for market forecast are set and the model is built on the basis of these variables.
- Step-2: Build a Market Model: Market-size estimations for the forecast years are in nominal terms. Inflation is not a part of the pricing, and the average selling price (ASP) is kept constant throughout the forecast period.
- Step-3: Validate and Finalize: In this important step, all market numbers, variables and analyst calls are validated through an extensive network of primary research experts from the market studied. The respondents are selected across levels and functions to generate a holistic picture of the market studied.
- Step-4: Research Outputs: Syndicated Reports, Custom Consulting Assignments, Databases & Subscription Platforms


