Feed Flavors And Sweeteners Market Size and Share
Market Overview
| Study Period | 2018 - 2031 |
|---|---|
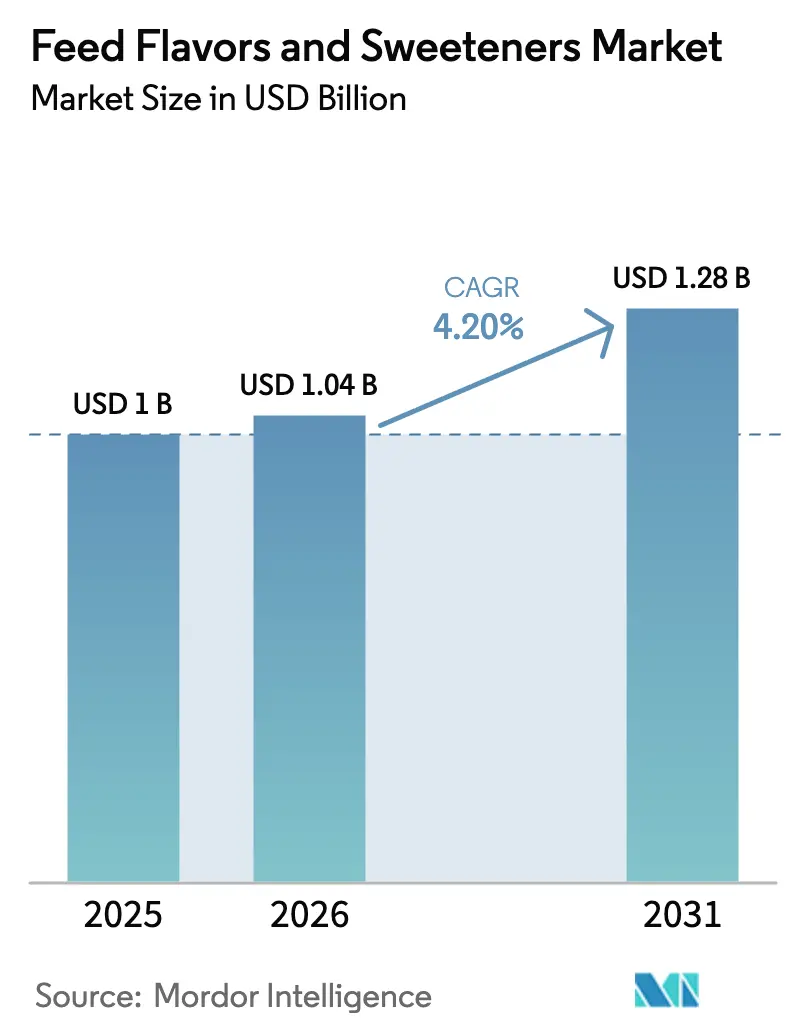
| Market Size (2026) | USD 1.04 Billion |
| Market Size (2031) | USD 1.28 Billion |
| Growth Rate (2026 - 2031) | 4.20% CAGR |
| Fastest Growing Market | Asia Pacific |
| Largest Market | Asia Pacific |
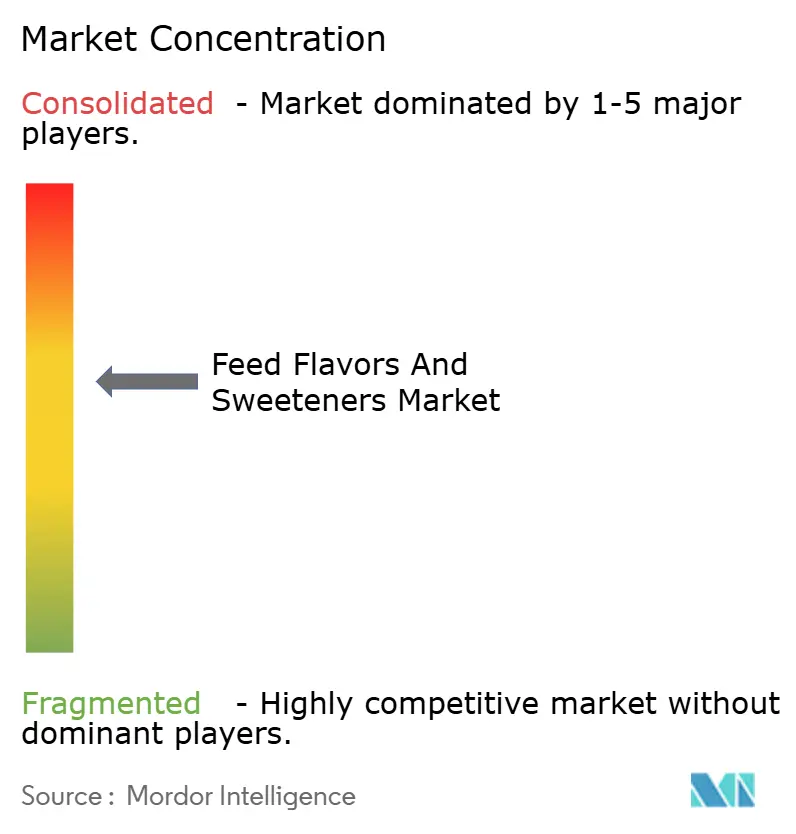
| Market Concentration | Medium |
Major Players *Disclaimer: Major Players sorted in no particular order Image © Mordor Intelligence. Reuse requires attribution under CC BY 4.0. | |
Feed Flavors And Sweeteners Market Analysis by Mordor Intelligence
The feed flavors and sweeteners market size is expected to grow from USD 1.00 billion in 2025 to USD 1.04 billion in 2026 and is forecast to reach USD 1.28 billion by 2031 at 4.20% CAGR over 2026-2031. Demand is propelled by global bans on antibiotic growth promoters, a shift that elevates palatability enhancers as performance safeguards that face no residue limits. Producers now favor flavor–sweetener blends that simultaneously boost intake and support gut health, a preference that encourages suppliers to bundle technologies rather than sell single-function products [1]Source: Cargill Inc., “Animal Nutrition Solutions,” Cargill, cargill.com. The industry has witnessed substantial growth in feed production, reflecting the expanding livestock sector and growing demand for high-quality animal products. This growth is particularly notable in regions experiencing rapid urbanization and rising disposable incomes, where consumers are increasingly demanding premium meat and dairy products. The shift towards industrialized farming practices has further accelerated the adoption of advanced feed palatability enhancers, including flavors and sweeteners, to enhance feed palatability and consumption. Competition gravitates toward firms with vertically integrated supply chains able to hedge raw-material volatility and meet multi-region regulatory filings.
Key Report Takeaways
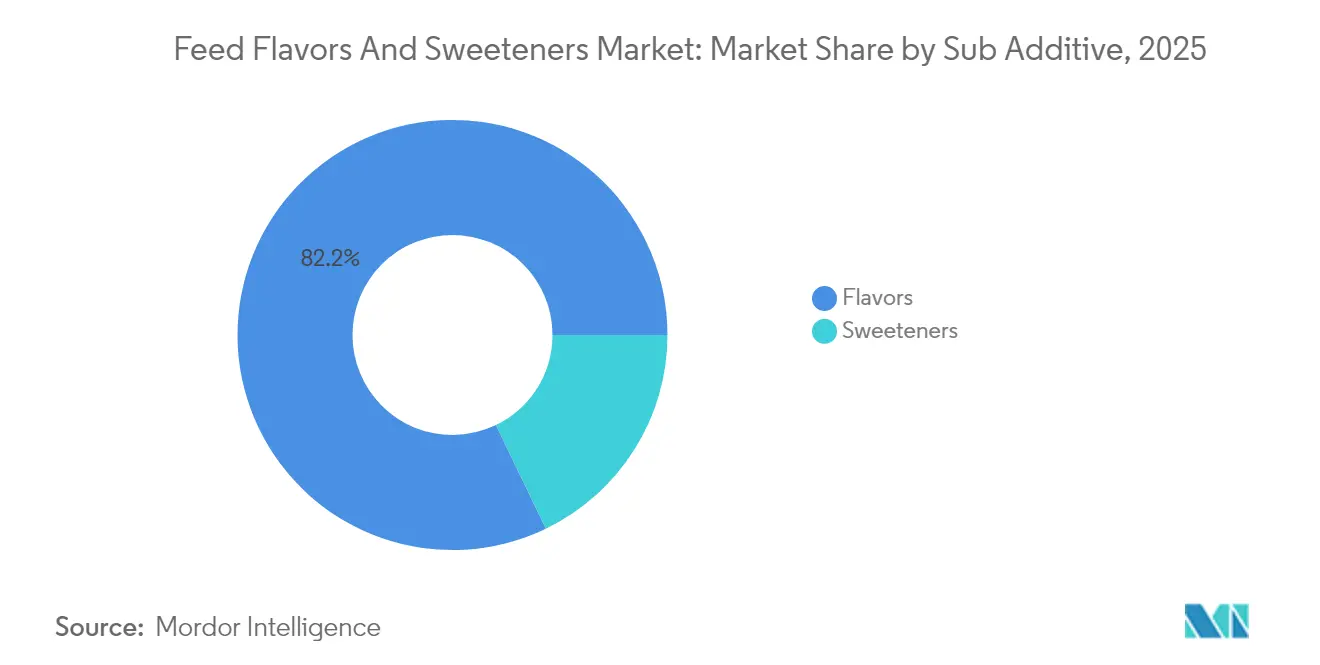
- By sub-additive, flavors led with 82.15% of the feed flavors and sweeteners market share in 2025, while sweeteners are projected to grow at a 4.32% CAGR to 2031.
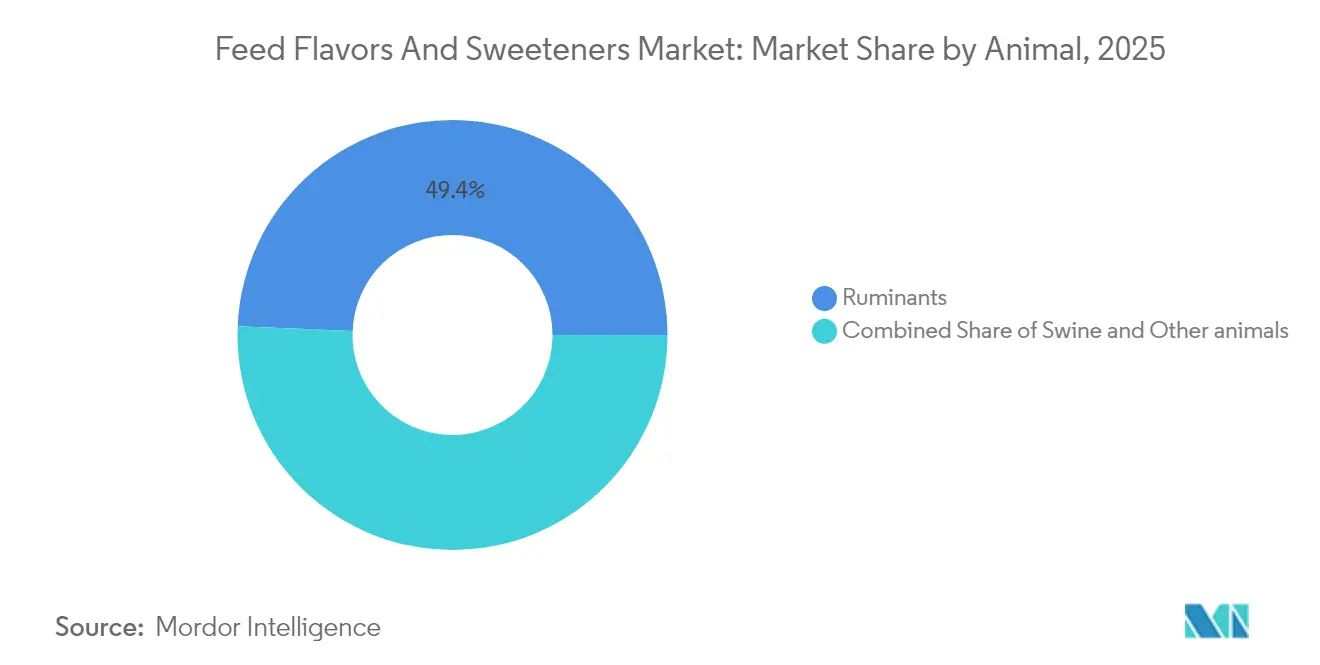
- By animal, Ruminants held 49.35% of the feed flavors and sweeteners market size in 2025, while Ruminants is advancing at a 4.29% CAGR through 2031.
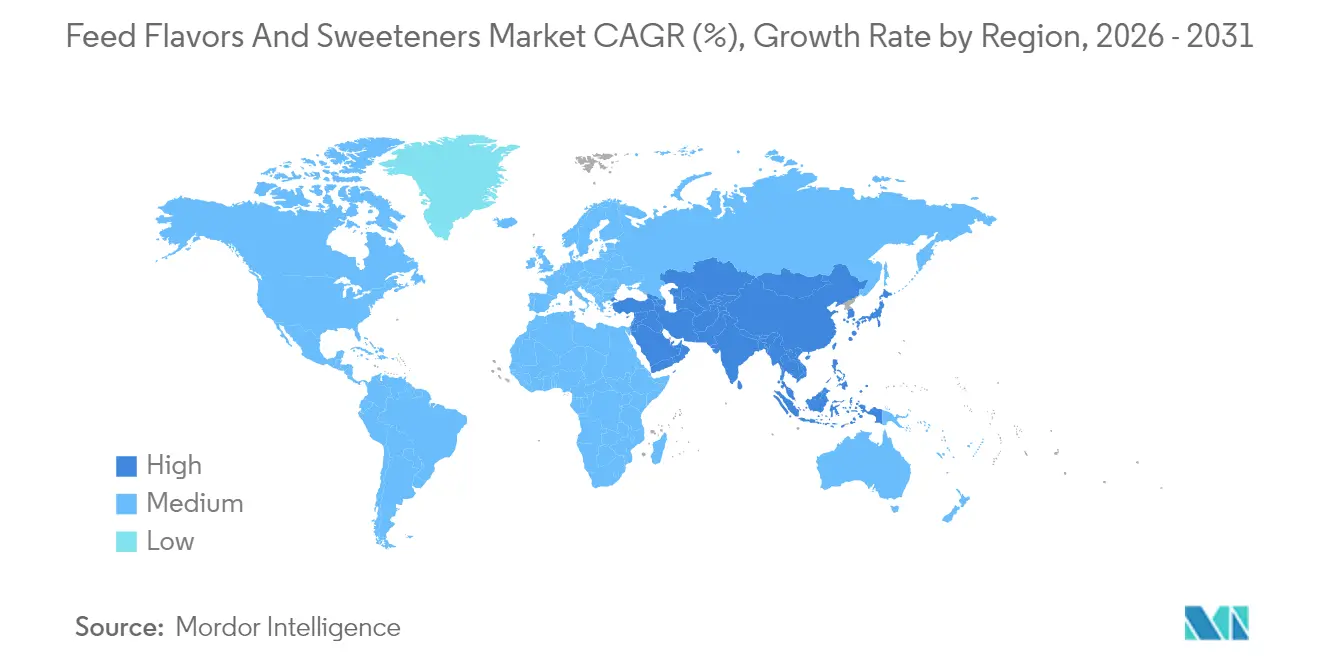
- By geography, Asia-Pacific commanded 30.12% revenue share in 2025, while the region is forecast to post a 2.74% CAGR to 2031.
Note: Market size and forecast figures in this report are generated using Mordor Intelligence’s proprietary estimation framework, updated with the latest available data and insights as of 2026.
Global Feed Flavors And Sweeteners Market Trends and Insights
Drivers Impact Analysis*
| Driver | (~) % Impact on CAGR Forecast | Geographic Relevance | Impact Timeline |
|---|---|---|---|
| Increasing demand for functional feed additives | +1.2% | Global, with a concentration in Asia-Pacific and Europe | Medium term (2-4 years) |
| Ban on antibiotic growth promoters in major producing countries | +1.5% | North America, Europe, with spillover to the Asia-Pacific | Short term (≤ 2 years) |
| Growing livestock population driven by rising demand and profitability | +1.8% | Asia-Pacific core, expansion to South America and Africa | Long term (≥ 4 years) |
| Premiumization of compound feed formulas | +0.9% | Europe, North America, and with the adoption in emerging markets | Medium term (2-4 years) |
| Emergence of precision-feeding IoT platforms | +0.4% | North America and Europe are early adopted, and Asia-Pacific follows | Long term (≥ 4 years) |
| Growth of insect-protein feed requiring masking flavors | +0.3% | Europe leading, North America and Asia-Pacific emerging | Long term (≥ 4 years) |
| Source: Mordor Intelligence | |||


Increasing Demand for Functional Feed Additives
The shift toward multifunctional feed additives represents a fundamental industry transformation, with palatability enhancers increasingly combined with nutritional and health benefits. Modern feed formulations demand ingredients that simultaneously improve taste, digestibility, and animal welfare outcomes, driving premium pricing for sophisticated flavor and sweetener systems. Cargill's recent expansion of its Provimi palatant line demonstrates this trend, incorporating prebiotic components alongside traditional flavor compounds to address both intake optimization and gut health. This convergence creates competitive advantages for suppliers capable of delivering integrated solutions rather than standalone palatability products. The trend particularly accelerates in premium livestock applications, where feed conversion efficiency directly impacts profitability margins for swine producers seeking competitive differentiation in global protein markets.
Ban on Antibiotic Growth Promoters in Major Producing Countries
Regulatory elimination of antibiotic growth promoters across the United States, European Union, and increasingly in China has created sustained structural demand for palatability enhancers that maintain feed intake during transition periods. The FDA's (Food and Drug Administration) Veterinary Feed Directive implementation and the EU's (European Union) complete antibiotic ban have forced livestock producers to rely on alternative performance enhancement strategies, with palatability improvement emerging as a critical component of antibiotic-free production systems. This regulatory shift generates particularly strong demand in ruminants and swine operations, where feed intake consistency directly correlates with growth performance and economic viability. The transition creates market opportunities for companies developing natural flavor compounds and plant-based sweeteners that align with clean-label consumer preferences while maintaining production efficiency standards.
Growing Livestock Population Driven by Rising Demand and Profitability
The global beef demand is increasing due to population growth, health consciousness, expansion of the food and beverage industry, emerging market demand, and value addition. The rising beef consumption and improved cattle farming profitability have led to an expansion in beef cattle farms. The sheep and goat farming sector is also expanding due to increased profitability from growing demand [2]Source: Statistics Canada, “Livestock Estimates, January 1 2024,” Statistics Canada, statcan.gc.ca. The Asia-Pacific region holds the maximum share of the global goat population, with major contributions from China, India, Pakistan, Bangladesh, and Mongolia. For sheep farming, China, India, Iran, Mongolia, and Turkey are the primary markets. The increased profitability in cattle farming is supporting the growth of the flavors and sweeteners market, while the expanding demand for sheep and goats is enhancing production and profits in these segments.
Premiumization of Compound Feed Formulas
Feed manufacturers increasingly differentiate through premium formulations incorporating sophisticated palatability systems, reflecting downstream pressure from protein producers seeking competitive advantages in consumer markets. This premiumization trend drives demand for natural and organic-certified flavor and sweetener ingredients, with price premiums justifying higher input costs for specialized palatability solutions. European feed manufacturers lead this trend, incorporating plant-based flavor compounds and certified organic sweeteners to align with consumer sustainability preferences. Premiumization dynamic creates market segmentation opportunities, with high-value applications supporting premium pricing while commodity segments remain price-sensitive to traditional flavor and sweetener solutions.
Restraints Impact Analysis*
| Restraint | (~) % Impact on CAGR Forecast | Geographic Relevance | Impact Timeline |
|---|---|---|---|
| Volatility in sugar and molasses prices | -0.8% | Global, with particular impact on cost-sensitive markets | Short term (≤ 2 years) |
| Stringent approval timelines for new feed additives | -0.6% | Europe and North America, primarily, are expanding globally | Medium term (2-4 years) |
| Rising popularity of antibiotic alternatives such as essential oils | -0.4% | Global, with a concentration in premium markets | Medium term (2-4 years) |
| Regional disparity in palatability preferences | -0.3% | Global fragmentation challenge | Long term (≥ 4 years) |
| Source: Mordor Intelligence | |||
Volatility in Sugar and Molasses Prices
Raw material cost fluctuations for sugar-based sweeteners create margin pressure and pricing unpredictability, particularly impacting cost-sensitive livestock operations in emerging markets. Global sugar prices experienced 23% volatility in 2024, driven by weather disruptions in major producing regions and biofuel demand competition. This volatility forces additive manufacturers to implement dynamic pricing strategies and explore alternative sweetener sources, including synthetic and plant-based options that offer greater price stability. The challenge particularly affects smaller regional players lacking procurement scale and hedging capabilities, creating consolidation pressure within the supplier base and opportunities for integrated companies with diversified raw material sourcing strategies.
Stringent Approval Timelines for New Feed Additives
Regulatory approval processes for novel palatability enhancers extend 18-24 months in major markets, creating barriers to innovation and market entry for breakthrough technologies. The European Food Safety Authority's comprehensive safety assessment requirements and the FDA's rigorous review protocols delay the commercialization of advanced flavor compounds and natural sweetener alternatives. This regulatory complexity favors established players with regulatory expertise and financial resources to navigate extended approval timelines, while constraining smaller innovators from bringing differentiated solutions to market. The approval bottleneck particularly impacts emerging technologies like encapsulated flavor systems and precision-targeted palatability enhancers that require extensive safety documentation and efficacy validation studies.
*Our forecasts treat driver/restraint impacts as directional, not additive. The impact forecasts reflect baseline growth, mix effects, and variable interactions.
Segment Analysis
By Sub-Additive: Flavors Dominate Despite Sweetener Innovation
Flavors maintain commanding market leadership with an 82.15% share in 2025, reflecting their fundamental role in masking unpalatable feed ingredients and enhancing overall feed acceptance across diverse animal species. Flavors are particularly important for ruminants and swine, as these animals have a large number of taste buds, with cattle having about 25,000 taste buds on their tongue's dorsal surface. The addition of flavors in animal feed has shown remarkable benefits, including improved animal gains by up to 18% and enhanced feed efficiency by nearly 8%. The segment's strong performance is further supported by the increasing demand from North America, which has demonstrated substantial growth due to high feed intake rates and an expanding number of feed mills in the region. Symrise AG's entry into livestock flavor applications demonstrates the convergence of human food and animal feed technologies, bringing sophisticated flavor science expertise to agricultural markets.
Sweeteners represent the fastest-growing sub-additive category at 4.32% CAGR through 2031, driven by natural alternatives adoption and regulatory pressure to reduce synthetic additives in animal nutrition. Stevia-based feed sweeteners gained significant traction in 2024, with companies like Benepure Pharmaceutical expanding production capacity to meet growing demand from organic and premium feed manufacturers. The sub-additive landscape increasingly favors companies capable of delivering integrated flavor and sweetener systems rather than standalone products, reflecting feed manufacturers' preference for simplified supply chains and consistent performance across product lines.


By Animal: Ruminants Emerges as Growth Engine
Ruminant applications command the largest animal segment with 49.35% market share in 2025. The segment's unique physiological characteristics primarily drive this substantial market presence, as ruminants possess a significantly higher number of taste buds compared to other livestock, with cattle having approximately 25,000 taste buds on their tongue. This biological feature makes the addition of flavors and sweeteners particularly effective in improving feed palatability and intake.
The segment's dominance is further reinforced by the growing global demand for high-quality beef and dairy products, which has led to increased focus on optimizing feed formulations. Additionally, the ruminant segment is experiencing the market's fastest growth trajectory, with a projected CAGR of approximately 4.29% through 2031, driven by the rising need to maintain animal health and improve performance through enhanced feed intake.
Geography Analysis
Asia-Pacific dominates with 30.12% market share in 2025 and maintains the fastest regional growth at 2.74% CAGR through 2031, reflecting rapid ruminants expansion and swine sector modernization across Vietnam, Thailand, and Indonesia. The region's growth trajectory stems from protein consumption increases, feed quality premiumization, and regulatory alignment with international standards for animal nutrition. China's implementation of stricter feed additive regulations in 2024 created opportunities for established international suppliers while challenging local producers lacking compliance capabilities.
Europe maintains a mature market position characterized by high-value applications and stringent regulatory requirements that favor innovative palatability solutions. The region's emphasis on sustainability and animal welfare creates demand for plant-based and organic-certified flavor and sweetener ingredients, supporting premium pricing for specialized products.

Competitive Landscape
The feed flavors and sweeteners market exhibits moderate concentration with players including Solvay S.A., Archer-Daniels-Midland Co., Adisseo, Alltech, Inc., and Arvesta (Palital Feed Additives B.V). Creating a competitive environment that balances scale advantages with opportunities for specialized entrants. Market leadership reflects companies' ability to navigate complex regulatory landscapes, maintain consistent raw material sourcing, and deliver technical support across diverse animal nutrition applications.
The moderate concentration nature of the remaining market creates opportunities for regional players and technology specialists to capture niche segments through differentiated product offerings and localized customer relationships. Feed additive approval requirements under the European Food Safety Authority (EFSA) and the Food and Drug Administration (FDA) frameworks create regulatory barriers that favor established players while constraining new entrants lacking compliance expertise.
Strategic patterns emphasize vertical integration, geographic expansion, and technology acquisition to build competitive moats in an increasingly sophisticated market. Companies pursue acquisitions to access specialized technologies, expand geographic reach, and integrate supply chains for cost optimization and quality control. Patent filings in encapsulation technologies and natural flavor extraction methods indicate innovation focus areas, with intellectual property becoming increasingly important for competitive differentiation.
Feed Flavors And Sweeteners Industry Leaders
Solvay S.A.
Adisseo
Alltech, Inc.
Arvesta (Palital Feed Additives B.V)
Archer Daniels Midland Co.
- *Disclaimer: Major Players sorted in no particular order

Recent Industry Developments
- May 2022: Innov Ad NV/SA acquired Scentarom, a developer and manufacturer of feed flavors and fragrances. Innovad's position as a primary producer will be strengthened by the acquisition, which will also increase capacity to support the growth in feed palatability and essential oil products.
- June 2021: Phytobiotics established its own company, Phytobiotics Iberica, with its headquarters in Malaga to address the rapidly expanding Spain and Portugal market for premixed animal feed and plant production requirements.


Global Feed Flavors And Sweeteners Market Report Scope
Flavors, Sweeteners are covered as segments by Sub Additive. Ruminants and swine are covered as segments by Animal. Africa, Asia-Pacific, Europe, the Middle East, North America, and South America are covered as segments by Region.
| Flavors |
| Sweeteners |
| Ruminants | By Sub Animal | Beef Cattle |
| Dairy Cattle | ||
| Other Ruminants | ||
| Swine | ||
| Other Animals |
| Africa | By Country | Egypt |
| Kenya | ||
| South Africa | ||
| Rest of Africa | ||
| Asia-Pacific | By Country | Australia |
| China | ||
| India | ||
| Indonesia | ||
| Japan | ||
| Philippines | ||
| South Korea | ||
| Thailand | ||
| Vietnam | ||
| Rest of Asia-Pacific | ||
| Europe | By Country | France |
| Germany | ||
| Italy | ||
| Netherlands | ||
| Russia | ||
| Spain | ||
| Turkey | ||
| United Kingdom | ||
| Rest of Europe | ||
| Middle East | By Country | Iran |
| Saudi Arabia | ||
| Rest of Middle East | ||
| North America | By Country | Canada |
| Mexico | ||
| United States | ||
| Rest of North America | ||
| South America | By Country | Argentina |
| Brazil | ||
| Chile | ||
| Rest of South America |
| Sub Additive | Flavors | ||
| Sweeteners | |||
| By Animal | Ruminants | By Sub Animal | Beef Cattle |
| Dairy Cattle | |||
| Other Ruminants | |||
| Swine | |||
| Other Animals | |||
| By Geography | Africa | By Country | Egypt |
| Kenya | |||
| South Africa | |||
| Rest of Africa | |||
| Asia-Pacific | By Country | Australia | |
| China | |||
| India | |||
| Indonesia | |||
| Japan | |||
| Philippines | |||
| South Korea | |||
| Thailand | |||
| Vietnam | |||
| Rest of Asia-Pacific | |||
| Europe | By Country | France | |
| Germany | |||
| Italy | |||
| Netherlands | |||
| Russia | |||
| Spain | |||
| Turkey | |||
| United Kingdom | |||
| Rest of Europe | |||
| Middle East | By Country | Iran | |
| Saudi Arabia | |||
| Rest of Middle East | |||
| North America | By Country | Canada | |
| Mexico | |||
| United States | |||
| Rest of North America | |||
| South America | By Country | Argentina | |
| Brazil | |||
| Chile | |||
| Rest of South America | |||


Market Definition
- FUNCTIONS - For the study, feed additives are considered to be commercially manufactured products that are used to enhance characteristics such as weight gain, feed conversion ratio, and feed intake when fed in appropriate proportions.
- RESELLERS - Companies engaged in reselling feed additives without value addition have been excluded from the market scope, to avoid double counting.
- END CONSUMERS - Compound feed manufacturers are considered to be end-consumers in the market studied. The scope excludes farmers buying feed additives to be used directly as supplements or premixes.
- INTERNAL COMPANY CONSUMPTION - Companies engaged in the production of compound feed as well as the manufacturing of feed additives are part of the study. However, while estimating the market sizes, the internal consumption of feed additives by such companies has been excluded.
| Keyword | Definition |
|---|---|
| Feed additives | Feed additives are products used in animal nutrition for purposes of improving the quality of feed and the quality of food from animal origin, or to improve the animals’ performance and health. |
| Probiotics | Probiotics are microorganisms introduced into the body for their beneficial qualities. (It maintains or restores beneficial bacteria to the gut). |
| Antibiotics | Antibiotic is a drug that is specifically used to inhibit the growth of bacteria. |
| Prebiotics | A non-digestible food ingredient that promotes the growth of beneficial microorganisms in the intestines. |
| Antioxidants | Antioxidants are compounds that inhibit oxidation, a chemical reaction that produces free radicals. |
| Phytogenics | Phytogenics are a group of natural and non-antibiotic growth promoters derived from herbs, spices, essential oils, and oleoresins. |
| Vitamins | Vitamins are organic compounds, which are required for normal growth and maintenance of the body. |
| Metabolism | A chemical process that occurs within a living organism in order to maintain life. |
| Amino acids | Amino acids are the building blocks of proteins and play an important role in metabolic pathways. |
| Enzymes | Enzyme is a substance that acts as a catalyst to bring about a specific biochemical reaction. |
| Anti-microbial resistance | The ability of a microorganism to resist the effects of an antimicrobial agent. |
| Anti-microbial | Destroying or inhibiting the growth of microorganisms. |
| Osmotic balance | It is a process of maintaining salt and water balance across membranes within the body's fluids. |
| Bacteriocin | Bacteriocins are the toxins produced by bacteria to inhibit the growth of similar or closely related bacterial strains. |
| Biohydrogenation | It is a process that occurs in the rumen of an animal in which bacteria convert unsaturated fatty acids (USFA) to saturated fatty acids (SFA). |
| Oxidative rancidity | It is a reaction of fatty acids with oxygen, which generally causes unpleasant odors in animals. To prevent these, antioxidants were added. |
| Mycotoxicosis | Any condition or disease caused by fungal toxins, mainly due to contamination of animal feed with mycotoxins. |
| Mycotoxins | Mycotoxins are toxin compounds that are naturally produced by certain types of molds (fungi). |
| Feed Probiotics | Microbial feed supplements positively affect gastrointestinal microbial balance. |
| Probiotic yeast | Feed yeast (single-cell fungi) and other fungi used as probiotics. |
| Feed enzymes | They are used to supplement digestive enzymes in an animal’s stomach to break down food. Enzymes also ensure that meat and egg production is improved. |
| Mycotoxin detoxifiers | They are used to prevent fungal growth and to stop any harmful mold from being absorbed in the gut and blood. |
| Feed antibiotics | They are used both for the prevention and treatment of diseases but also for rapid growth and development. |
| Feed antioxidants | They are used to protect the deterioration of other feed nutrients in the feed such as fats, vitamins, pigments, and flavoring agents, thus providing nutrient security to the animals. |
| Feed phytogenics | Phytogenics are natural substances, added to livestock feed to promote growth, aid in digestion, and act as anti-microbial agents. |
| Feed vitamins | They are used to maintain the normal physiological function and normal growth and development of animals. |
| Feed flavors and sweetners | These flavors and sweeteners help to mask tastes and odors during changes in additives or medications and make them ideal for animal diets undergoing transition. |
| Feed acidifiers | Animal feed acidifiers are organic acids incorporated into the feed for nutritional or preservative purposes. Acidifiers enhance congestion and microbiological balance in the alimentary and digestive tracts of livestock. |
| Feed minerals | Feed minerals play an important role in the regular dietary requirements of animal feed. |
| Feed binders | Feed binders are the binding agents used in the manufacture of safe animal feed products. It enhances the taste of food and prolongs the storage period of the feed. |
| Key Terms | Abbreviation |
| LSDV | Lumpy Skin Disease Virus |
| ASF | African Swine Fever |
| GPA | Growth Promoter Antibiotics |
| NSP | Non-Starch Polysaccharides |
| PUFA | Polyunsaturated Fatty Acid |
| Afs | Aflatoxins |
| AGP | Antibiotic Growth Promoters |
| FAO | The Food And Agriculture Organization of the United Nations |
| USDA | The United States Department of Agriculture |


Research Methodology
Mordor Intelligence follows a four-step methodology in all our reports.
- Step-1: IDENTIFY KEY VARIABLES: In order to build a robust forecasting methodology, the variables and factors identified in Step-1 are tested against available historical market numbers. Through an iterative process, the variables required for market forecast are set and the model is built on the basis of these variables.
- Step-2: Build a Market Model: Market-size estimations for the forecast years are in nominal terms. Inflation is not a part of the pricing, and the average selling price (ASP) is kept constant throughout the forecast period.
- Step-3: Validate and Finalize: In this important step, all market numbers, variables and analyst calls are validated through an extensive network of primary research experts from the market studied. The respondents are selected across levels and functions to generate a holistic picture of the market studied.
- Step-4: Research Outputs: Syndicated Reports, Custom Consulting Assignments, Databases & Subscription Platforms


