Market Overview
| Study Period | 2018 - 2031 |
|---|---|
| Forecast Data Period | 2026 - 2031 |
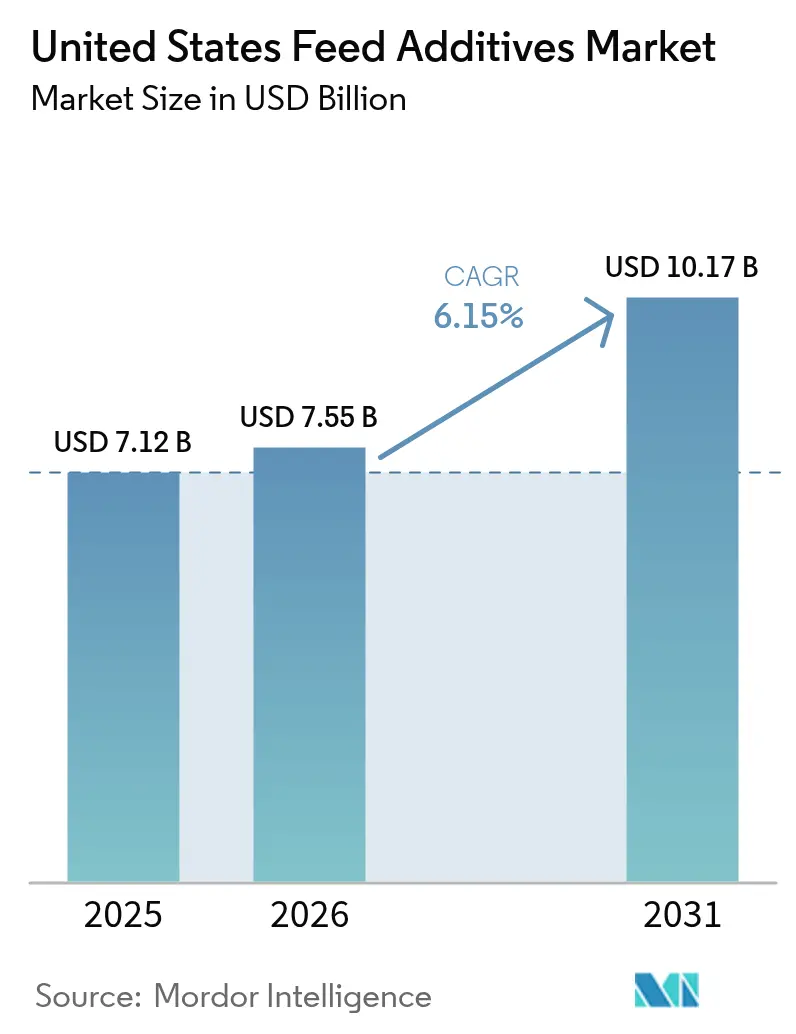
| Base Year Market Size (2025) | USD 7.12 Billion |
| Market Size (2026) | USD 7.55 Billion |
| Market Size (2031) | USD 10.17 Billion |
| Growth Rate (2026 - 2031) | 6.15% CAGR |
| Market Concentration | Low |
Major Players
*Disclaimer: Major Players sorted in no particular order Image © Mordor Intelligence. Reuse requires attribution under CC BY 4.0. |
|
United States Feed Additives Market Analysis by Mordor Intelligence
The United States feed additives market size is projected to increase from USD 7.12 billion in 2025 to USD 7.55 billion in 2026 and reach USD 10.17 billion by 2031, growing at a CAGR of 6.15% over 2026-2031. Growing retail and restaurant pressure for antibiotic-free meat, accelerating adoption of precision livestock farming, and state-level greenhouse gas rules for dairy herds are reshaping purchasing decisions across every species. Integrators are front-loading budgets toward amino acids, acidifiers, and enzymes because these functional blends improve feed conversion efficiency and reduce nitrogen and methane emissions, helping meet corporate sustainability scorecards. Price swings in corn and soybean meal continue to challenge margin planning, yet sensor-guided micro-dosing platforms are helping mills fine-tune inclusion rates within hours, mitigating waste and stabilizing cost per pound of gain. Multinational suppliers are adding regional fermentation capacity to buffer freight costs and to protect supply chains from raw-material volatility; they are also defending patent positions around next-generation phytases and multi-strain probiotics to secure pricing power.
Key Report Takeaways
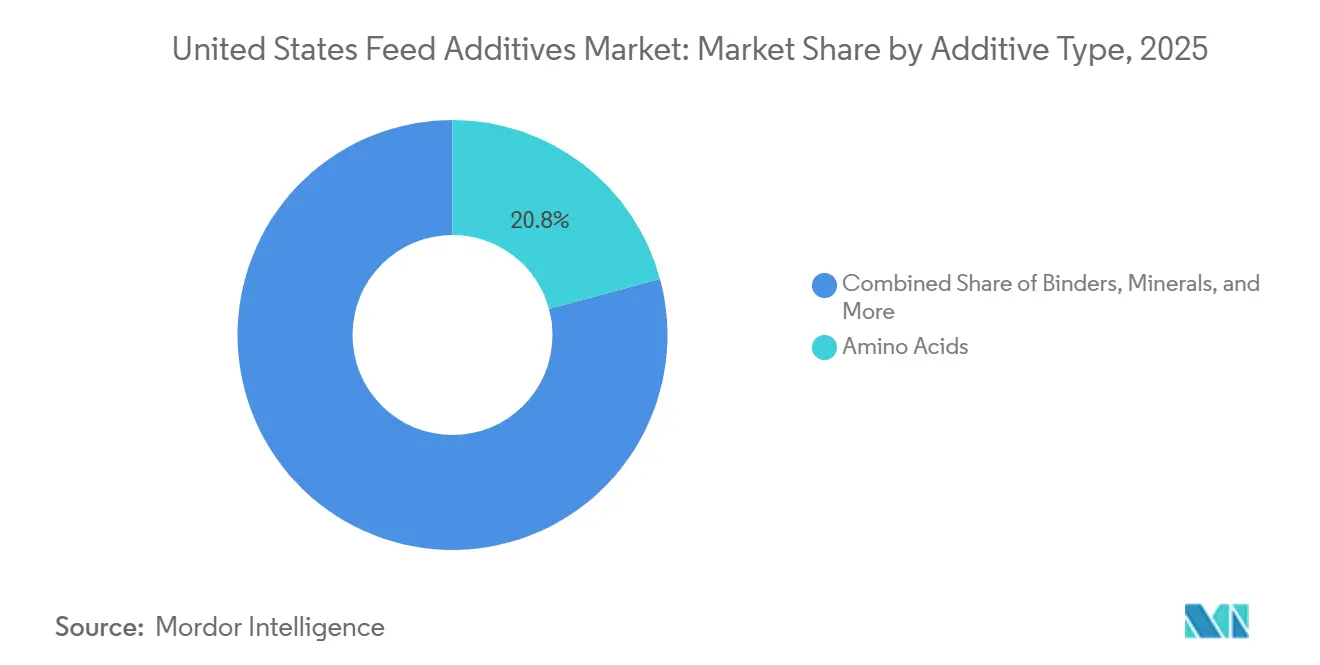
- By additive, amino acids led with 20.8% of the United States feed additives market share in 2025, whereas acidifiers are advancing at a 7.0% CAGR through 2031.
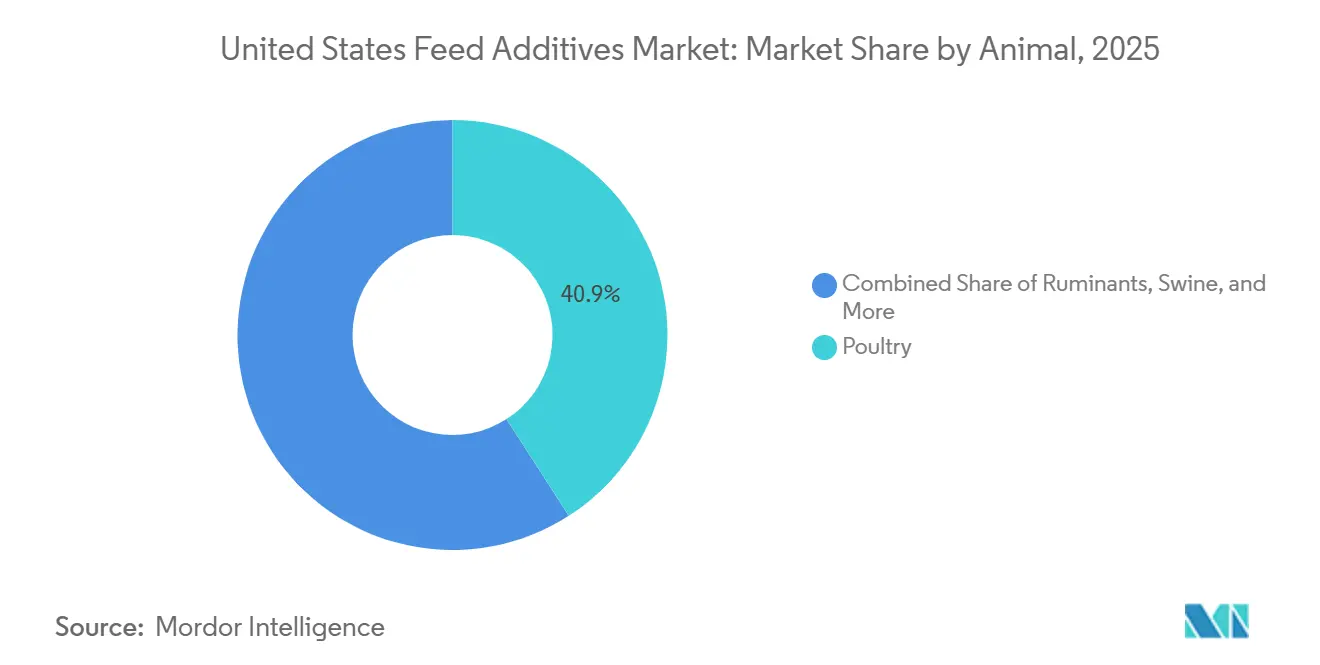
- By animal, poultry held 40.9% of the United States feed additives market size in 2025, while ruminants posted the fastest 6.6% CAGR between 2026 and 2031.
- The market is fragmented, with the top five players, DSM-Firmenich N.V., Archer Daniels Midland Company, Adisseo SAS (China National Bluestar (Group) Co, Ltd.), Nutreco N.V. (SHV Holdings N.V.), and Land O’ Lakes, Inc., accounting for significant market revenue in 2025.
Note: Market size and forecast figures in this report are generated using Mordor Intelligence’s proprietary estimation framework, updated with the latest available data and insights as of 2026.
United States Feed Additives Market Trends and Insights
Drivers Impact Analysis*
| Driver | (~) % Impact on CAGR Forecast | Geographic Relevance | Impact Timeline |
|---|---|---|---|
| Intensifying demand for high-protein meat and dairy | +1.0% | National, concentrated in Midwest dairy belt and Southeast poultry corridor | Medium term (2-4 years) |
| Functional additive blends replacing antibiotic growth promoters | +0.9% | National, accelerated in states with antibiotic stewardship programs | Short term (≤ 2 years) |
| Expansion of poultry production for quick-service restaurants | +0.8% | Georgia, Arkansas, Alabama, and North Carolina | Medium term (2-4 years) |
| Rise of direct-fed microbials in e-commerce animal health channels | +0.7% | Midwest swine and beef operations, expanding to poultry integrators | Medium term (2-4 years) |
| Precision livestock farming enabling real-time additive dosing | +0.8% | National, early adoption in organic and specialty livestock | Long term (≥ 4 years) |
| Regulatory allowance of higher amino acid inclusion rates | +0.4% | National after Association of American Feed Control Officials updates | Short term (≤ 2 years) |
| Source: Mordor Intelligence | |||


Intensifying Demand for High-Protein Meat and Dairy
Domestic red meat consumption plateaued near 226 pounds per capita in 2025, yet retailers want leaner cuts and consistent carcass traits, which pushes integrators to lift amino acid inclusion by nearly 10% across broiler and feedlot rations [1]Source: USDA Economic Research Service, "Per capita availability of red meat and poultry projected higher in 2025 and 2026," ers.usda.gov. Dairy cooperatives in Wisconsin and California are also raising protected methionine and lysine levels to supply protein-fortified beverages that now dominate grocery dairy aisles. Because these nutrients bypass rumen degradation, they increase milk protein yield without increasing crude protein intake, reducing nitrogen excretion, and meeting air-quality targets in emission-regulated counties. The dual pressure from the meat and dairy sectors keeps amino acids at the center of every formulation strategy. As a result, the United States feed additives market is experiencing stronger year-round contract pricing for lysine and threonine, and spot availability is tightening during harvest disruptions.
Functional Additive Blends Replacing Antibiotic Growth Promoters
The Veterinary Feed Directive, which removed growth-promotion claims from antibiotics, is now eight years old, yet producers continue to trial synergistic blends of organic acids, essential oils, and Bacillus probiotics to match historical feed efficiency. University of Georgia studies published in 2025 confirmed that a butyric-thymol-Bacillus cocktail equaled virginiamycin performance in broilers while cutting mortality by 1.2 points [2]Source: Land O’Lakes Incorporated, “Dairy Nutrition Solutions,” landolakesinc.com Source: University of Georgia, “Poultry Science Research,” uga.edu. Quick-service brands such as Chick-fil-A enforce strict no-antibiotics-ever sourcing, creating a guaranteed offtake that encourages mills to scale acidifier and enzyme use beyond pilot phases. Feed mills in Alabama and Arkansas now meter micro-additives by the gram, a level of precision unthinkable five years ago, anchoring a structural pivot toward functional blends across the United States feed additives market.
Precision Livestock Farming Enabling Real-Time Additive Dosing
Operations in Iowa, Nebraska, and Kansas have integrated automated feeders, weight scales, and environmental sensors with cloud analytics. These systems recalibrate lysine, methionine, and phytase inclusion rates daily based on growth rates and heat-stress conditions. Early adopters have reported reduced lysine waste and increased average daily gain, highlighting the efficiency of these technologies. Similarly, dairy farms have installed milk component scanners connected to dosing pumps that adjust methionine delivery as protein levels decline, ensuring optimal nutritional balance. While capital costs remain a significant barrier, integrators estimate a two-year payback period when corn prices rise above certain thresholds, driving increased interest and reinforcing the growing demand for data-driven solutions within the United States feed additives market.
Rise of Direct-Fed Microbials in E-Commerce Animal Health Channels
Online platforms such as Chewy and Tractor Supply listed more than 200 probiotic stock-keeping units in 2025, driving the sales of livestock supplements. Smallholders and organic farms embrace these channels to bypass distributor markups, while manufacturers benefit from direct feedback loops that inform strain selection and packaging sizes. Alltech, Inc. and Kemin Industries, Inc. launched subscription portals bundling probiotic sachets with diagnostic kits and remote nutritionist support, converting one-time buyers into repeat customers. However, inconsistent colony-forming-unit labeling and limited third-party verification cloud product efficacy. Extension agents caution that unverified blends may contain contaminants, a challenge that established suppliers address through independent audits, thereby strengthening their brand equity in the United States feed additives market.
Restraints Impact Analysis*
| Restraint | (~) % Impact on CAGR Forecast | Geographic Relevance | Impact Timeline |
|---|---|---|---|
| Volatile prices of key raw materials | -0.8% | National, acute in Corn Belt states | Short term (≤ 2 years) |
| Complex scrutiny of novel additive approvals | -0.5% | National under Food and Drug Administration oversight | Medium term (2-4 years) |
| On-farm fermentation of in-house probiotics | -0.4% | Midwest and Southeast, primarily large integrators | Long term (≥ 4 years) |
| Intellectual-property disputes over next-generation enzyme constructs | -0.3% | National, multinational ingredient suppliers | Medium term (2-4 years) |
| Source: Mordor Intelligence | |||
Complex Scrutiny of Novel Additive Approvals
The Food and Drug Administration requires multigeneration reproductive studies, residue-depletion studies, and environmental risk assessments for new feed additives, pushing approval timelines beyond 5 years and costing more than USD 10 million per candidate [3]Source: Food and Drug Administration, “Center for Veterinary Medicine Guidance Documents,” fda.gov. Recombinant enzymes produced in genetically modified microbes face additional scrutiny under the National Environmental Policy Act, burdening startups that lack the capital to generate exhaustive data sets. Even after clearance, companies must file periodic efficacy audits, adding compliance cost that tilts the playing field toward incumbents. The drawn-out pathway discourages investment in cutting-edge molecules, slowing technology refresh cycles within the United States feed additives market.
On-Farm Fermentation of In-House Probiotics
Integrated poultry and swine companies, including Pilgrim’s Pride and Tyson Foods, have implemented pilot fermentation units to produce Bacillus and Lactobacillus cultures using whey permeate at approximately half the commercial cost. These systems help secure margins and ensure supply stability during logistics disruptions. Quality control remains a significant challenge due to batch variability and contamination risks, which could negatively impact flock health. If standard operating procedures improve, in-house production could potentially replace a portion of commercial probiotic demand by 2030. This prospect has deterred some manufacturers from expanding capacity, limiting investment in certain segments of the United States feed additives market.
*Our forecasts treat driver/restraint impacts as directional, not additive. The impact forecasts reflect baseline growth, mix effects, and variable interactions.
Segment Analysis
By Additive: Amino Acids Lead, Acidifiers Accelerate
Amino acids were the largest additive type, accounting for 20.8% of the United States feed additives market share in 2025, driven by protein-reduction programs that lower nitrogen excretion and improve bird and pig growth at today’s high corn prices. Broiler rations now hold lysine at 1.4% to 1.6% of dry matter, with phytase liberating phosphorus, allowing mills to cut expensive dicalcium phosphate. Widespread use across poultry, swine, and dairy ensures year-round volume, making amino acids the anchor product line for every top-five supplier in the United States feed additives market.
Acidifiers are expanding at a 7.0% CAGR, the fastest among all categories, as integrators replace antibiotic growth promoters with buffered blends of propionic and fumaric acids that stabilize gut pH and inhibit Salmonella. Weaned piglet programs report 2-point mortality reductions when organic acids are paired with Bacillus probiotics, a performance lift that justifies the higher inclusion cost. Given these outcomes, acidifiers are on track to claim a double-digit share of the United States feed additives market by 2031, particularly in operations targeting export certification under stricter residue rules.


By Animal: Poultry Anchors the Market While Ruminants Drive Next-Gen Expansion
Poultry was the largest animal type, accounting for 40.9% of the United States feed additives market share in 2025, anchored by broilers raised annually in Georgia, Arkansas, Alabama, and North Carolina. Quick-service restaurant mandates for antibiotic-free chicken push integrators to elevate amino acid density, enzyme use, and pigment dosing. A single-point improvement in feed conversion saves integrated complexes millions of dollars per year, so sensor-guided micro-dosing platforms that adjust lysine, phytase, and acidifier rates every flock cycle are standard capital expenditures. Layer flocks respond in parallel, methionine ceilings increased under Association of American Feed Control Officials guidelines, fortifying eggshell quality in cage-free houses and sustaining steady vitamin D uptake during winter months.
Ruminants are projected to log the fastest 6.6% CAGR through 2031, expanding the United States feed additives market size mainly through dairy methane-reduction mandates and premium milk protein contracts. Rumen-protected methionine, lysine, and choline support higher protein-per-hundredweight yields, keeping amino acid suppliers embedded in every high-producing herd’s nutrient plan. Beef feedlots across Texas and Kansas are adopting chelated trace minerals, such as zinc proteinate, to counter hoof lesions under heat stress, raising trace-mineral volumes by 11% in 2025 alone. Ionophore and beta-agonist use remains widespread, but ractopamine-free programs gain ground as packers chase export market access. As precision bunk-management systems roll out, weight sensors sync to cloud software that tweaks additive inclusion nightly, mirroring swine and poultry trends and cementing data-driven growth for ruminant-focused products in the United States feed additives market.
Geography Analysis
Production nodes in Georgia, Arkansas, Alabama, and North Carolina accounted for a significant share of national feed additive tonnage in 2025, as these states raise more than 8 billion broilers annually. Local mills benefit from proximity to Gulf Coast ports that unload soybean meal from Brazil and amino acids from East Asia, keeping delivered ingredient cost below Midwest benchmarks. Quick-service restaurant commitments to antibiotic-free chicken concentrate demand for acidifiers, enzymes, and pigments in these states, locking Southeast order books well above historical averages in the United States feed additives market.
The Midwest plays a significant role in feed additive consumption, driven by Iowa's hog production and Wisconsin's dairy industry. Precision livestock platforms, which incorporate weight scales and feeder sensors, are widely used in the region. These technologies enable feed mills to adjust lysine, methionine, and phytase levels with near real-time precision. Dairy herds in Wisconsin and Minnesota use rumen-protected methionine to enhance milk protein yields, particularly for Greek yogurt production contracts. Meanwhile, hog finishers in Iowa utilize xylanase to extract energy from high-fiber corn byproducts. The region's strong culture of agronomic experimentation results in additive inclusion rates that exceed national averages, contributing significantly to the United States feed additives market.
Texas, Oklahoma, and Kansas, known for their high concentration of beef production, account for significant purchases of feed additives, primarily vitamins, ionophores, and chelated minerals, which support rumen health in high-grain finishing diets. Feedlots in Texas, with a one-time capacity exceeding 2.7 million head, commonly use monensin and tylosin to improve feed efficiency and reduce the incidence of liver abscesses. Increasing heat-stress incidents have also driven demand for zinc and chromium complexes, which bolster immune resilience. While cattle feeding margins remain cyclical, the scale of the Plains feedlot belt provides a stable foundation for trace-mineral volumes in the United States feed additives market.
Competitive Landscape
The top five players, DSM-Firmenich N.V., Archer Daniels Midland Company, Adisseo SAS (China National Bluestar (Group) Co, Ltd.), Nutreco N.V. (SHV Holdings N.V.), and Land O’ Lakes, Inc., accounted for significant market revenue in 2025. These firms keep expanding their domestic fermentation assets. Evonik Industries AG bought a methionine plant in Mobile, Alabama, in 2024 and integrated it into its NextEnhance precision nutrition suite. Capacity additions shorten lead times for Southeast poultry integrators and insulate both sides from shipping cost spikes.
Mid-tier companies such as Kemin Industries, Inc., Novus International, Inc., and Zinpro Corporation differentiate through technical service bundles. They now embed additive sales inside software that converts sensor data into diet recommendations, raising switching costs and deepening customer loyalty. Kemin Industries, Inc.’s 2025 launch of a direct portal that pairs selenium yeast with somatic cell count diagnostics exemplifies this move toward service-plus-ingredient packages. Niche biotechnology start-ups focus on phytogenic and mycotoxin detoxifier blends, segments where regional crop contamination patterns demand local expertise.
Patent filings for enzymes and probiotics topped 150 at the United States Patent and Trademark Office in 2025, and litigation risk grew with them. A blocking injunction against a new phytase underscores the strategic value of intellectual property portfolios, prompting multinationals to dedicate larger legal budgets. Parallel to court battles, e-commerce is unlocking smallholder and hobby-farm channels; Chewy now carries over 200 livestock probiotics, enabling micro-brands to reach national markets without traditional distributors. Where regulatory compliance and verified colony-forming-unit counts align, these digital storefronts provide incremental growth niches within the United States feed additives market.
United States Feed Additives Industry Leaders
-
DSM-Firmenich N.V.
-
Archer Daniels Midland Company
-
Nutreco N.V. (SHV Holdings N.V.)
-
Land O’ Lakes, Inc.
-
Adisseo SAS (China National Bluestar (Group) Co, Ltd.)
- *Disclaimer: Major Players sorted in no particular order


Recent Industry Developments
- June 2025: DSM-Firmenich N.V. launched GutServ Biotix, a postbiotic solution aimed at enhancing piglet health, resilience, and performance. By improving gut integrity and functionality, GutServ Biotix helps reduce early-life challenges, enabling piglets to grow efficiently and build a strong foundation for healthy development and sustained performance.
- April 2025: Cargill, Incorporated, introduced Biostrong C-Protect, a phytogenic feed additive designed to address the impact of Avian Pathogenic E. coli (APEC) in poultry. By combining a postbiotic (XPC) with phytogenics, the product enhances gut health and immunity, thereby reducing mortality, improving egg production in layers, and decreasing the burden of foodborne pathogens.
- March 2025: Kemin Industries, Inc. introduced PROSIDIUM, a patented feed additive formulated with a proprietary blend of natural ingredients to manage pathogens in animal feed. This solution is designed to combat various pathogens, including Salmonella and viruses, that cause foodborne illness in layers and reduce the burden of foodborne pathogens.


United States Feed Additives Market Report Scope
Feed additives are substances incorporated in feed to enhance feed quality, animal performance, food product characteristics, or environmental outcomes.
The United States feed additives market report is segmented by additive type (acidifiers, amino acids, antibiotics, antioxidants, binders, enzymes, flavors and sweeteners, minerals, mycotoxin detoxifiers, phytogenics, pigments, prebiotics, probiotics, vitamins, and yeast), and by animal (aquaculture, poultry, ruminants, swine, and other animals). The market forecasts are provided in terms of value (USD) and volume (metric tons).
By Additive
| Acidifiers | Fumaric Acid | Lactic Acid |
| Propionic Acid | ||
| Other Acidifiers | ||
| Amino Acids | By Sub Additive | Lysine |
| Methionine | ||
| Threonine | ||
| Tryptophan | ||
| Other Amino Acids | ||
| Antibiotics | By Sub Additive | Bacitracin |
| Penicillins | ||
| Tetracyclines | ||
| Tylosin | ||
| Other Antibiotics | ||
| Antioxidants | By Sub Additive | Butylated Hydroxyanisole (BHA) |
| Butylated Hydroxytoluene (BHT) | ||
| Citric Acid | ||
| Ethoxyquin | ||
| Propyl Gallate | ||
| Tocopherols | ||
| Other Antioxidants | ||
| Binders | By Sub Additive | Natural Binders |
| Synthetic Binders | ||
| Enzymes | By Sub Additive | Carbohydrases |
| Phytases | ||
| Other Enzymes | ||
| Flavors and Sweeteners | By Sub Additive | Flavors |
| Sweeteners | ||
| Minerals | By Sub Additive | Macrominerals |
| Microminerals | ||
| Mycotoxin Detoxifiers | By Sub Additive | Binders |
| Biotransformers | ||
| Phytogenics | By Sub Additive | Essential Oil |
| Herbs and Spices | ||
| Other Phytogenics | ||
| Pigments | By Sub Additive | Carotenoids |
| Curcumin and Spirulina | ||
| Prebiotics | By Sub Additive | Fructo Oligosaccharides |
| Galacto Oligosaccharides | ||
| Inulin | ||
| Lactulose | ||
| Mannan Oligosaccharides | ||
| Xylo Oligosaccharides | ||
| Other Prebiotics | ||
| Probiotics | By Sub Additive | Bifidobacteria |
| Enterococcus | ||
| Lactobacilli | ||
| Pediococcus | ||
| Streptococcus | ||
| Other Probiotics | ||
| Vitamins | By Sub Additive | Vitamin A |
| Vitamin B | ||
| Vitamin C | ||
| Vitamin E | ||
| Other Vitamins | ||
| Yeast | By Sub Additive | Live Yeast |
| Selenium Yeast | ||
| Spent Yeast | ||
| Torula Dried Yeast | ||
| Whey Yeast | ||
| Yeast Derivatives | ||
By Animal
| Aquaculture | Fish |
| Shrimp | |
| Other Aquaculture Species | |
| Poultry | Broiler |
| Layer | |
| Other Poultry Birds | |
| Ruminants | Beef Cattle |
| Dairy Cattle | |
| Other Ruminants | |
| Swine | |
| Other Animals |
| By Additive | Acidifiers | Fumaric Acid | Lactic Acid |
| Propionic Acid | |||
| Other Acidifiers | |||
| Amino Acids | By Sub Additive | Lysine | |
| Methionine | |||
| Threonine | |||
| Tryptophan | |||
| Other Amino Acids | |||
| Antibiotics | By Sub Additive | Bacitracin | |
| Penicillins | |||
| Tetracyclines | |||
| Tylosin | |||
| Other Antibiotics | |||
| Antioxidants | By Sub Additive | Butylated Hydroxyanisole (BHA) | |
| Butylated Hydroxytoluene (BHT) | |||
| Citric Acid | |||
| Ethoxyquin | |||
| Propyl Gallate | |||
| Tocopherols | |||
| Other Antioxidants | |||
| Binders | By Sub Additive | Natural Binders | |
| Synthetic Binders | |||
| Enzymes | By Sub Additive | Carbohydrases | |
| Phytases | |||
| Other Enzymes | |||
| Flavors and Sweeteners | By Sub Additive | Flavors | |
| Sweeteners | |||
| Minerals | By Sub Additive | Macrominerals | |
| Microminerals | |||
| Mycotoxin Detoxifiers | By Sub Additive | Binders | |
| Biotransformers | |||
| Phytogenics | By Sub Additive | Essential Oil | |
| Herbs and Spices | |||
| Other Phytogenics | |||
| Pigments | By Sub Additive | Carotenoids | |
| Curcumin and Spirulina | |||
| Prebiotics | By Sub Additive | Fructo Oligosaccharides | |
| Galacto Oligosaccharides | |||
| Inulin | |||
| Lactulose | |||
| Mannan Oligosaccharides | |||
| Xylo Oligosaccharides | |||
| Other Prebiotics | |||
| Probiotics | By Sub Additive | Bifidobacteria | |
| Enterococcus | |||
| Lactobacilli | |||
| Pediococcus | |||
| Streptococcus | |||
| Other Probiotics | |||
| Vitamins | By Sub Additive | Vitamin A | |
| Vitamin B | |||
| Vitamin C | |||
| Vitamin E | |||
| Other Vitamins | |||
| Yeast | By Sub Additive | Live Yeast | |
| Selenium Yeast | |||
| Spent Yeast | |||
| Torula Dried Yeast | |||
| Whey Yeast | |||
| Yeast Derivatives | |||
| By Animal | Aquaculture | Fish | |
| Shrimp | |||
| Other Aquaculture Species | |||
| Poultry | Broiler | ||
| Layer | |||
| Other Poultry Birds | |||
| Ruminants | Beef Cattle | ||
| Dairy Cattle | |||
| Other Ruminants | |||
| Swine | |||
| Other Animals | |||


Market Definition
- FUNCTIONS - For the study, feed additives are considered to be commercially manufactured products that are used to enhance characteristics such as weight gain, feed conversion ratio, and feed intake when fed in appropriate proportions.
- RESELLERS - Companies engaged in reselling feed additives without value addition have been excluded from the market scope, to avoid double counting.
- END CONSUMERS - Compound feed manufacturers are considered to be end-consumers in the market studied. The scope excludes farmers buying feed additives to be used directly as supplements or premixes.
- INTERNAL COMPANY CONSUMPTION - Companies engaged in the production of compound feed as well as the manufacturing of feed additives are part of the study. However, while estimating the market sizes, the internal consumption of feed additives by such companies has been excluded.
| Keyword | Definition |
|---|---|
| Feed additives | Feed additives are products used in animal nutrition for purposes of improving the quality of feed and the quality of food from animal origin, or to improve the animals’ performance and health. |
| Probiotics | Probiotics are microorganisms introduced into the body for their beneficial qualities. (It maintains or restores beneficial bacteria to the gut). |
| Antibiotics | Antibiotic is a drug that is specifically used to inhibit the growth of bacteria. |
| Prebiotics | A non-digestible food ingredient that promotes the growth of beneficial microorganisms in the intestines. |
| Antioxidants | Antioxidants are compounds that inhibit oxidation, a chemical reaction that produces free radicals. |
| Phytogenics | Phytogenics are a group of natural and non-antibiotic growth promoters derived from herbs, spices, essential oils, and oleoresins. |
| Vitamins | Vitamins are organic compounds, which are required for normal growth and maintenance of the body. |
| Metabolism | A chemical process that occurs within a living organism in order to maintain life. |
| Amino acids | Amino acids are the building blocks of proteins and play an important role in metabolic pathways. |
| Enzymes | Enzyme is a substance that acts as a catalyst to bring about a specific biochemical reaction. |
| Anti-microbial resistance | The ability of a microorganism to resist the effects of an antimicrobial agent. |
| Anti-microbial | Destroying or inhibiting the growth of microorganisms. |
| Osmotic balance | It is a process of maintaining salt and water balance across membranes within the body's fluids. |
| Bacteriocin | Bacteriocins are the toxins produced by bacteria to inhibit the growth of similar or closely related bacterial strains. |
| Biohydrogenation | It is a process that occurs in the rumen of an animal in which bacteria convert unsaturated fatty acids (USFA) to saturated fatty acids (SFA). |
| Oxidative rancidity | It is a reaction of fatty acids with oxygen, which generally causes unpleasant odors in animals. To prevent these, antioxidants were added. |
| Mycotoxicosis | Any condition or disease caused by fungal toxins, mainly due to contamination of animal feed with mycotoxins. |
| Mycotoxins | Mycotoxins are toxin compounds that are naturally produced by certain types of molds (fungi). |
| Feed Probiotics | Microbial feed supplements positively affect gastrointestinal microbial balance. |
| Probiotic yeast | Feed yeast (single-cell fungi) and other fungi used as probiotics. |
| Feed enzymes | They are used to supplement digestive enzymes in an animal’s stomach to break down food. Enzymes also ensure that meat and egg production is improved. |
| Mycotoxin detoxifiers | They are used to prevent fungal growth and to stop any harmful mold from being absorbed in the gut and blood. |
| Feed antibiotics | They are used both for the prevention and treatment of diseases but also for rapid growth and development. |
| Feed antioxidants | They are used to protect the deterioration of other feed nutrients in the feed such as fats, vitamins, pigments, and flavoring agents, thus providing nutrient security to the animals. |
| Feed phytogenics | Phytogenics are natural substances, added to livestock feed to promote growth, aid in digestion, and act as anti-microbial agents. |
| Feed vitamins | They are used to maintain the normal physiological function and normal growth and development of animals. |
| Feed flavors and sweetners | These flavors and sweeteners help to mask tastes and odors during changes in additives or medications and make them ideal for animal diets undergoing transition. |
| Feed acidifiers | Animal feed acidifiers are organic acids incorporated into the feed for nutritional or preservative purposes. Acidifiers enhance congestion and microbiological balance in the alimentary and digestive tracts of livestock. |
| Feed minerals | Feed minerals play an important role in the regular dietary requirements of animal feed. |
| Feed binders | Feed binders are the binding agents used in the manufacture of safe animal feed products. It enhances the taste of food and prolongs the storage period of the feed. |
| Key Terms | Abbreviation |
| LSDV | Lumpy Skin Disease Virus |
| ASF | African Swine Fever |
| GPA | Growth Promoter Antibiotics |
| NSP | Non-Starch Polysaccharides |
| PUFA | Polyunsaturated Fatty Acid |
| Afs | Aflatoxins |
| AGP | Antibiotic Growth Promoters |
| FAO | The Food And Agriculture Organization of the United Nations |
| USDA | The United States Department of Agriculture |


Research Methodology
Mordor Intelligence follows a four-step methodology in all our reports.
- Step-1: IDENTIFY KEY VARIABLES: In order to build a robust forecasting methodology, the variables and factors identified in Step-1 are tested against available historical market numbers. Through an iterative process, the variables required for market forecast are set and the model is built on the basis of these variables.
- Step-2: Build a Market Model: Market-size estimations for the forecast years are in nominal terms. Inflation is not a part of the pricing, and the average selling price (ASP) is kept constant throughout the forecast period.
- Step-3: Validate and Finalize: In this important step, all market numbers, variables and analyst calls are validated through an extensive network of primary research experts from the market studied. The respondents are selected across levels and functions to generate a holistic picture of the market studied.
- Step-4: Research Outputs: Syndicated Reports, Custom Consulting Assignments, Databases & Subscription Platforms


