Beneficial Insects Market Size and Share
Market Overview
| Study Period | 2020 - 2030 |
|---|---|
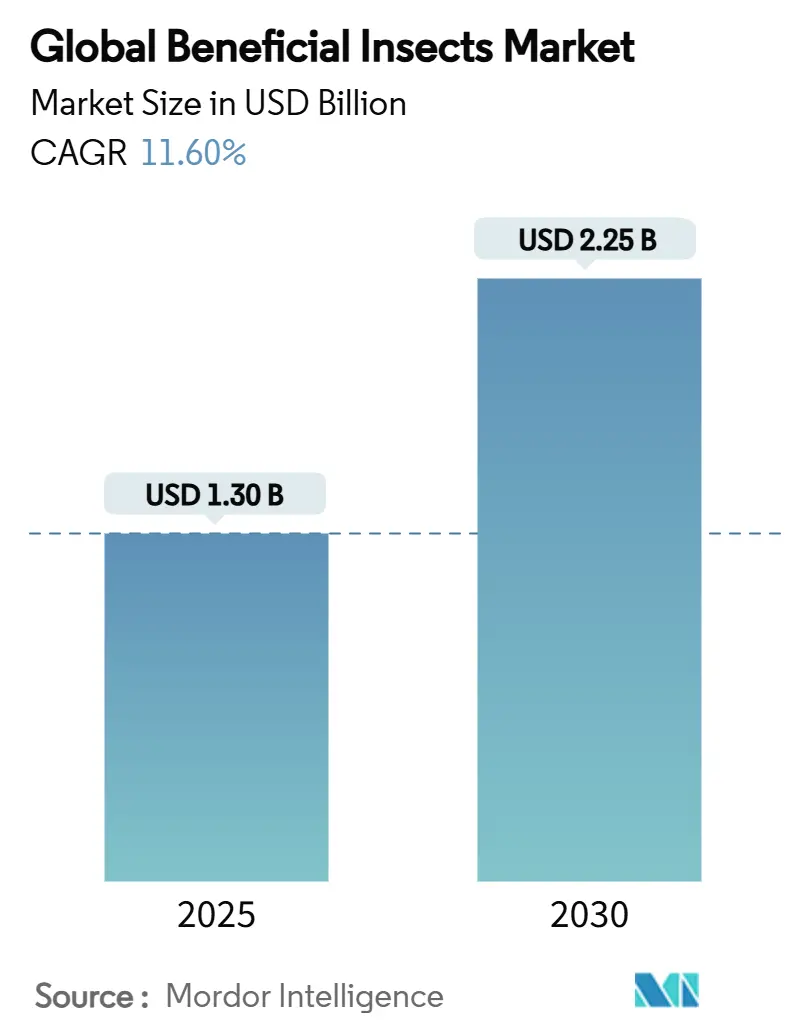
| Market Size (2025) | USD 1.30 Billion |
| Market Size (2030) | USD 2.25 Billion |
| Growth Rate (2025 - 2030) | 11.60% CAGR |
| Fastest Growing Market | Asia Pacific |
| Largest Market | Europe |
| Market Concentration | Medium |
Major Players *Disclaimer: Major Players sorted in no particular order Image © Mordor Intelligence. Reuse requires attribution under CC BY 4.0. | |
Beneficial Insects Market Analysis by Mordor Intelligence
The beneficial insects market size stood at USD 1.30 billion in 2025 and is forecast to reach USD 2.25 billion by 2030, translating into an 11.6% CAGR through the period. Growth momentum is rooted in stricter residue regulations, retailer mandates for chemical-free produce, and rapid advances in mass-rearing automation that have lowered unit costs. Europe retains primacy because its Green Deal policies force farmers to halve synthetic pesticide use, while Asia-Pacific leads incremental demand, owing to sizeable savings of USD 20.1 billion to USD 26.8 billion each year, realized through nationwide biological control programs. Breakthroughs such as commercial pollinator flies further accelerate adoption by providing both pest suppression and pollination services in high-value crops. At the same time, the market benefits from mounting venture-capital inflows that fund automated insect breeding lines and cold-chain packaging, thereby addressing scalability constraints.
Key Report Takeaways
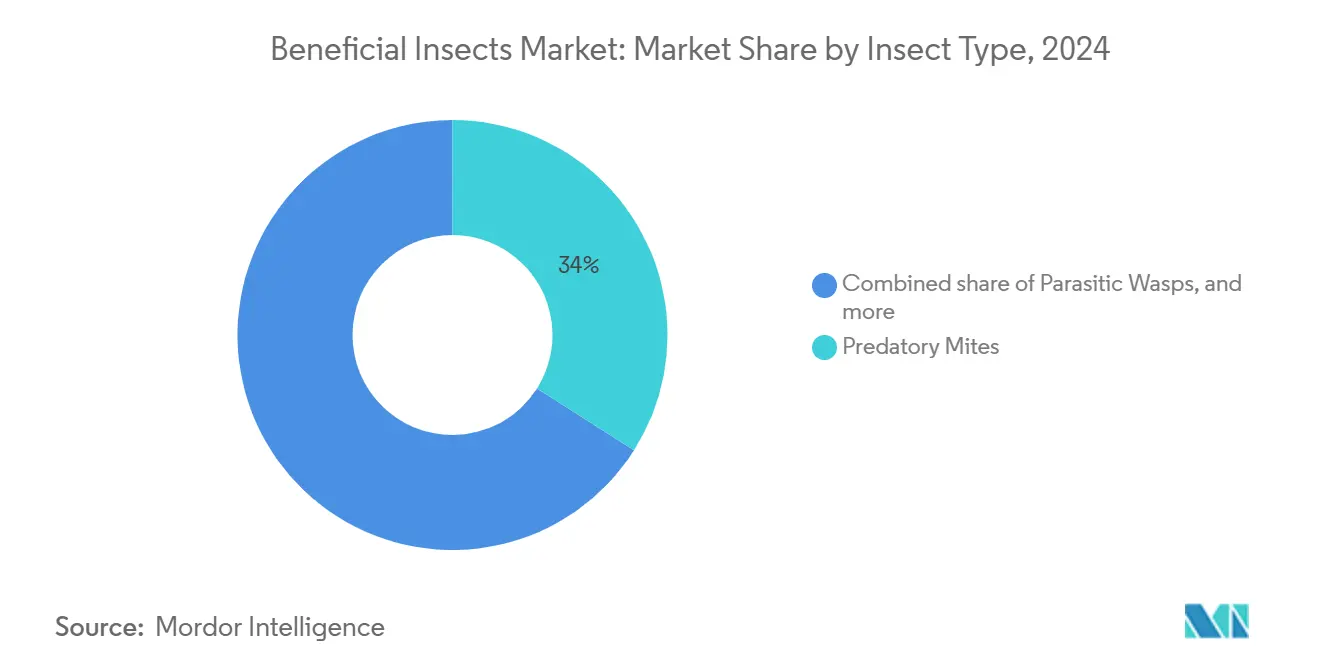
- By insect type, predatory mites led with 34.0% revenue share in 2024, and fly pollinators are projected to expand at an 11.2% CAGR through 2030.
- By application, greenhouse and protected cultivation systems commanded 38.2% of the beneficial insects market share in 2024, while the same segment is advancing at a 9.5% CAGR through 2030.
- By crop type, vegetables accounted for 40.5% of the beneficial insects market size in 2024, fruits and berries exhibit the fastest growth at 9.2% CAGR to 2030.
- By geography, Europe held the largest regional slice of 32.0% in 2024, whereas Asia-Pacific is forecast to post the highest 9.4% CAGR through 2030.
- By distribution channel, direct-to-grower transactions accounted for 62.0% of the market size in 2024, while e-commerce grows swiftly with a CAGR of 11.5% during the forecast period.
- Koppert Biological Systems and Biobest Group jointly controlled a significant share of global revenue in 2024, underscoring the moderately consolidated structure.
Global Beneficial Insects Market Trends and Insights
Drivers Impact Analysis*
| Driver | (~) % Impact on CAGR Forecast | Geographic Relevance | Impact Timeline |
|---|---|---|---|
| Surging adoption of biological crop-protection programs by large agribusinesses | +2.1% | Global, highest in Asia-Pacific and North America | Medium term (2-4 years) |
| Mandatory pesticide-residue limits in major export destinations | +1.8% | Europe and Asia-Pacific, spill-over to North America | Short term (≤ 2 years) |
| Rapid greenhouse acreage expansion in protected cultivation | +1.5% | Asia-Pacific and North America, moderate in Europe | Medium term (2-4 years) |
| Venture-capital inflow into insect mass-rearing automation | +1.2% | North America and Europe, emerging in Asia-Pacific | Long term (≥ 4 years) |
| Commercialization of pollinator flies for high-value fruit crops | +0.9% | Global, early uptake in Europe and North America | Medium term (2-4 years) |
| Carbon-credit premiums for farms using in-situ biocontrol agents | +0.6% | Europe and North America, pilots in Asia-Pacific | Long term (≥ 4 years) |
| Source: Mordor Intelligence | |||
Surging Adoption of Biological Crop-Protection Programs by Large Agribusinesses
Retail chains now specify residue-free benchmarks that multinational growers cannot ignore, prompting large agribusinesses to integrate beneficial insects into standard spray programs. Brazil's bio-inputs market, now valued at USD 1 billion, has witnessed explosive growth in recent years. Analysts forecast this momentum to persist, with an annual growth rate of 20% [1]Source: Ministry of Agriculture, Fisheries, Food Security and Nature, “Brazil's Bio-Input Boom and the Dutch Innovation Mission of November 2024,” agroberichtenbuitenland.nl. Soybean growers alone represent 55% of biological inputs deployed, confirming acceptance in broad-acre production. Field data show that combining parasitoid releases with selective chemicals maintains yields while lowering synthetic loads, satisfying exporter audits. Multinational suppliers strengthen their reach by partnering with local specialists. For instance, FMC Corporation’s September 2024 distribution accord with Ballagro Agro Tecnologia Ltda indicates this trend [2]Source: FMC Corporation, “FMC signs distribution deal with Ballagro,” fmc.com. Widespread corporate commitments to regenerative farming render the driver structurally durable over the forecast horizon.
Mandatory Pesticide-Residue Limits in Major Export Destinations
Stricter maximum residue limits in the European Union and aligned Asian economies create competitive advantages for growers who can document minimal chemical residues. Commission Regulation (EU) No 284/2013 requires full dossiers on non-target effects, making chemical approvals costlier and slower [3]Source: European Commission, “Commission Regulation (EU) No 284/2013,” europa.eu. Biological options, by contrast, are exempt from many residue studies and swiftly gain labels. Parallel moves by the United States Environmental Protection Agency to grant tolerance exemptions for Beauveria bassiana and several Bacillus strains in 2024 remove the hurdle of establishing residue tolerances [4]Source: Environmental Protection Agency, “Microbial pesticide tolerance exemptions,” epa.gov. Collectively, these mandates steer procurement budgets toward living biocontrol agents, especially for exporters of berries, leafy greens, and herbs, where residue audits remain rigorous.
Rapid Greenhouse Acreage Expansion in Protected Cultivation
Controlled-environment agriculture is scaling quickly as investors target year-round output and land-use efficiency. Greenhouses offer stable temperatures and exclusion barriers, conditions that magnify the efficacy of predatory mites and parasitoids. Research on tomato, melon, and strawberry systems recorded 54% to 99% aphid suppression plus measurable pollination benefits delivered by hoverflies [5]Source: Frontiers in Plant Science, “Hoverflies as dual pest control and pollinator agents,” frontiersin.org. Responding to rising demand, Biobest opened a green-energy predatory mite facility in April 2024 to raise production volumes and cut carbon footprints [6]Source: Biobest Group, “Opening of green-energy predatory mite facility,” biobestgroup.com . As controlled-environment hectares expand, particularly in China’s Yangtze Delta, India’s Maharashtra state, and Mexico’s Bajío corridor, orders for beneficial insects track the same curve.
Commercialization of Pollinator Flies for High-Value Fruit Crops
Hoverfly pollinators now serve as insurance against dwindling bee colonies, especially in avocado, blueberry, and greenhouse tomato operations. Globally, hoverflies contribute USD 300 billion to USD 400 billion in pollination value and visit 72% of food crops according to Royal Society Publishing [7]Source: Proceedings of the Royal Society B, “Global economic value of hoverfly pollination,” royalsocietypublishing.org. In the United Kingdom, syrphine hoverflies lifted strawberry yields by more than 70%, generating USD 109 million in market value. Orchard trials in California show random fly movement among cultivars boosts cross-pollination compared with hive-based bees, leading to uniform fruit sets. The dual pest-predation and pollination capability enhances return on investment, supporting rapid segment growth within the overall beneficial insects market.
Restraints Impact Analysis*
| Restraint | (~) % Impact on CAGR Forecast | Geographic Relevance | Impact Timeline |
|---|---|---|---|
| Short product shelf-life and cold-chain logistics gaps | -1.4% | Global, highest in Asia-Pacific and Africa | Short term (≤ 2 years) |
| Declining native lady beetle populations due to invasive species | -0.8% | North America and Europe, emerging in Asia-Pacific | Medium term (2-4 years) |
| High labor intensity versus chemical sprays in broad-acre crops | -0.6% | Global, pronounced in developing regions | Medium term (2-4 years) |
| Regulatory uncertainty for cross-border shipments of live insects | -0.4% | Global, strong effect on trade | Short term (≤ 2 years) |
| Source: Mordor Intelligence | |||
Short Product Shelf-Life and Cold-Chain Logistics Gaps
Beneficial insects remain biologically fragile, and survival rates drop sharply outside the 8 °C to 12 °C window. Studies on temperature-stabilizing materials confirm that maintaining 10 °C during transit is critical, yet many emerging markets lack refrigerated depots [8]Source: Journal of the American Mosquito Control Association, “Thermal stabilization for live insect shipments,” mosquito.org. USDA shipping-container trials recommend dual-compartment designs that use natural refrigerants to mitigate thermal spikes [9]Source: USDA Agricultural Research Service, “Designing cold-chain containers for arthropods,” ars.usda.gov. Mortality above 20% erodes grower confidence and triggers re-application costs, limiting penetration in tropical distribution chains. As the beneficial insects market expands into South Asia and West Africa, logistics deficiencies continue to dampen growth forecasts.
Declining Native Lady Beetle Populations Due to Invasive Species
Non-native Coccinellidae outcompete indigenous predators and erode ecosystem stability. Surveys across the Great Lakes region show a marked decline in native species richness since the arrival of Harmonia axyridis, undermining natural aphid suppression [10]Source: Cornell University Agricultural Experiment Station, “Invasive lady beetles displace natives,” cals.cornell.edu. Commercial breeders can fill the void, but maintaining genetic diversity during mass rearing is complex and raises production costs. Conservation concerns also limit the large-scale release of exotic strains in sensitive ecosystems, constraining a quarter of the beneficial insects market that relies on lady beetles.
*Our forecasts treat driver/restraint impacts as directional, not additive. The impact forecasts reflect baseline growth, mix effects, and variable interactions.
Segment Analysis
By Insect Type: Predatory Mites Consolidate Leadership
Predatory mites generated 34% of global revenue in 2024, giving them the clearest advantage within the beneficial insects market. Their success rests on broad prey ranges that cover thrips, spider mites, and whiteflies, pests that plague both greenhouse tomatoes and outdoor strawberries. The ability to function across humidity bands increases usable acreage. Fly pollinators stand out as the fastest-advancing cohort at an 11.2% CAGR to 2030. Growers value their dual capacity to pollinate and prey on soft-bodied insects, making them cost-efficient in high-margin fruit orchards. The beneficial insects market size attributed to parasitic wasps is significant, which is projected to maintain momentum as seed corn producers scale parasitoid release programs alongside pheromone lures.
Parasitic wasps thrive on host specificity that minimizes off-target risks, a trait now embedded in European registration dossiers to expedite approvals. Lady beetles retain a sturdy position, yet their commercial future depends on mitigating genetic bottlenecks and lifting rearing survival past 85%. Lacewing segment is propelled by demand from hydroponic lettuce growers who prize their capacity to suppress thrips inside closed tunnels. The “Others” category, which includes minute pirate bugs, assassin bugs, and nematode-carrying insects, serves as a pipeline for new product launches that broaden the beneficial insects market.


By Application: Greenhouses Drive Precision Deployment
Greenhouse and protected-cultivation systems absorbed 38.2% of total demand in 2024, while the same segment is advancing at a 9.5% CAGR through 2030, as glass and polyethylene structures enable microclimate control and exclude pesticide drift. The beneficial insects market size for greenhouse users is projected to expand further, supported by subsidies in the Netherlands and tax incentives in Gujarat for modern horticulture. Controlled environments permit timed releases that synchronize predator ratios with pest phenology, increasing biological control efficacy. Open-field remains important for soybean and maize sectors, and the collaboration with aerial-application firms seeks to bridge labor gaps.
Stored-product protection commands a smaller yet strategic share, securing post-harvest commodity value by curbing weevil and moth infestations in grain silos. Here, parasitoids introduced into hermetic storage cut fumigant use and qualify exporters for organic labels. Despite scale limitations, success stories in sugarcane warehouses demonstrate near-parity benefit-cost ratios against chemical fumigation. Innovation around sensor-linked release systems promises further efficiency as cloud-based dashboards alert managers to hotspot pest pressures.
By Distribution Channel: Direct Sales Dominate but E-Commerce Accelerates
Direct-to-grower transactions accounted for 62% of the global beneficial insects market size in 2024 because growers desire detailed scouting, release-rate calculations, and post-deployment audits from suppliers. Dedicated agronomists visit farms to calibrate predator ratios, a service now bundled into contract pricing.
Specialized distributors bridge gaps in markets where growers operate multiple smaller plots, these intermediaries maintain cold-room hubs and provide next-day delivery. E-commerce, while still nascent, grows swiftly with a CAGR of 11.5% during the forecast period as insulated packaging and phase-change coolants preserve insect vitality during 48-hour delivery windows.
By Crop Type: Vegetables Maintain Prime Position
Vegetables captured 40.5% of revenue in 2024, a leadership reflecting the willingness of supermarket buyers to pay premiums for zero-residue labels on bell peppers, cucumbers, and baby greens. Integration of predatory mites with banker plant systems under high-humidity glasshouses has raised marketable yields while cutting pesticide applications by half. Fruits and berries lead the growth table at 9.2% CAGR, fueled by hoverfly and bumblebee shortages that render fly pollinators advantageous. Notably, the beneficial insects market share within strawberries is expanding as packers enforce draconian residue cut-off levels for export consignments.
Grains and cereals remain conservative adopters due to large acreage and lower unit margins, yet specialty seed producers in the United States and France have begun outsourcing parasitoid release services to secure non-GMO certifications. Oilseeds and pulses add diversity, using Trichogramma and Orius species to manage pod borers in chickpea fields. Ornamental flowers and turf, though niche, command premium price tags that justify bespoke insect shipments for golf-course grass and cut-rose greenhouses, ensuring steady revenue for high-margin suppliers.

Geography Analysis
Europe controlled the largest slice of 32% in the global beneficial insects market in 2024, anchored by the European Green Deal target to halve synthetic pesticide dependence by 2030 and by stringent maximum residue limits that reward biological alternatives. Commission Regulation (EU) No 284/2013 embeds environmental safety assessments for non-target insects, effectively prioritizing living biocontrol solutions [11]Source: European Commission, “Authorization of mealworm powder as novel food,” europa.eu . Germany and the Netherlands deploy advanced greenhouse clusters equipped with climate computers that fine-tune humidity, enabling precise predator introduction. France and the United Kingdom augment scale through region-wide distribution cooperatives, while Poland and Romania offer future demand corridors as Common Agricultural Policy funds encourage integrated pest management. Novel-food authorization of UV-treated mealworm powder in January 2025 underscores Europe’s receptivity to insect-based inputs.
Asia-Pacific is growing faster, with a CAGR of 9.4% driven by the initiatives and trends in the respective countries. China’s Ministry of Agriculture allocates subsidies for parasitoid cards in rice paddies, effectively linking biological control to national food-security goals. India’s greenhouse acreage under polyhouse structures grows in double digits, generating consistent demand for predatory mites that tackle thrips and whiteflies. In Southeast Asia, ASEAN’s harmonized guidelines promise smoother cross-border trade in beneficial species, helping Indonesian papaya and Philippine banana growers access regionally bred parasitoids. Japan and South Korea push the technology frontier through LED-based insect behavior studies that allow night-time releases, while Australia channels research grants into pollinator fly domestication for avocado orchards.
North America's market is driven by EPA tolerance exemptions that remove residue hurdles for a growing list of microbial and insecticidal organisms. California berry growers shift toward hoverfly releases as pollinator insurance, and Canadian greenhouse pepper exporters embrace predatory wasps to protect European market access. Mexico aligns with its northern neighbors, leveraging the United States' expertise to bolster its domestic tomato and bell pepper industries. South America is also projected to grow with a CAGR of 8.5% during the forecast period, ranking the second-fastest region in the market. South America’s growth rests chiefly on Brazil, where the bio-input market swelled to USD 5.5 billion in 2023, powered by regulatory fast-tracks and aerial application pilots. The Middle East and Africa display growth paths, respectively, yet face hurdles in refrigerated logistics and inconsistent permitting, delaying full capture of the beneficial insects market potential.


Competitive Landscape
The beneficial insects market exhibits moderate concentration, with the five largest companies garnering 56.5% of global sales. Koppert Biological Systems BV leads the market, underpinned by extensive R&D pipelines and vertically integrated breeding complexes in the Netherlands and Mexico. Biobest Group NV bolsters its capacity through its green-energy predatory mite plant, which was opened in 2024, and by absorbing the Brazilian biologicals firm Biotrop after a USD 75 million cash infusion from M&G Investments. Together, the duo commands one-third of the worldwide market, a scale that secures preferred supplier status with multinational produce groups.
Chemical crop-protection majors increasingly acquire or partner with biocontrol specialists to hedge against tightening pesticide rules. Syngenta Group occupied a significant share with its integrated pest management (IPM) portfolio. BASF SE continues to expand its native beneficial insect portfolio by licensing production strains from universities and start-ups. The strategic emphasis lies on datasets that quantify return on investment so that growers can benchmark biological programs against conventional sprays.
Innovation clusters around automation and aerial application. Koppert’s partnership with Embraer validates biofuel-powered fixed-wing aircraft for predator dispersal over maize and cotton systems, a breakthrough intended to trim labor overhead and open large-scale acreage previously off limits to manual release. Technology upstarts pursue genetic engineering and sensor analytics and CRISPR-bred lines claim longer shelf life, while blockchain-enabled traceability reassures regulators regarding species authenticity. Venture capital sustains experimentation, but the path to regulatory clearance remains disciplined, favoring incumbents with robust compliance infrastructures.
Beneficial Insects Industry Leaders
Certis Biologicals
BASF SE
Syngenta Group
Biobest Group NV
Koppert Biological Systems BV
- *Disclaimer: Major Players sorted in no particular order

Recent Industry Developments
- April 2024: Biobest Group (now BioFirst Group) opened a new 4,000 m² predatory mite production facility in Westerlo, Belgium. The facility can accommodate up to 50 staff members and utilizes advanced mass-rearing techniques to enhance production. The facility incorporates renewable energy systems, including heat pumps, air-handling units, and solar panels that generate approximately 416 MWh annually. These systems reduce CO₂ emissions by 44 metric tons per year, thereby strengthening Biobest's global pest-control operations.
- July 2023: Biobest has completed its acquisition of BioWorks, Inc., a biopesticide manufacturer and marketer based in Victor, NY. The acquisition strengthens Biobest's biopesticide portfolio and increases its manufacturing capabilities in North America. The Victor facility now functions as Biobest's North American center for development, production, and distribution operations.


Global Beneficial Insects Market Report Scope
| Predatory Mites |
| Parasitic Wasps |
| Lady Beetles |
| Lacewings |
| Fly Pollinators (e.g., Syrphidae) |
| Others (Minute Pirate Bugs, Assassin Bugs, etc.) |
| Greenhouse/Protected Cultivation |
| Open-Field Farming |
| Stored-Product Protection |
| Vegetables |
| Fruits and Berries |
| Grains and Cereals |
| Oilseeds and Pulses |
| Ornamentals and Turf |
| Others |
| Direct to Grower |
| Specialized Biocontrol Distributors |
| E-Commerce Platforms |
| North America | United States |
| Canada | |
| Mexico | |
| Rest of North America | |
| South America | Brazil |
| Argentina | |
| Rest of South America | |
| Europe | Germany |
| France | |
| United Kingdom | |
| Italy | |
| Spain | |
| Russia | |
| Rest of Europe | |
| Asia-Pacific | China |
| India | |
| Japan | |
| Australia and New Zealand | |
| South Korea | |
| Rest of Asia-Pacific | |
| Middle East | Saudi Arabia |
| United Arab Emirates | |
| Rest of Middle East | |
| Africa | South Africa |
| Kenya | |
| Rest of Africa |
| By Insect Type | Predatory Mites | |
| Parasitic Wasps | ||
| Lady Beetles | ||
| Lacewings | ||
| Fly Pollinators (e.g., Syrphidae) | ||
| Others (Minute Pirate Bugs, Assassin Bugs, etc.) | ||
| By Application | Greenhouse/Protected Cultivation | |
| Open-Field Farming | ||
| Stored-Product Protection | ||
| By Crop Type | Vegetables | |
| Fruits and Berries | ||
| Grains and Cereals | ||
| Oilseeds and Pulses | ||
| Ornamentals and Turf | ||
| Others | ||
| By Distribution Channel | Direct to Grower | |
| Specialized Biocontrol Distributors | ||
| E-Commerce Platforms | ||
| By Geography | North America | United States |
| Canada | ||
| Mexico | ||
| Rest of North America | ||
| South America | Brazil | |
| Argentina | ||
| Rest of South America | ||
| Europe | Germany | |
| France | ||
| United Kingdom | ||
| Italy | ||
| Spain | ||
| Russia | ||
| Rest of Europe | ||
| Asia-Pacific | China | |
| India | ||
| Japan | ||
| Australia and New Zealand | ||
| South Korea | ||
| Rest of Asia-Pacific | ||
| Middle East | Saudi Arabia | |
| United Arab Emirates | ||
| Rest of Middle East | ||
| Africa | South Africa | |
| Kenya | ||
| Rest of Africa | ||


Key Questions Answered in the Report
What is the current size and projected growth of the beneficial insects market?
The market is valued at USD 1.30 billion in 2025 and is projected to reach USD 2.25 billion by 2030, posting an 11.6% CAGR driven by tighter residue rules and advances in mass-rearing automation.
Which insect type commands the largest revenue share?
Predatory mites lead with 34% of global revenue in 2024 because they control multiple pests across greenhouse and open-field systems.
Why is Asia-Pacific the fastest-growing region?
State-backed biological control programs that save growers USD 20.1 billion to USD 26.8 billion a year, coupled with rapid greenhouse expansion, propel the market through 2030.
How do greenhouse and protected-cultivation systems influence demand?
These controlled environments captured 38.2% of demand in 2024 and are advancing at a 9.5% CAGR because stable microclimates maximize predator efficiency and reduce chemical drift.
Page last updated on:


