Asia Pacific Insecticide Market Size and Share
Market Overview
| Study Period | 2018 - 2031 |
|---|---|
| Forecast Data Period | 2026 - 2031 |
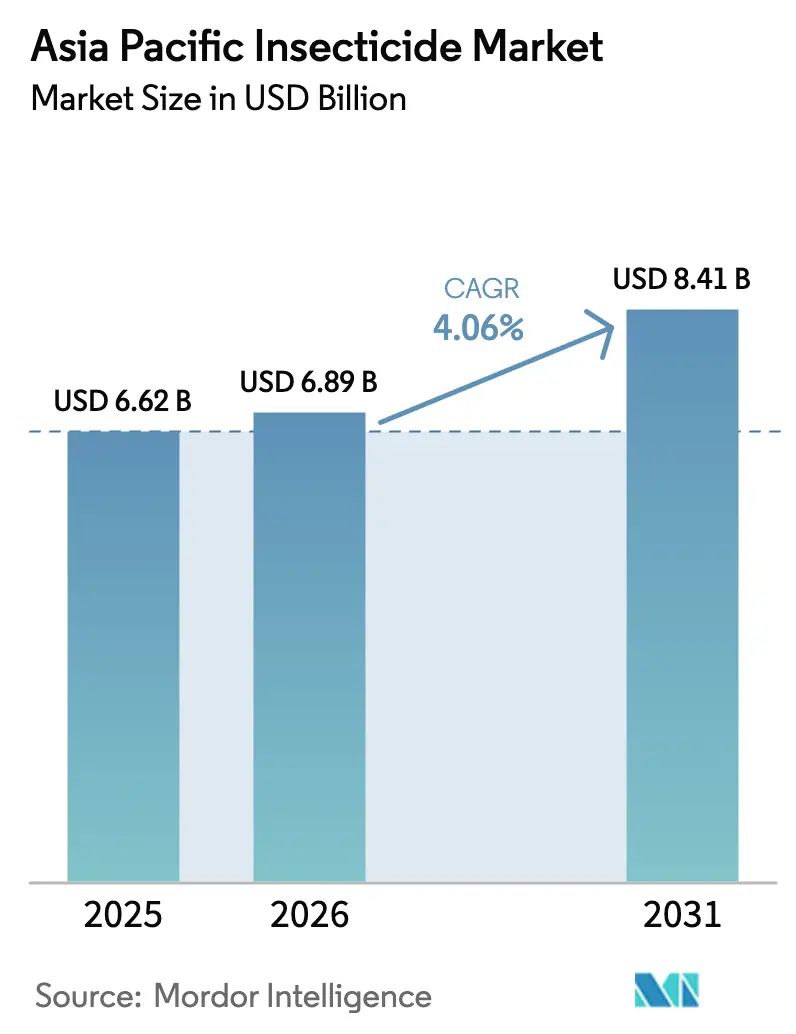
| Base Year Market Size (2025) | USD 6.62 Billion |
| Market Size (2026) | USD 6.89 Billion |
| Market Size (2031) | USD 8.41 Billion |
| Growth Rate (2026 - 2031) | 4.06% CAGR |
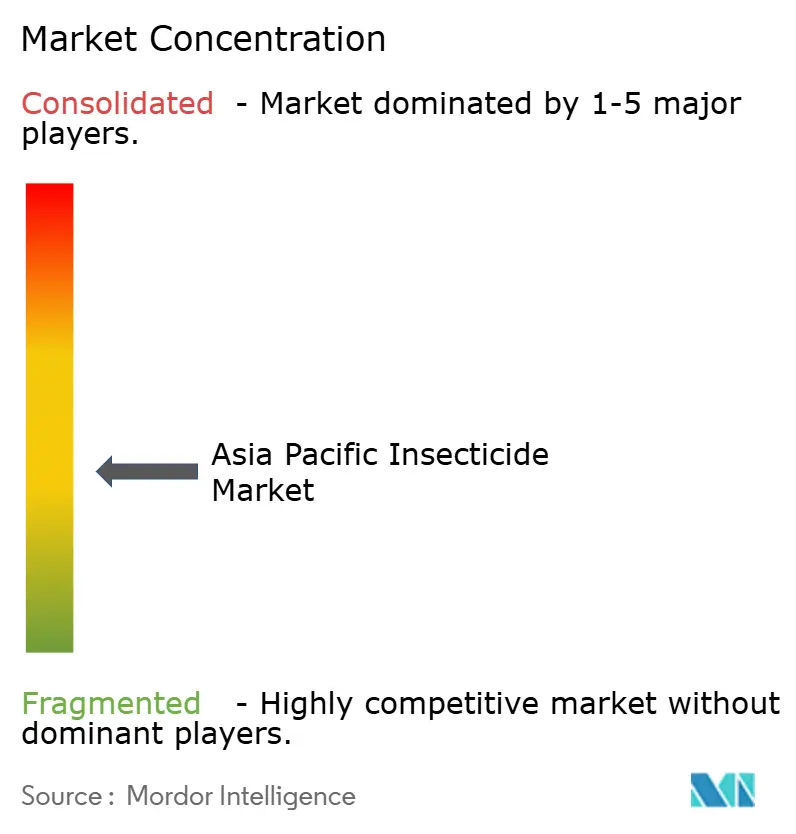
| Market Concentration | Medium |
Major Players *Disclaimer: Major Players sorted in no particular order Image © Mordor Intelligence. Reuse requires attribution under CC BY 4.0. | |
Asia Pacific Insecticide Market Analysis by Mordor Intelligence
The Asia-Pacific insecticide market size is expected to grow from USD 6.62 billion in 2025 to USD 6.89 billion in 2026 and is forecast to reach USD 8.41 billion by 2031 at 4.06% CAGR over 2026-2031. Rapid crop-area expansion, persistent pressures from fall armyworm and brown planthopper, and fast-track pesticide registrations underpin the steady rise in demand. Farmers are adopting stacked-trait genetically modified (GM) maize and soybean that require compatible chemistries, while stricter maximum residue limit (MRL) enforcement by food importers elevates the need for precise application routines. Digital agro-input platforms and drone-based spraying systems shorten distribution chains and lift service expectations, rewarding suppliers that combine product performance with technical guidance. Meanwhile, resistance to Group-3 pyrethroids pushes growers toward premium diamide and neonicotinoid options, supporting value growth even when overall spray volumes level off.
Key Report Takeaways
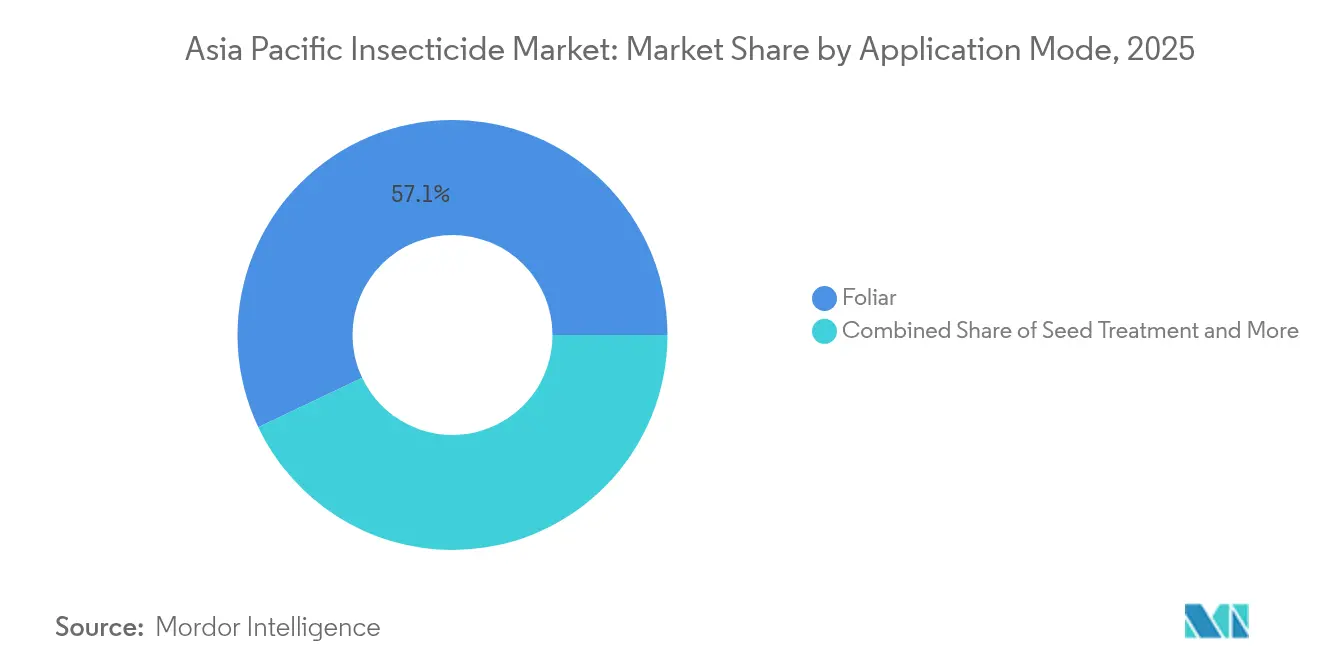
- By application mode, foliar spraying led with 57.05% share of the Asia-Pacific insecticide market in 2025, while seed treatment recorded the fastest 4.35% CAGR through 2031.
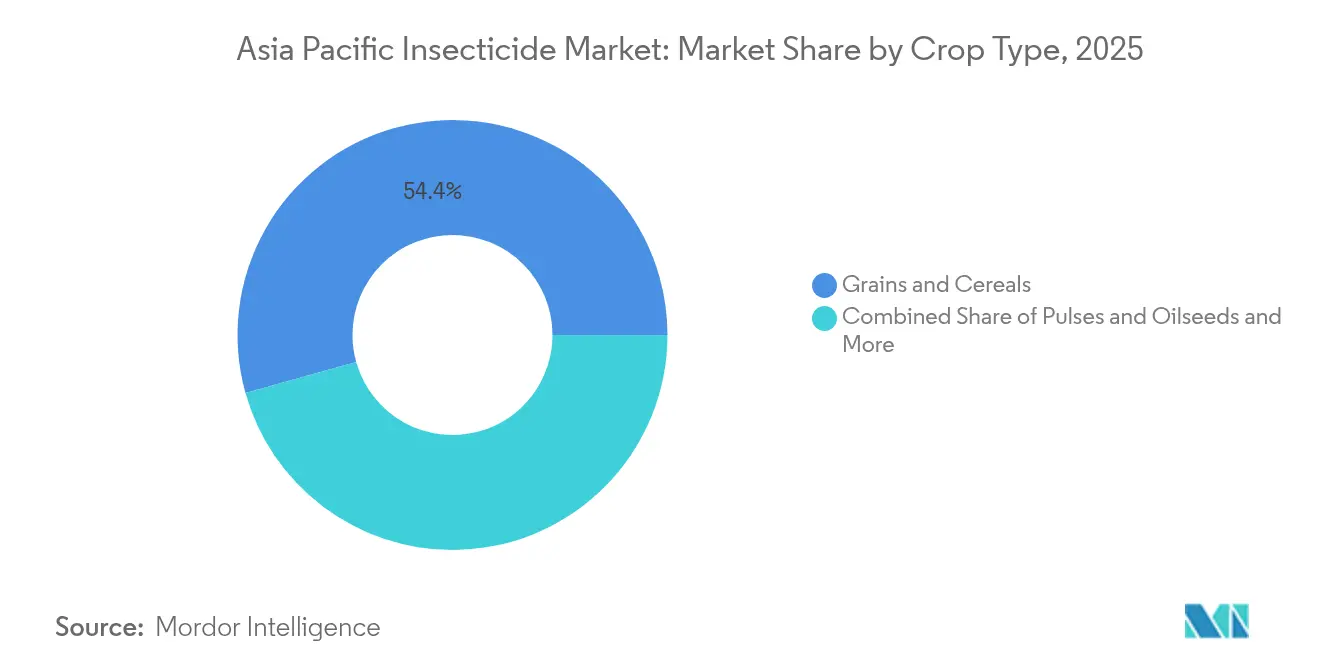
- By crop type, grains and cereals commanded 54.35% revenue share of the Asia-Pacific insecticide market size in 2025 and fruits and vegetables are projected to expand at a 4.42% CAGR to 2031.
- By country, India held 27.62% of the Asia-Pacific insecticide market share in 2025 and China is set to post the highest 5.52% CAGR through 2031.
Note: Market size and forecast figures in this report are generated using Mordor Intelligence’s proprietary estimation framework, updated with the latest available data and insights as of 2026.
Asia Pacific Insecticide Market Trends and Insights
Drivers Impact Analysis*
| Driver | (~) % Impact on CAGR Forecast | Geographic Relevance | Impact Timeline |
|---|---|---|---|
| Surge in fall armyworm outbreaks | +0.8% | India, China, Thailand, and Vietnam | Medium term (2-4 years) |
| Growing adoption of stacked-trait GM crops | +0.6% | China, Philippines, and Indonesia | Long term (≥ 4 years) |
| Fast-track pesticide registrations | +0.5% | ASEAN, India, and Australia | Short term (≤ 2 years) |
| Expansion of e-commerce agro-input platforms | +0.4% | China, India, and Indonesia | Medium term (2-4 years) |
| AI-enabled precision-spraying drones | +0.3% | Japan, Australia, and China | Long term (≥ 4 years) |
| Pivot toward biorational and chemical combo products | +0.4% | Japan, Australia, and New Zealand | Medium term (2-4 years) |
| Source: Mordor Intelligence | |||
Surge in fall armyworm outbreaks boosts targeted demand
China has reported annual fall armyworm-related losses above USD 2.5 billion since 2024, while Vietnam confirmed pest presence in 58 of 63 provinces during the same period.[1]Source: Vietnam Ministry of Agriculture and Rural Development, “Fall Armyworm Management Guidelines,” mard.gov.vn Farmers gravitate toward chlorantraniliprole and emamectin benzoate that offer rapid knockdown with minimal non-target impact. Emergency procurement programs in Thailand and India prioritize suppliers with verified efficacy data, moving market preference away from broad-spectrum organophosphates and toward premium diamides that command higher per-hectare spending.
Growing adoption of stacked-trait GM crops transforms spray protocols
China cleared stacked-trait maize and soybean varieties for commercial planting in 2024, prompting new guidelines that limit exposure of beneficial arthropods and encourage narrower spray windows. The Philippines expects golden rice approvals in the near term, and Indonesia continues pilot releases, together creating fresh demand for insecticides that complement Bt traits by controlling secondary pests without disrupting natural predators.
Fast-track registrations accelerate market entry
ASEAN regulators have cut average approval time from 36 months to 18 months, halving the wait for novel actives. India’s Central Insecticides Board grants 12-month accelerated pathways for low-risk products.[2]Source: Central Insecticides Board, “Pesticide Registration Guidelines 2024,” cibrc.nic.in Australia's Australian Pesticides and Veterinary Medicines Authority has streamlined minor use permits, facilitating specialized crop protection solutions that previously faced regulatory barriers, particularly benefiting niche market segments requiring targeted pest control options.
Expansion of E-Commerce Agro-Inputs Platforms Transforms Distribution Channels
Digital agricultural input platforms have captured approximately 15 percent of insecticide distribution in China and India by 2025, driven by rural internet penetration and smartphone adoption among farming communities. Alibaba's Taobao Rural initiative reported 280 percent growth in pesticide sales through 2024, while India's AgroStar platform expanded to serve over 1.2 million farmers across 15 states. Indonesia's TaniHub and Thailand's Innotech Precision Agriculture have established direct-to-farmer delivery networks that bypass traditional distributor margins, creating pricing pressure on conventional channels.
Restraints Impact Analysis*
| Restraint | (~) % Impact on CAGR Forecast | Geographic Relevance | Impact Timeline |
|---|---|---|---|
| Stricter MRL enforcement by food importers | -0.7% | Thailand, Vietnam, India, and China | Short term (≤ 2 years) |
| Rising resistance to Group-3 pyrethroids | -0.5% | India, China, Thailand, Vietnam, and Myanmar | Medium term (2-4 years) |
| Labor shortages for ground application | -0.3% | Japan, South Korea, and Australia | Long term (≥ 4 years) |
| ESG-driven divestment from synthetic actives | -0.2% | Australia and Japan | Long term (≥ 4 years) |
| Source: Mordor Intelligence | |||
Stricter MRL Enforcement by Asian Food Importers Constrains
Maximum residue limit enforcement has intensified across major Asian food importing nations, with Japan implementing enhanced testing protocols for 847 pesticide compounds in 2024. Taiwan's Food and Drug Administration expanded MRL monitoring to include metabolites and degradation products, effectively restricting available chemistry options for export-oriented producers. Malaysia's stricter enforcement of Codex Alimentarius standards has resulted in increased rejection rates for imported agricultural products, prompting upstream supply chain adjustments in pesticide selection and application timing.
Rising Resistance to Group-3 Pyrethroids Limits Chemistry Options
Pyrethroid resistance has reached critical levels across Asia-Pacific rice production systems, with diamondback moth populations in China showing over 90 percent survival rates to standard application rates of cypermethrin and deltamethrin. India's cotton belt reports similar resistance patterns in bollworm complexes, forcing growers toward alternative chemistry classes that command premium pricing. Thailand's Department of Agriculture documented pyrethroid resistance in 78 percent of tested brown planthopper populations, prompting official recommendations for chemistry rotation protocols.
*Our forecasts treat driver/restraint impacts as directional, not additive. The impact forecasts reflect baseline growth, mix effects, and variable interactions.
Segment Analysis
By Application Mode: Foliar Applications Lead Despite Seed Treatment Innovation
Foliar application maintains market leadership with 57.05% share in 2025, reflecting farmers' preference for immediate pest control responses and visual confirmation of treatment coverage. This dominance stems from the application method's flexibility in addressing outbreak situations, particularly during fall armyworm invasions that require rapid intervention protocols. Seed treatment emerges as the fastest-growing segment at 4.35% CAGR through 2031, driven by integrated pest management adoption and preventive control strategies that reduce overall chemical inputs while maintaining yield protection standards.
Chemigation systems gain traction in Australia's cotton regions and China's precision agriculture zones, where infrastructure investments support fertigation compatibility and automated delivery systems. Soil treatment applications concentrate in high-value crop segments including fruits and vegetables, where root zone protection justifies premium pricing for specialized formulations. Fumigation remains niche but stable, primarily serving stored grain facilities and greenhouse operations requiring comprehensive pest elimination protocols. The shift toward preventive application methods, particularly seed treatment, reflects regulatory preferences for reduced environmental exposure and farmer adoption of sustainable intensification practices that optimize input efficiency while maintaining commercial viability.


By Crop Type: Grains Drive Volume While Fruits Command Premium Pricing
Grains and cereals command the largest market share at 54.35% in 2025, correlating with Asia-Pacific's food security priorities and extensive cultivation areas requiring consistent pest management protocols. Rice production across India, China, Thailand, and Vietnam drives significant insecticide consumption, particularly for brown planthopper and stem borer control that threatens yield stability. Fruits and vegetables represent the fastest-growing segment at 4.42% CAGR through 2031, supported by export market expansion and premium pricing that justifies advanced pest management investments.
Commercial crops, including cotton and sugarcane, maintain steady demand patterns despite fluctuating commodity prices, with India's cotton belt and Australia's sugar regions providing consistent volume consumption. Pulses and oilseeds benefit from government promotion programs across India and Myanmar, where crop diversification initiatives support expanded cultivation areas requiring specialized pest control solutions. Turf and ornamental applications remain concentrated in developed markets including Japan and Australia, where aesthetic quality standards drive premium product adoption. The historical CAGR comparison reveals fruits and vegetables segment acceleration from 3.8% during 2019-2024 to the projected 4.42% through 2031, indicating sustained premiumization trends that reward innovation and quality differentiation over commodity competition.
Geography Analysis
India maintains the largest country market share at 27.62% in 2025, supported by extensive agricultural land area and intensive cropping systems requiring consistent pest management inputs. Government procurement of fall armyworm specific diamides stabilizes continuity of supply. Rising GDP in rural areas lifts willingness to pay for premium brands that promise higher yields. East Asia, spearheaded by China demonstrates the fastest projected growth at 5.52% CAGR through 2031, driven by agricultural modernization initiatives, GM crop adoption, and precision agriculture technology integration that favors premium product segments. Investments in smart agriculture encourage adoption of drone-ready formulations and cloud-based advisory platforms.
Southeast Asian markets demonstrate varied growth patterns, with Thailand and Vietnam benefiting from export agriculture expansion that demands compliance with international residue standards. Adoption of weather-linked spray advisories lowers residue breaches, and vendors capable of providing actionable data gain farmer loyalty. Indonesia’s palm oil estates face whitefly and bagworm infestations year-round, favoring long-residual actives that lower labor rounds. The Philippines expects golden rice approval by mid-decade, prompting pesticide companies to align formulations with trait packages. Australia’s grain belt invests in variable-rate booms and satellite pest scouting that trim input waste. The country also pioneers stewardship for new diamide chemistry approved in 2024, setting protocols that neighboring markets replicate. New Zealand and Pacific islands remain small but strictly regulate active ingredients, steering demand toward lower-toxicity biologicals. Across the region, harmonized ASEAN guidelines cut regulatory duplication and widen the runway for multinational launches. Yet localized agro-ecological conditions and linguistic diversity keep after-sales service pivotal. Suppliers blend broad regulatory strategies with country-specific extension programs to capture both scale and local trust.
Competitive Landscape
The Asia-Pacific insecticide market shows moderate fragmentation, with the top five suppliers holding roughly 42% combined share. Syngenta Group deepened Southeast Asian reach through the acquisition of PT Biotech Nusantara, securing local fermentation capacity for biorational actives. Bayer allocates significant investment for AI-driven monitoring that pairs imagery with variable-rate applicators, a move aimed at lowering per-acre dosage without compromising control. FMC introduced a next-generation diamide across China, India, Thailand, and Vietnam, leveraging expanded Indian production to assure supply during peak demand. Corteva joined forces with Sumitomo Chemical to co-develop hybrid products against pyrethroid resistant pests, bolstering rice market access. BASF achieved the first new mode of action registration in Australia in recent years, winning early adopter support among cotton growers seeking resistance rotation.
Regional firms also flex capabilities. UPL Limited bought a Vietnamese distribution network touching a large number of farmers to sidestep intermediaries. Nufarm earned ISO 14001 certification for Thai and Malaysian plants, reinforcing ESG credentials that resonate with advanced markets like Japan. Digital disruptors such as Jiangsu Yangnong Chemical and Rainbow Agro deploy advisory apps that match symptom photos with treatment plans, nudging the market toward solutions-as-a-service. Competitive leverage increasingly rests not just on molecule novelty but on bundled support that helps farmers navigate compliance, resistance, and labor constraints.
Asia Pacific Insecticide Industry Leaders
Corteva Agriscience
FMC Corporation
Syngenta Group
UPL Limited
Nufarm
- *Disclaimer: Major Players sorted in no particular order

Recent Industry Developments
- October 2025: BASF and Nissan Chemical have collaborated to introduce Prexio Active, an insecticide designed to address major rice pests in Japan. The product features a new mode of action aimed at controlling resistant insect populations and enhancing rice yields. This partnership reinforces BASF's position in the Asia-Pacific crop protection market, particularly within the high-value rice segment.
- August 2025: Insecticides India Limited (IIL) has partnered with Corteva Agriscience to launch a new broad-spectrum insecticide named SPARCLE for rice farmers in India. The product uses advanced chemistry from Corteva and IIL's extensive market reach to combat the brown plant hopper (BPH) pest, aiming to improve rice yield, quality, and farmer profitability.
- May 2024: BASF has introduced a new insecticide, Cimegra, in Australia to address resistant pests in Brassica vegetables. Featuring the novel active ingredient Broflanilide, it provides rapid action, extended residual control, and no known cross-resistance. This launch enhances sustainable pest management practices and broadens BASF’s crop protection portfolio in the Asia-Pacific region.


Asia Pacific Insecticide Market Report Scope
Chemigation, Foliar, Fumigation, Seed Treatment, Soil Treatment are covered as segments by Application Mode. Commercial Crops, Fruits & Vegetables, Grains & Cereals, Pulses & Oilseeds, Turf & Ornamental are covered as segments by Crop Type. Australia, China, India, Indonesia, Japan, Myanmar, Pakistan, Philippines, Thailand, Vietnam are covered as segments by Country.| Chemigation |
| Foliar |
| Fumigation |
| Seed Treatment |
| Soil Treatment |
| Commercial Crops |
| Fruits and Vegetables |
| Grains and Cereals |
| Pulses and Oilseeds |
| Turf and Ornamental |
| Australia |
| China |
| India |
| Indonesia |
| Japan |
| Myanmar |
| Pakistan |
| Philippines |
| Thailand |
| Vietnam |
| Rest of Asia-Pacific |
| Application Mode | Chemigation |
| Foliar | |
| Fumigation | |
| Seed Treatment | |
| Soil Treatment | |
| Crop Type | Commercial Crops |
| Fruits and Vegetables | |
| Grains and Cereals | |
| Pulses and Oilseeds | |
| Turf and Ornamental | |
| Country | Australia |
| China | |
| India | |
| Indonesia | |
| Japan | |
| Myanmar | |
| Pakistan | |
| Philippines | |
| Thailand | |
| Vietnam | |
| Rest of Asia-Pacific |


Market Definition
- Function - Insecticides are chemicals used to control or prevent insects from damaging the crop and prevent yield loss.
- Application Mode - Foliar, Seed Treatment, Soil Treatment, Chemigation, and Fumigation are the different type of application modes through which crop protection chemicals are applied to the crops.
- Crop Type - This represents the consumption of crop protection chemicals by Cereals, Pulses, Oilseeds, Fruits, Vegetables, Turf, and Ornamental crops.
| Keyword | Definition |
|---|---|
| IWM | Integrated weed management (IWM) is an approach to incorporate multiple weed control techniques throughout the growing season to give producers the best opportunity to control problematic weeds. |
| Host | Hosts are the plants that form relationships with beneficial microorganisms and help them colonize. |
| Pathogen | A disease-causing organism. |
| Herbigation | Herbigation is an effective method of applying herbicides through irrigation systems. |
| Maximum residue levels (MRL) | Maximum Residue Limit (MRL) is the maximum allowed limit of pesticide residue in food or feed obtained from plants and animals. |
| IoT | The Internet of Things (IoT) is a network of interconnected devices that connect and exchange data with other IoT devices and the cloud. |
| Herbicide-tolerant varieties (HTVs) | Herbicide-tolerant varieties are plant species that have been genetically engineered to be resistant to herbicides used on crops. |
| Chemigation | Chemigation is a method of applying pesticides to crops through an irrigation system. |
| Crop Protection | Crop protection is a method of protecting crop yields from different pests, including insects, weeds, plant diseases, and others that cause damage to agricultural crops. |
| Seed Treatment | Seed treatment helps to disinfect seeds or seedlings from seed-borne or soil-borne pests. Crop protection chemicals, such as fungicides, insecticides, or nematicides, are commonly used for seed treatment. |
| Fumigation | Fumigation is the application of crop protection chemicals in gaseous form to control pests. |
| Bait | A bait is a food or other material used to lure a pest and kill it through various methods, including poisoning. |
| Contact Fungicide | Contact pesticides prevent crop contamination and combat fungal pathogens. They act on pests (fungi) only when they come in contact with the pests. |
| Systemic Fungicide | A systemic fungicide is a compound taken up by a plant and then translocated within the plant, thus protecting the plant from attack by pathogens. |
| Mass Drug Administration (MDA) | Mass drug administration is the strategy to control or eliminate many neglected tropical diseases. |
| Mollusks | Mollusks are pests that feed on crops, causing crop damage and yield loss. Mollusks include octopi, squid, snails, and slugs. |
| Pre-emergence Herbicide | Preemergence herbicides are a form of chemical weed control that prevents germinated weed seedlings from becoming established. |
| Post-emergence Herbicide | Postemergence herbicides are applied to the agricultural field to control weeds after emergence (germination) of seeds or seedlings. |
| Active Ingredients | Active ingredients are the chemicals in pesticide products that kill, control, or repel pests. |
| United States Department of Agriculture (USDA) | The Department of Agriculture provides leadership on food, agriculture, natural resources, and related issues. |
| Weed Science Society of America (WSSA) | The WSSA, a non-profit professional society, promotes research, education, and extension outreach activities related to weeds. |
| Suspension concentrate | Suspension concentrate (SC) is one of the formulations of crop protection chemicals with solid active ingredients dispersed in water. |
| Wettable powder | A wettable powder (WP) is a powder formulation that forms a suspension when mixed with water prior to spraying. |
| Emulsifiable concentrate | Emulsifiable concentrate (EC) is a concentrated liquid formulation of pesticide that needs to be diluted with water to create a spray solution. |
| Plant-parasitic nematodes | Parasitic Nematodes feed on the roots of crops, causing damage to the roots. These damages allow for easy plant infestation by soil-borne pathogens, which results in crop or yield loss. |
| Australian Weeds Strategy (AWS) | The Australian Weeds Strategy, owned by the Environment and Invasives Committee, provides national guidance on weed management. |
| Weed Science Society of Japan (WSSJ) | WSSJ aims to contribute to the prevention of weed damage and the utilization of weed value by providing the chance for research presentation and information exchange. |


Research Methodology
Mordor Intelligence follows a four-step methodology in all our reports.
- Step-1: Identify Key Variables: In order to build a robust forecasting methodology, the variables and factors identified in Step-1 are tested against available historical market numbers. Through an iterative process, the variables required for market forecast are set and the model is built on the basis of these variables.
- Step-2: Build a Market Model: Market-size estimations for the forecast years are in nominal terms. Inflation is not a part of the pricing, and the average selling price (ASP) is kept constant throughout the forecast period.
- Step-3: Validate and Finalize: In this important step, all market numbers, variables and analyst calls are validated through an extensive network of primary research experts from the market studied. The respondents are selected across levels and functions to generate a holistic picture of the market studied.
- Step-4: Research Outputs: Syndicated Reports, Custom Consulting Assignments, Databases & Subscription Platforms


