Molluscs Market Size and Share
Molluscs Market Analysis by Mordor Intelligence
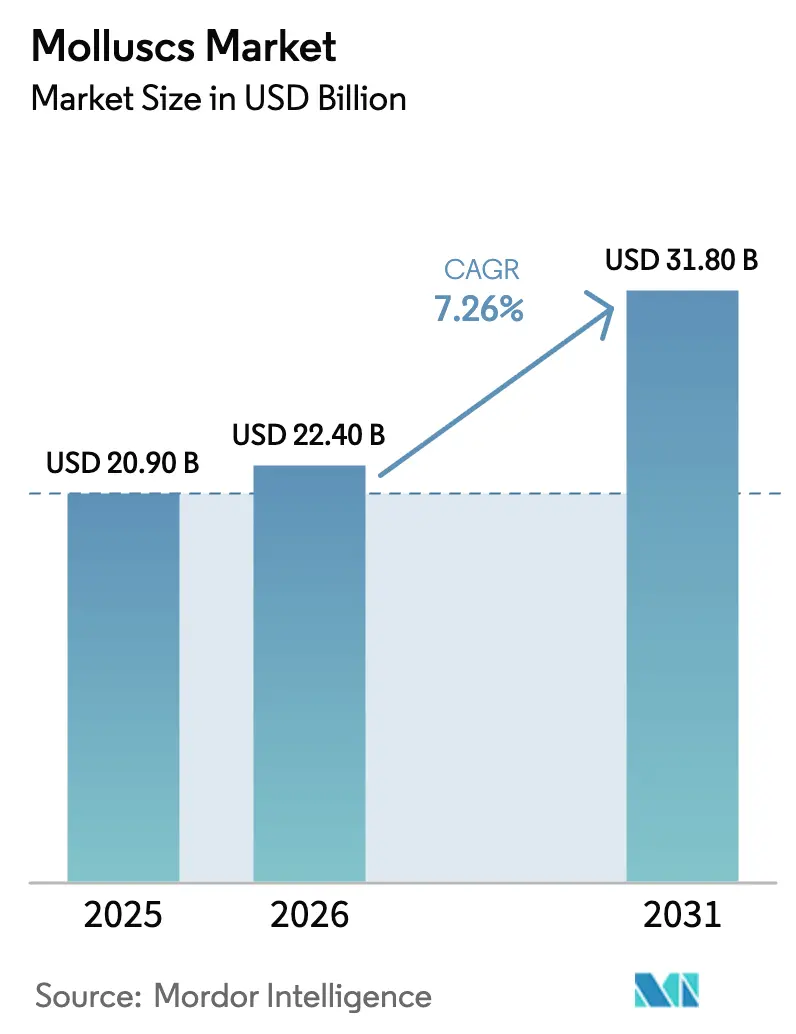
The Molluscs market size is projected to expand from USD 20.90 billion in 2025 to USD 22.40 billion in 2026 and reach USD 31.80 billion by 2031, registering a CAGR of 7.26% between 2026 and 2031. Rising consumer preference for low-carbon proteins, the roll-out of integrated multi-trophic aquaculture, and growing retail demand for sustainability-labeled seafood are steering steady volume gains across the molluscs market. Oysters retained the largest individual share in 2025, yet scallops are accelerating on the back of triploid genetics that deliver up to 35% higher yields, which is changing farm-gate economics in Asia-Pacific and North America. Long-line raft culture dominated production methods during 2025, while nutrient-credit incentives tied to integrated systems are prompting farmers in Europe and China to pivot toward multi-species sites. Together, these shifts continue to widen the revenue base of the molluscs market by attracting institutional investors and public subsidy programs.
Key Report Takeaways
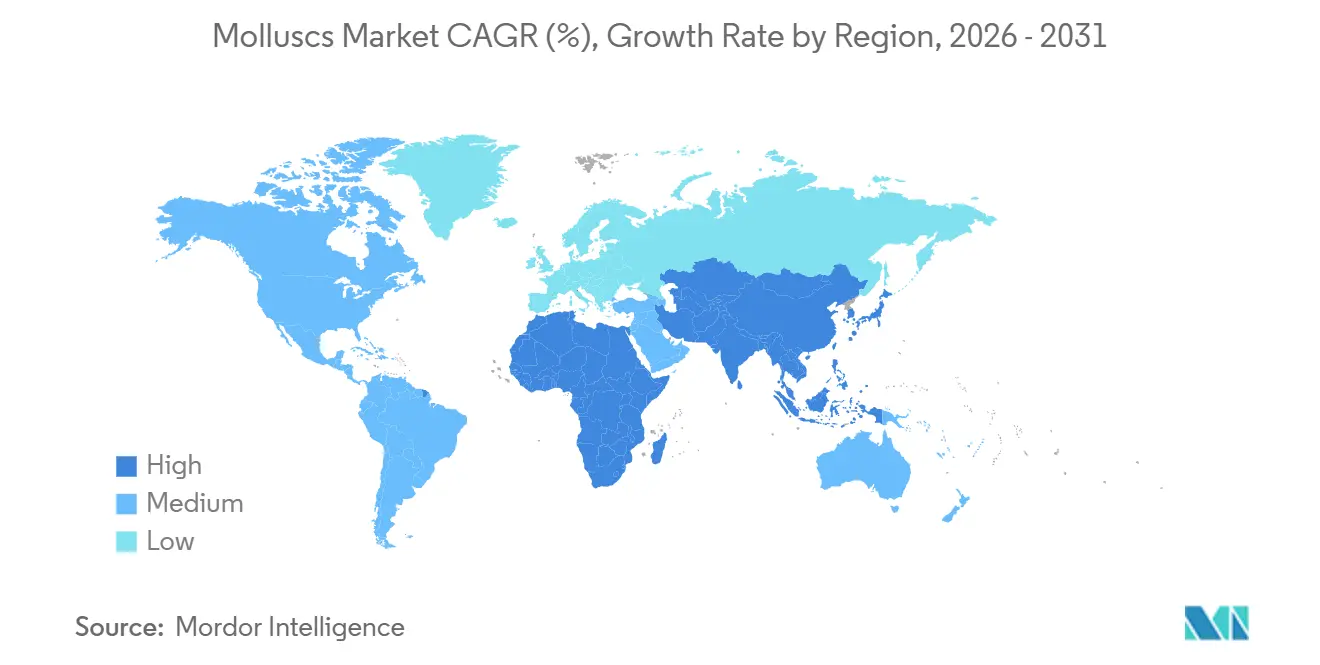
- By geography, the Asia-Pacific region accounted for 63.4% of the Molluscs market size in 2025, while Africa is the fastest-growing region, with an 8.3% CAGR through 2031.
Note: Market size and forecast figures in this report are generated using Mordor Intelligence’s proprietary estimation framework, updated with the latest available data and insights as of January 2026.
Global Molluscs Market Trends and Insights
Drivers Impact Analysis*
| Driver | (~) % Impact on CAGR Forecast | Geographic Relevance | Impact Timeline |
|---|---|---|---|
| Escalating global demand for sustainable high-protein seafood | +1.8% | Global, with the strongest uptake in North America and Europe | Medium term (2-4 years) |
| Government subsidy programs for mollusc aquaculture | +1.5% | Asia-Pacific core, spill-over to Africa and South America | Short term (≤ 2 years) |
| Advances in triploid hatchery technology raising yields | +1.3% | North America, Asia-Pacific, Oceania | Medium term (2-4 years) |
| Emergence of integrated multi-trophic aquaculture models | +1.1% | Europe, Asia-Pacific, and North America coastal zones | Long term (≥ 4 years) |
| Northward shift of suitable farming zones due to warming seas | +0.9% | North America, Europe, and Russia's high-latitude coasts | Long term (≥ 4 years) |
| Rapid growth of premium oyster bar chains in urban centers | +0.8% | North America, Europe, Asia-Pacific tier-1 cities | Short term (≤ 2 years) |
| Source: Mordor Intelligence | |||
Escalating Global Demand for Sustainable High-Protein Seafood
Bivalves require no external feed, release minimal greenhouse gases, and actively filter coastal water, which positions them as the most climate-efficient animal protein. A 2025 analysis by the World Resources Institute found that mussel production emits only 0.3 kilograms of carbon dioxide equivalent per kilogram of meat compared with 27 kilograms for beef [1]Source: World Resources Institute, “Sustainable Protein Scorecard: Environmental Footprints of Animal Proteins,” WRI, wri.org. European retailers such as Tesco launched eco-labeled oyster packs in 2025, boosting shellfish sales by 14% in the United Kingdom, France, and Germany. North American distributors reported that 38% of restaurants added at least one mollusc dish during 2025, up from 22% in 2023, as chefs use sustainability stories to justify premium menu prices. The shift is most pronounced among millennial and Generation Z diners, who consider environmental scores when choosing seafood, creating a sustained increase in demand.
Government Subsidy Programs for Mollusc Aquaculture
China’s Ministry of Agriculture and Rural Affairs allocated CNY 6.8 billion (USD 950 million) to establish scallop and clam seed centers in Shandong and Liaoning, aiming to enhance domestic self-sufficiency[2]Source: Ministry of Agriculture and Rural Affairs of China, “Aquaculture Development Plan 2025-2030,” MOA, moa.gov.cn. These centers are projected to improve the availability of high-quality seeds, reduce reliance on imports, and strengthen the domestic aquaculture industry. The United States Department of Agriculture committed an additional USD 85 million to its Aquaculture Grant Program, prioritizing climate-resilient shellfish initiatives[4]Source: United States Department of Agriculture, “Aquaculture Grant Program Expansion 2025,” USDA, usda.gov. This funding is intended to support research and development, improve farming practices, and enhance the sustainability of shellfish production. In East Africa, the World Bank provided USD 42 million for the development of 12 community hatcheries, projected to benefit 3,500 smallholders by 2027. These hatcheries aim to provide smallholders with access to affordable and quality seeds, fostering local aquaculture development and improving livelihoods. These investments help lower entry barriers, promote technology adoption, and support the growth trajectory of the molluscs market.
Advances in Triploid Hatchery Technology Raising Yields
Triploid oysters and scallops carry a third chromosome set that channels energy away from reproduction into faster somatic growth. University of Maine trials showed meat yields 25% to 35% higher than those of diploid controls, with time-to-market cut by 8 months[5]Source: University of Maine, “Triploid Shellfish Research: Yield and Growth Performance,” UMaine, umaine.edu. Triploid spat accounted for 47% of North American seed sales in 2025, up from 31% two years earlier [3]Source: National Oceanic and Atmospheric Administration, “U.S. Shellfish Aquaculture: Production and Economic Data 2025,” NOAA, noaa.gov. Taylor Shellfish Farms reported a 28% gain in return on invested capital after moving to all-triploid lines that reach harvest size in 16 months. Hatcheries in Japan and Australia are following suit, creating a virtuous cycle that supports higher farm revenue and lowers unit costs.
Emergence of Integrated Multi-Trophic Aquaculture Models
Integrated multi-trophic aquaculture co-cultures finfish, bivalves, and seaweed, allowing shellfish to absorb excess nutrients from fish cages. Norway approved eight commercial licenses in 2025 as operators worked to meet European Union discharge standards. In Canada, Cooke Aquaculture’s 12-hectare pilot showed that mussels removed 22% of the site's phosphorus and generated provincial nutrient credits worth CAD 47,000 (USD 34,600) in the first year. Scotland’s Sea Fish Industry Authority estimates savings of USD 4,100 per hectare each year in compliance costs once mussels offset nitrogen loads. Shandong Province has mandated that all finfish leases larger than five hectares add a bivalve or seaweed component by 2027, creating a locked-in demand stream for shellfish seed.
Restraints Impact Analysis*
| Restraint | (~) % Impact on CAGR Forecast | Geographic Relevance | Impact Timeline |
|---|---|---|---|
| Ocean acidification reducing shell calcification rates | -1.2% | Global, most acute in the Pacific Northwest and the Southern Ocean | Long term (≥ 4 years) |
| Vibrio and Norovirus outbreaks impacting exports | -0.9% | North America, Europe, Asia-Pacific coastal zones | Short term (≤ 2 years) |
| Acute labor shortages in coastal farming hubs | -0.7% | North America, Europe, Oceania | Medium term (2-4 years) |
| Non-tariff trade barriers on live bivalve shipments | -0.5% | Global, particularly intra-Asian and transatlantic corridors | Medium term (2-4 years) |
| Source: Mordor Intelligence | |||
Ocean Acidification Reducing Shell Calcification Rates
Rising atmospheric carbon dioxide is lowering seawater pH and stripping carbonate ions that bivalve larvae need to build shells. The University of Washington recorded 14% weaker calcification and 22% higher mortality for Pacific oyster larvae raised at pH 7.8 versus pH 8.1 in 2025. Oregon and Washington hatcheries now dose sodium carbonate into intake pipes at a cost of up to USD 0.12 per thousand larvae, cutting profit margins by up to 9%. Australian scallop farmers in Tasmania saw an 18% fall in wild spat settlement between 2023 and 2025, prompting a switch to hatchery seed. The Intergovernmental Panel on Climate Change expects ocean pH to fall another 0.1 to 0.15 units by 2040, implying bigger future capital needs for buffering or site relocation.
Vibrio and Norovirus Outbreaks Impacting Exports
Food-borne pathogens remain a critical threat to the live shellfish trade. The United States Centers for Disease Control and Prevention traced 127 Vibrio cases to raw oysters in 2025, triggering temporary harvest bans in three states and USD 34 million in lost sales. The European Food Safety Authority issued rapid alerts on Norovirus-positive mussels from Spain and France, prompting the United Kingdom and Germany to halt imports for 6 weeks. China rejected 14 live clam shipments from South Korea in 2025 due to fecal coliform levels, adding days to port clearance and raising mortality. Each incident forces farms and processors to spend more on depuration, testing, and cold chain to preserve export access.
*Our forecasts treat driver/restraint impacts as directional, not additive. The impact forecasts reflect baseline growth, mix effects, and variable interactions.
Geography Analysis
Asia-Pacific generated 63.4% of global value in 2026, making it the clear production and consumption leader in the molluscs market. Strong domestic demand in China, rising sashimi uptake in Japan, and hatchery upgrades across South Korea explain the region’s scale advantage. Africa is the fastest-growing cluster, advancing at an 8.3% CAGR through 2031 as Kenya, Tanzania, and Mozambique roll out donor-funded raft cooperatives and community hatcheries. These projects deepen rural livelihoods while creating new export capacity for mussels and oysters destined for premium Asian buyers.
North America posted steady volume gains in 2025, driven by premium raw-bar demand and a strong e-commerce channel for half-shell oysters. Europe maintained mature but resilient growth as nutrient-credit incentives pushed farms in Norway and Scotland toward integrated multi-trophic sites that lower environmental footprints. Middle East producers in the United Arab Emirates and Saudi Arabia invested in recirculating systems to meet the luxury hotel demand for live oysters. South America has relied on Chilean mussel exports to Asia and Europe. However, periodic algal blooms in southern waters have underscored supply chain risks, which operators are addressing through the use of early-warning sensors.
Together, these regional trajectories broaden the supplier base of the molluscs market and reduce exposure to single-country shocks. Investment in cold-chain logistics, automated grading, and hatchery genetics is spreading from Asia-Pacific into South America and North Africa, unlocking inland demand and higher farm yields. Governments are layering subsidy programs on top of private capital to accelerate technology transfer and certification adoption, thereby shortening the payback window for new entrants. As infrastructure and biosecurity standards converge, cross-regional trade flows are projected to rise, further expanding total market revenue during the forecast horizon.


Competitive Landscape
The five largest suppliers collectively accounted for the majority share of global revenue in 2025, indicating moderate concentration and room for further consolidation. Most top players are channelling capital into blast-freezers, sensor-driven early-warning systems, and blockchain traceability to meet stricter buyer audits and pathogen regulations. Geographic diversification is another priority, with leading groups adding leases in Africa, South America, and high-latitude North America to hedge climate and regulatory shocks. As technology spreads and compliance costs rise, the combined share of these scaled operators is projected to grow, pushing the molluscs market toward a more integrated, resilient supply model.
Pacific Seafood operates the largest integrated network in the United States, running hatcheries, farms, and automated shucking lines that handle about 12 million oysters each week. Its coast-to-coast reach gives buyers a single source for fresh, frozen, and value-added items, which strengthens contract pricing. Maruha Nichiro Corporation controls extensive scallop leases in Hokkaido and pairs them with a nationwide cold chain that keeps a year-round supply flowing into Japanese retail. Together, these two leaders set benchmark quality and traceability standards that smaller firms must match to secure premium shelf space.
Cooke Aquaculture’s True North Seafood division anchors operations in Atlantic Canada and recently monetized nutrient credits from an integrated multi-trophic aquaculture site, creating a new earnings stream. Zhejiang Ocean Family doubled its scallop spat output in 2025 by commissioning a USD 25 million recirculating hatchery in Zhoushan, which can produce 800 million juveniles a year. Taylor Shellfish Farms advanced a computer-vision grader that processes 18,000 oysters per hour and lifts accuracy to 97%, easing chronic labor gaps. These moves show that scale, genetics, and automation remain the primary tools for widening margins across diverse geographies.
Recent Industry Developments
- January 2026: India’s Ministry of Fisheries, Animal Husbandry and Dairying announced that national fish output doubled to 19.775 million metric tons in fiscal 2024–25, backed by cumulative public investments of INR 38,572 crore (USD 4.6 billion) across flagship schemes such as Pradhan Mantri Matsya Sampada Yojana and Fisheries and Aquaculture Infrastructure Development Fund.
- August 2025: United States senators introduced the bipartisan Marine Aquaculture Research for America Act, which would create a dedicated Office of Aquaculture inside the National Oceanic and Atmospheric Administration, streamline offshore permitting, and unlock grant funding for modern working-waterfront infrastructure and workforce training.
- April 2025: A consortium, operating under the name WAVES (Working towards Adaptive and Versatile Environmental Sustainability), has been awarded a GBP 3 million (USD 3.7 million) grant by United Kingdom Research and Innovation. The funding aims to enhance sustainable mollusc farming in Malaysia, Vietnam, and Indonesia, contributing to food and economic security for communities affected by increasing climate change pressures.


Global Molluscs Market Report Scope
| North America | United States | Production Analysis (Production Volume) |
| Consumption Analysis (Consumption Value and Volume) | ||
| Import Market Analysis (Import Value, Volume, and Key Supplying Markets) | ||
| Export Market Analysis (Export Value, Volume, and Key Destination Markets) | ||
| Wholesale Price Trend Analysis and Forecast | ||
| Regulatory Framework | ||
| List of Key Players | ||
| Logistics and Infrastructure | ||
| Seasonality Analysis | ||
| Canada | Production Analysis (Production Volume) | |
| Consumption Analysis (Consumption Value and Volume) | ||
| Import Market Analysis (Import Value, Volume, and Key Supplying Markets) | ||
| Export Market Analysis (Export Value, Volume, and Key Destination Markets) | ||
| Wholesale Price Trend Analysis and Forecast | ||
| Regulatory Framework | ||
| List of Key Players | ||
| Logistics and Infrastructure | ||
| Seasonality Analysis | ||
| Mexico | Production Analysis (Production Volume) | |
| Consumption Analysis (Consumption Value and Volume) | ||
| Import Market Analysis (Import Value, Volume, and Key Supplying Markets) | ||
| Export Market Analysis (Export Value, Volume, and Key Destination Markets) | ||
| Wholesale Price Trend Analysis and Forecast | ||
| Regulatory Framework | ||
| List of Key Players | ||
| Logistics and Infrastructure | ||
| Seasonality Analysis | ||
| South America | Brazil | Production Analysis (Production Volume) |
| Consumption Analysis (Consumption Value and Volume) | ||
| Import Market Analysis (Import Value, Volume, and Key Supplying Markets) | ||
| Export Market Analysis (Export Value, Volume, and Key Destination Markets) | ||
| Wholesale Price Trend Analysis and Forecast | ||
| Regulatory Framework | ||
| List of Key Players | ||
| Logistics and Infrastructure | ||
| Seasonality Analysis | ||
| Argentina | Production Analysis (Production Volume) | |
| Consumption Analysis (Consumption Value and Volume) | ||
| Import Market Analysis (Import Value, Volume, and Key Supplying Markets) | ||
| Export Market Analysis (Export Value, Volume, and Key Destination Markets) | ||
| Wholesale Price Trend Analysis and Forecast | ||
| Regulatory Framework | ||
| List of Key Players | ||
| Logistics and Infrastructure | ||
| Seasonality Analysis | ||
| Europe | Russia | Production Analysis (Production Volume) |
| Consumption Analysis (Consumption Value and Volume) | ||
| Import Market Analysis (Import Value, Volume, and Key Supplying Markets) | ||
| Export Market Analysis (Export Value, Volume, and Key Destination Markets) | ||
| Wholesale Price Trend Analysis and Forecast | ||
| Regulatory Framework | ||
| List of Key Players | ||
| Logistics and Infrastructure | ||
| Seasonality Analysis | ||
| United Kingdom | Production Analysis (Production Volume) | |
| Consumption Analysis (Consumption Value and Volume) | ||
| Import Market Analysis (Import Value, Volume, and Key Supplying Markets) | ||
| Export Market Analysis (Export Value, Volume, and Key Destination Markets) | ||
| Wholesale Price Trend Analysis and Forecast | ||
| Regulatory Framework | ||
| List of Key Players | ||
| Logistics and Infrastructure | ||
| Seasonality Analysis | ||
| Asia-Pacific | India | Production Analysis (Production Volume) |
| Consumption Analysis (Consumption Value and Volume) | ||
| Import Market Analysis (Import Value, Volume, and Key Supplying Markets) | ||
| Export Market Analysis (Export Value, Volume, and Key Destination Markets) | ||
| Wholesale Price Trend Analysis and Forecast | ||
| Regulatory Framework | ||
| List of Key Players | ||
| Logistics and Infrastructure | ||
| Seasonality Analysis | ||
| China | Production Analysis (Production Volume) | |
| Consumption Analysis (Consumption Value and Volume) | ||
| Import Market Analysis (Import Value, Volume, and Key Supplying Markets) | ||
| Export Market Analysis (Export Value, Volume, and Key Destination Markets) | ||
| Wholesale Price Trend Analysis and Forecast | ||
| Regulatory Framework | ||
| List of Key Players | ||
| Logistics and Infrastructure | ||
| Seasonality Analysis | ||
| Australia | Production Analysis (Production Volume) | |
| Consumption Analysis (Consumption Value and Volume) | ||
| Import Market Analysis (Import Value, Volume, and Key Supplying Markets) | ||
| Export Market Analysis (Export Value, Volume, and Key Destination Markets) | ||
| Wholesale Price Trend Analysis and Forecast | ||
| Regulatory Framework | ||
| List of Key Players | ||
| Logistics and Infrastructure | ||
| Seasonality Analysis | ||
| Middle East | Saudi Arabia | Production Analysis (Production Volume) |
| Consumption Analysis (Consumption Value and Volume) | ||
| Import Market Analysis (Import Value, Volume, and Key Supplying Markets) | ||
| Export Market Analysis (Export Value, Volume, and Key Destination Markets) | ||
| Wholesale Price Trend Analysis and Forecast | ||
| Regulatory Framework | ||
| List of Key Players | ||
| Logistics and Infrastructure | ||
| Seasonality Analysis | ||
| United Arab Emirates | Production Analysis (Production Volume) | |
| Consumption Analysis (Consumption Value and Volume) | ||
| Import Market Analysis (Import Value, Volume, and Key Supplying Markets) | ||
| Export Market Analysis (Export Value, Volume, and Key Destination Markets) | ||
| Wholesale Price Trend Analysis and Forecast | ||
| Regulatory Framework | ||
| List of Key Players | ||
| Logistics and Infrastructure | ||
| Seasonality Analysis | ||
| Africa | Kenya | Production Analysis (Production Volume) |
| Consumption Analysis (Consumption Value and Volume) | ||
| Import Market Analysis (Import Value, Volume, and Key Supplying Markets) | ||
| Export Market Analysis (Export Value, Volume, and Key Destination Markets) | ||
| Wholesale Price Trend Analysis and Forecast | ||
| Regulatory Framework | ||
| List of Key Players | ||
| Logistics and Infrastructure | ||
| Seasonality Analysis | ||
| Tanzania | Production Analysis (Production Volume) | |
| Consumption Analysis (Consumption Value and Volume) | ||
| Import Market Analysis (Import Value, Volume, and Key Supplying Markets) | ||
| Export Market Analysis (Export Value, Volume, and Key Destination Markets) | ||
| Wholesale Price Trend Analysis and Forecast | ||
| Regulatory Framework | ||
| List of Key Players | ||
| Logistics and Infrastructure | ||
| Seasonality Analysis | ||
| By Geography | North America | United States | Production Analysis (Production Volume) |
| Consumption Analysis (Consumption Value and Volume) | |||
| Import Market Analysis (Import Value, Volume, and Key Supplying Markets) | |||
| Export Market Analysis (Export Value, Volume, and Key Destination Markets) | |||
| Wholesale Price Trend Analysis and Forecast | |||
| Regulatory Framework | |||
| List of Key Players | |||
| Logistics and Infrastructure | |||
| Seasonality Analysis | |||
| Canada | Production Analysis (Production Volume) | ||
| Consumption Analysis (Consumption Value and Volume) | |||
| Import Market Analysis (Import Value, Volume, and Key Supplying Markets) | |||
| Export Market Analysis (Export Value, Volume, and Key Destination Markets) | |||
| Wholesale Price Trend Analysis and Forecast | |||
| Regulatory Framework | |||
| List of Key Players | |||
| Logistics and Infrastructure | |||
| Seasonality Analysis | |||
| Mexico | Production Analysis (Production Volume) | ||
| Consumption Analysis (Consumption Value and Volume) | |||
| Import Market Analysis (Import Value, Volume, and Key Supplying Markets) | |||
| Export Market Analysis (Export Value, Volume, and Key Destination Markets) | |||
| Wholesale Price Trend Analysis and Forecast | |||
| Regulatory Framework | |||
| List of Key Players | |||
| Logistics and Infrastructure | |||
| Seasonality Analysis | |||
| South America | Brazil | Production Analysis (Production Volume) | |
| Consumption Analysis (Consumption Value and Volume) | |||
| Import Market Analysis (Import Value, Volume, and Key Supplying Markets) | |||
| Export Market Analysis (Export Value, Volume, and Key Destination Markets) | |||
| Wholesale Price Trend Analysis and Forecast | |||
| Regulatory Framework | |||
| List of Key Players | |||
| Logistics and Infrastructure | |||
| Seasonality Analysis | |||
| Argentina | Production Analysis (Production Volume) | ||
| Consumption Analysis (Consumption Value and Volume) | |||
| Import Market Analysis (Import Value, Volume, and Key Supplying Markets) | |||
| Export Market Analysis (Export Value, Volume, and Key Destination Markets) | |||
| Wholesale Price Trend Analysis and Forecast | |||
| Regulatory Framework | |||
| List of Key Players | |||
| Logistics and Infrastructure | |||
| Seasonality Analysis | |||
| Europe | Russia | Production Analysis (Production Volume) | |
| Consumption Analysis (Consumption Value and Volume) | |||
| Import Market Analysis (Import Value, Volume, and Key Supplying Markets) | |||
| Export Market Analysis (Export Value, Volume, and Key Destination Markets) | |||
| Wholesale Price Trend Analysis and Forecast | |||
| Regulatory Framework | |||
| List of Key Players | |||
| Logistics and Infrastructure | |||
| Seasonality Analysis | |||
| United Kingdom | Production Analysis (Production Volume) | ||
| Consumption Analysis (Consumption Value and Volume) | |||
| Import Market Analysis (Import Value, Volume, and Key Supplying Markets) | |||
| Export Market Analysis (Export Value, Volume, and Key Destination Markets) | |||
| Wholesale Price Trend Analysis and Forecast | |||
| Regulatory Framework | |||
| List of Key Players | |||
| Logistics and Infrastructure | |||
| Seasonality Analysis | |||
| Asia-Pacific | India | Production Analysis (Production Volume) | |
| Consumption Analysis (Consumption Value and Volume) | |||
| Import Market Analysis (Import Value, Volume, and Key Supplying Markets) | |||
| Export Market Analysis (Export Value, Volume, and Key Destination Markets) | |||
| Wholesale Price Trend Analysis and Forecast | |||
| Regulatory Framework | |||
| List of Key Players | |||
| Logistics and Infrastructure | |||
| Seasonality Analysis | |||
| China | Production Analysis (Production Volume) | ||
| Consumption Analysis (Consumption Value and Volume) | |||
| Import Market Analysis (Import Value, Volume, and Key Supplying Markets) | |||
| Export Market Analysis (Export Value, Volume, and Key Destination Markets) | |||
| Wholesale Price Trend Analysis and Forecast | |||
| Regulatory Framework | |||
| List of Key Players | |||
| Logistics and Infrastructure | |||
| Seasonality Analysis | |||
| Australia | Production Analysis (Production Volume) | ||
| Consumption Analysis (Consumption Value and Volume) | |||
| Import Market Analysis (Import Value, Volume, and Key Supplying Markets) | |||
| Export Market Analysis (Export Value, Volume, and Key Destination Markets) | |||
| Wholesale Price Trend Analysis and Forecast | |||
| Regulatory Framework | |||
| List of Key Players | |||
| Logistics and Infrastructure | |||
| Seasonality Analysis | |||
| Middle East | Saudi Arabia | Production Analysis (Production Volume) | |
| Consumption Analysis (Consumption Value and Volume) | |||
| Import Market Analysis (Import Value, Volume, and Key Supplying Markets) | |||
| Export Market Analysis (Export Value, Volume, and Key Destination Markets) | |||
| Wholesale Price Trend Analysis and Forecast | |||
| Regulatory Framework | |||
| List of Key Players | |||
| Logistics and Infrastructure | |||
| Seasonality Analysis | |||
| United Arab Emirates | Production Analysis (Production Volume) | ||
| Consumption Analysis (Consumption Value and Volume) | |||
| Import Market Analysis (Import Value, Volume, and Key Supplying Markets) | |||
| Export Market Analysis (Export Value, Volume, and Key Destination Markets) | |||
| Wholesale Price Trend Analysis and Forecast | |||
| Regulatory Framework | |||
| List of Key Players | |||
| Logistics and Infrastructure | |||
| Seasonality Analysis | |||
| Africa | Kenya | Production Analysis (Production Volume) | |
| Consumption Analysis (Consumption Value and Volume) | |||
| Import Market Analysis (Import Value, Volume, and Key Supplying Markets) | |||
| Export Market Analysis (Export Value, Volume, and Key Destination Markets) | |||
| Wholesale Price Trend Analysis and Forecast | |||
| Regulatory Framework | |||
| List of Key Players | |||
| Logistics and Infrastructure | |||
| Seasonality Analysis | |||
| Tanzania | Production Analysis (Production Volume) | ||
| Consumption Analysis (Consumption Value and Volume) | |||
| Import Market Analysis (Import Value, Volume, and Key Supplying Markets) | |||
| Export Market Analysis (Export Value, Volume, and Key Destination Markets) | |||
| Wholesale Price Trend Analysis and Forecast | |||
| Regulatory Framework | |||
| List of Key Players | |||
| Logistics and Infrastructure | |||
| Seasonality Analysis | |||


Key Questions Answered in the Report
How large is the global Molluscs market in 2026 and where is it headed by 2031?
It was valued at USD 22.4 billion in 2026 and is projected to reach USD 31.8 billion by 2031, reflecting a 7.26% CAGR.
Why is Asia-Pacific so dominant in production value?
China's large-scale clam, scallop and oyster farms plus strong domestic demand drive 63.4% of global value as of 2026.
What technology trends are producers adopting to offset labor shortages?
Farms are installing machine-vision graders, sensor-based mortality alerts and blockchain traceability to improve efficiency and compliance.
How are integrated multi-trophic aquaculture sites changing farm economics?
They let operators earn nutrient-remediation credits and co-produce finfish, shellfish and seaweed, which diversifies revenue and cuts discharge fees.
What recent policy action in the United States could expand offshore production?
The bipartisan Marine Aquaculture Research for America Act proposes a dedicated National Oceanic and Atmospheric Administration (NOAA) office and streamlined permits to accelerate open-ocean farming.
Page last updated on:


