Insecticide Market Size and Share
Market Overview
| Study Period | 2018 - 2031 |
|---|---|
| Market Size (2026) | USD 39.7 Billion |
| Market Size (2031) | USD 47.34 Billion |
| Growth Rate (2026 - 2031) | 3.57% CAGR |
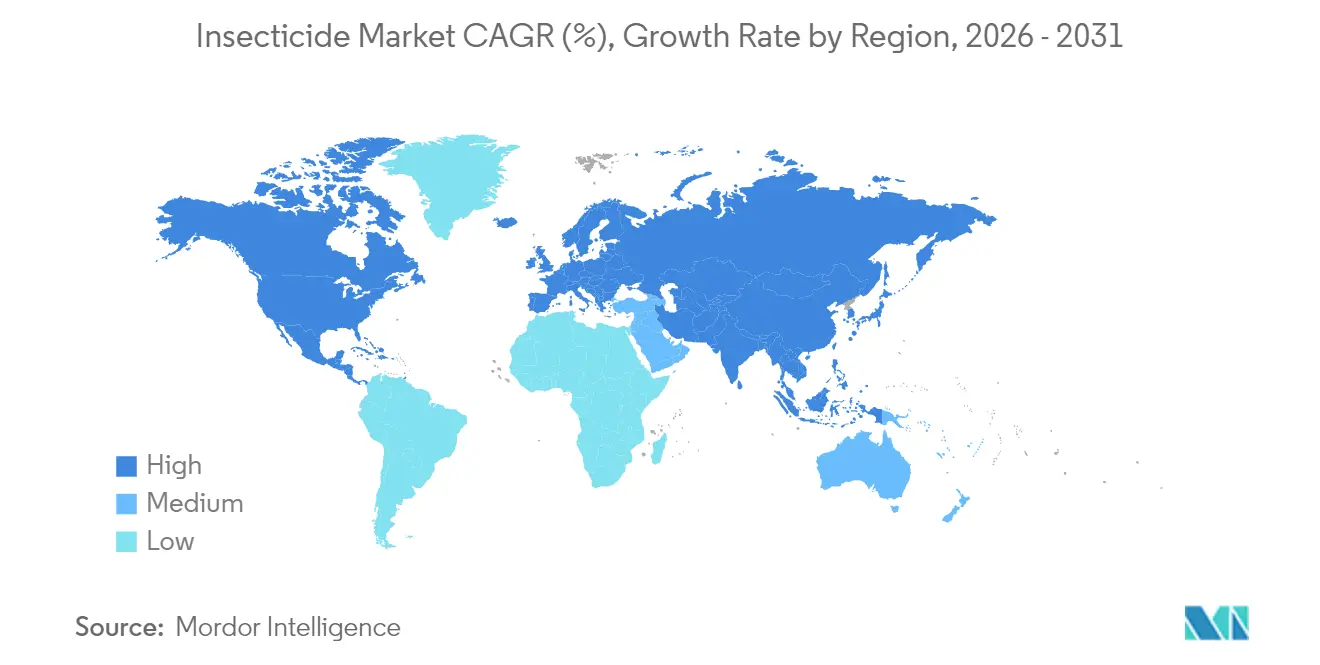
| Fastest Growing Market | Asia Pacific |
| Largest Market | North America |
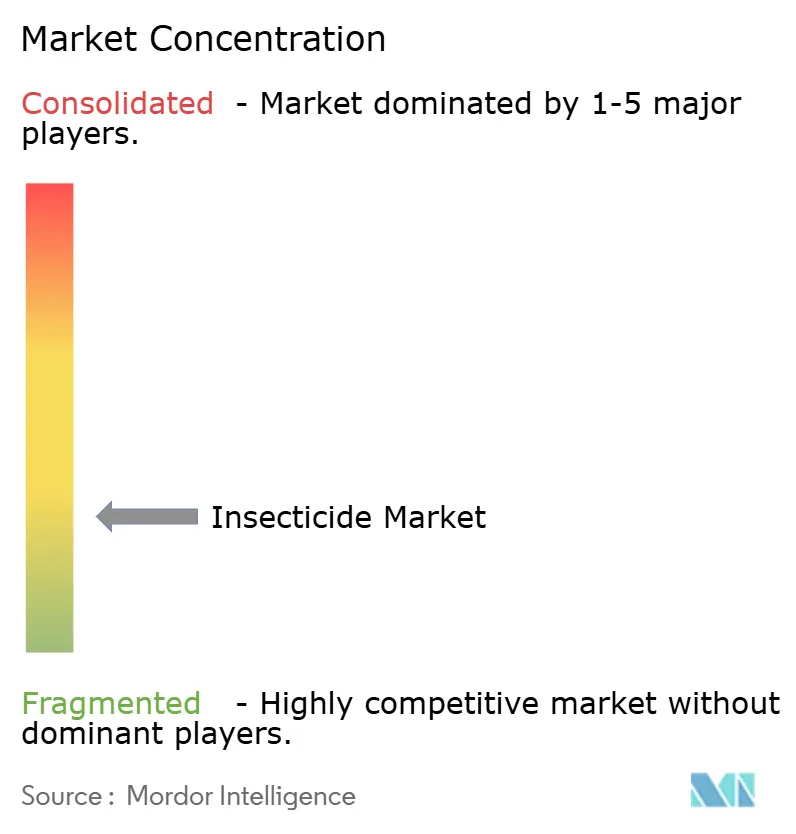
| Market Concentration | Low |
Major Players *Disclaimer: Major Players sorted in no particular order Image © Mordor Intelligence. Reuse requires attribution under CC BY 4.0. | |
Insecticide Market Analysis by Mordor Intelligence
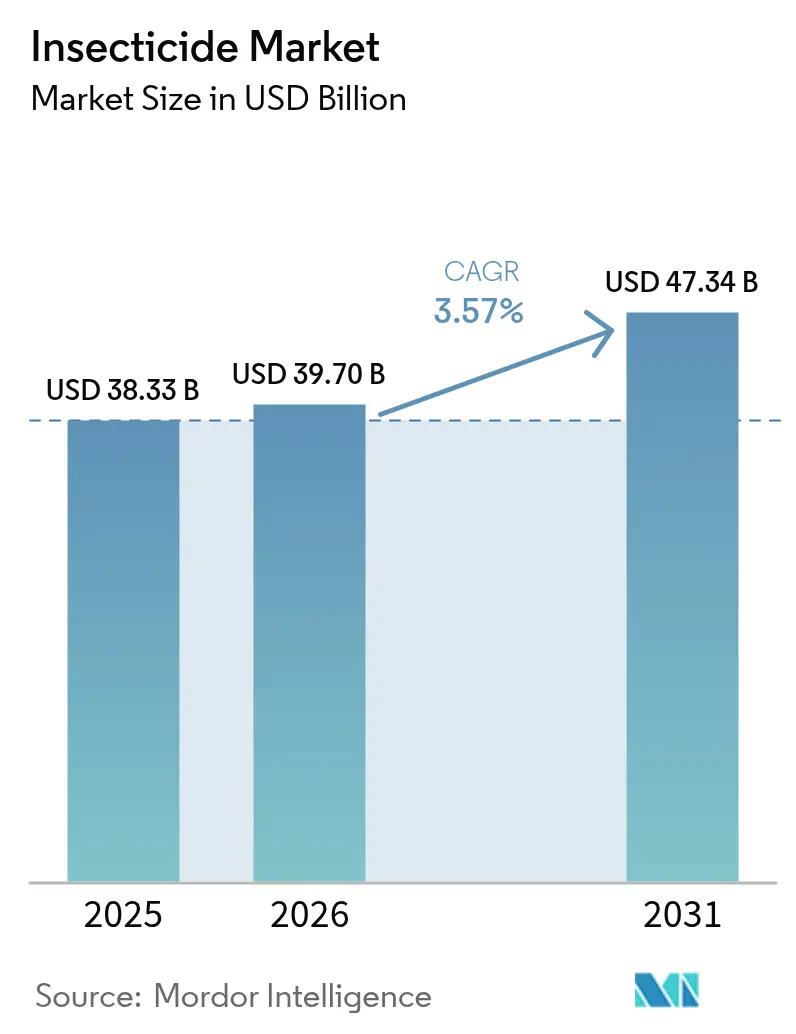
Insecticide market size in 2026 is estimated at USD 39.7 billion, growing from 2025 value of USD 38.33 billion with 2031 projections showing USD 47.34 billion, growing at 3.57% CAGR over 2026-2031. Solid food-security pressures, regulatory preference for lower-risk chemistries, and accelerated innovation in RNA interference platforms are re-shaping competitive priorities. Producers are steering portfolios toward bio-rational products that sidestep mounting resistance while complying with tightening residue limits. Precision agriculture hardware and AI-based pest forecasting support higher treatment accuracy, allowing growers to maintain yield protection with lower chemical loads. At the same time, intermediate shortages from China and stricter European approval standards are pushing formulators to diversify supply chains and invest in local manufacturing resilience.
Key Report Takeaways
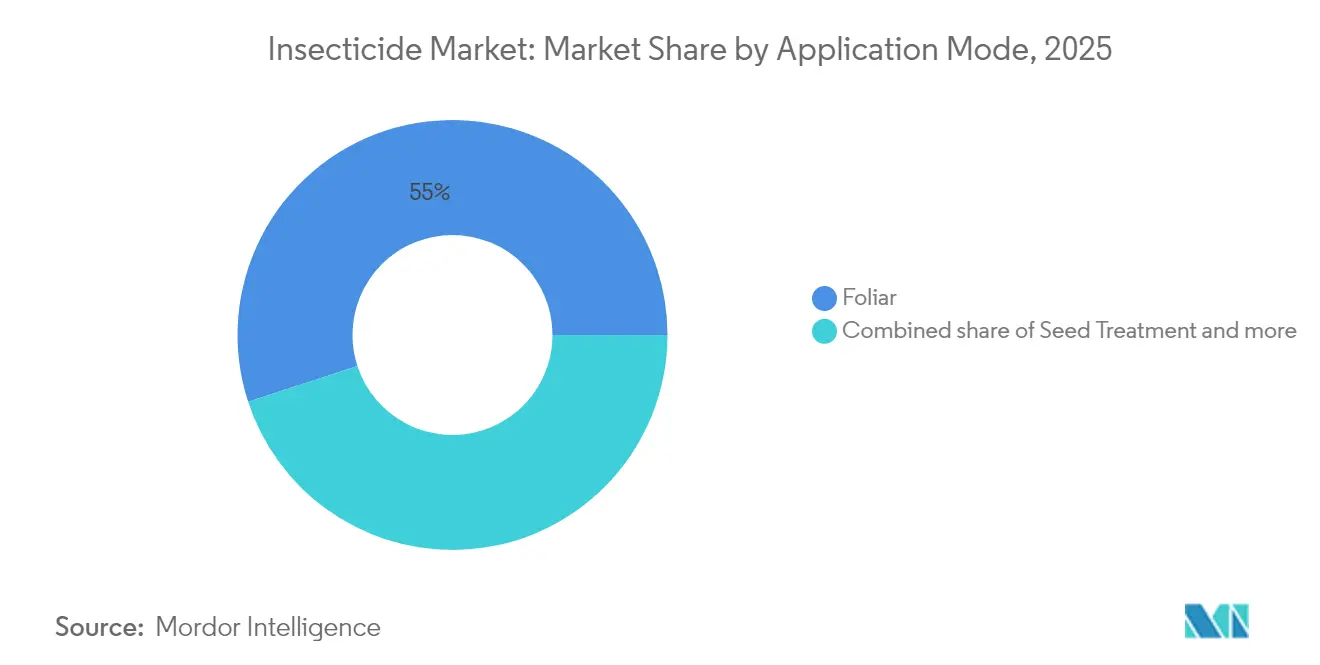
- By application mode, foliar treatment led with 55.02% of the insecticide market share in 2025, while seed treatment is projected to record a 3.65% CAGR through 2031.
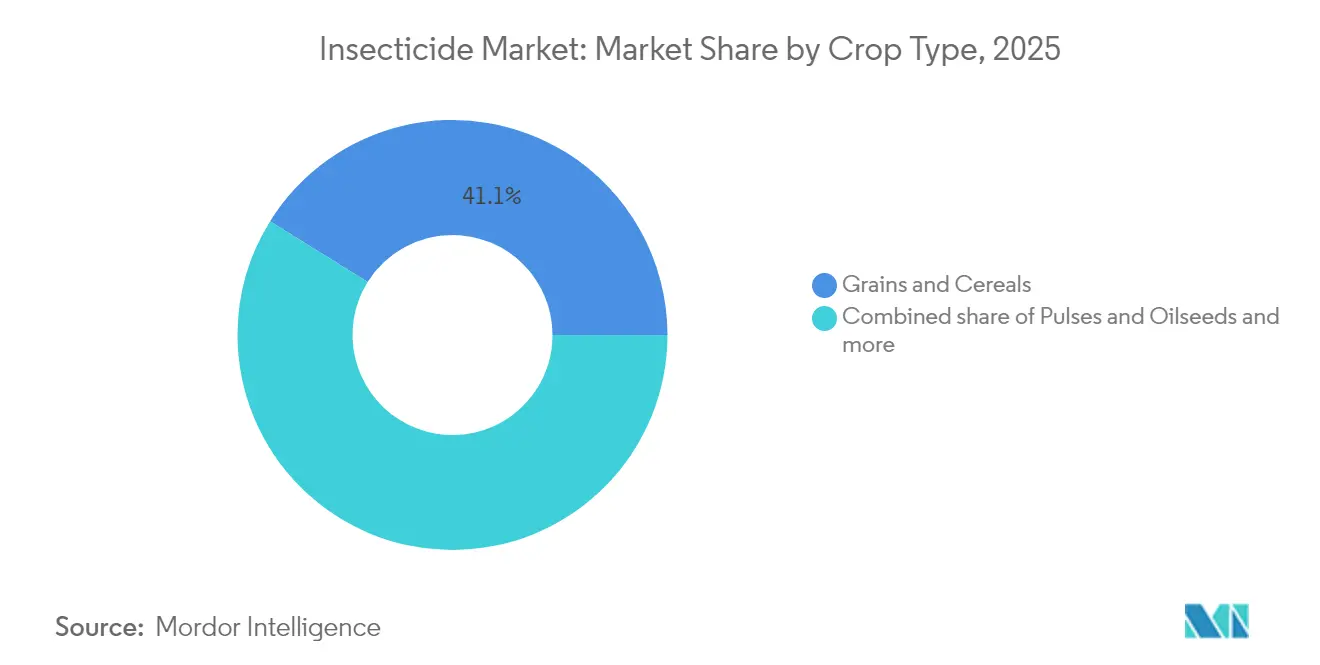
- By crop type, grains and cereals held 41.12% of the insecticide market size in 2025, whereas pulses and oilseeds are poised to expand at a 3.58% CAGR between 2026 and 2031.
- By geography, North America accounted for 37.62% of 2025 revenue and Asia-Pacific is forecast to advance at a 3.88% CAGR through 2031.
Note: Market size and forecast figures in this report are generated using Mordor Intelligence’s proprietary estimation framework, updated with the latest available data and insights as of 2026.
Global Insecticide Market Trends and Insights
Drivers Impact Analysis*
| Driver | (~) % Impact on CAGR Forecast | Geographic Relevance | Impact Timeline |
|---|---|---|---|
| Rising global food demand coupled with shrinking arable land | +0.8% | Asia-Pacific, Africa | Medium term (2–4 years) |
| Escalating pest resistance to existing chemistries | +0.6% | North America, Europe | Short term (≤ 2 years) |
| Introduction of novel chemistries with improved safety and resistance-management profile | +0.5% | North America, Europe, Asia-Pacific | Medium term (2–4 years) |
| Precision-agriculture technologies boosting application efficiency | +0.4% | North America, Europe | Long term (≥ 4 years) |
| Emergence of RNAi-based insecticidal modes of action | +0.3% | North America leadership, global adoption | Long term (≥ 4 years) |
| AI-driven predictive pest-outbreak modeling | +0.2% | North America, Brazil | Long term (≥ 4 years) |
| Source: Mordor Intelligence | |||
Rising Global Food Demand Coupled with Shrinking Arable Land
Per-capita arable land declined by one-third from 1961 to 2016, yet caloric requirements continue to climb, forcing growers to intensify input use[1]Source: Food and Agriculture Organization, “The State of Food Security and Nutrition in the World 2024,” fao.org. Higher insect pressure on densely planted acreage has led to a 15-20% increase in application rates since 2020. Precision sprayers help control chemical volumes without compromising protection. The Asia-Pacific region experiences the sharpest impact because population density collides with rapid dietary diversification into protein-rich staples. Governments mandate documented pest-management plans under ISO 14001 schemes, pushing the adoption of integrated solutions that balance yields and environmental goals.
Escalating Pest Resistance to Existing Chemistries
More than 500 arthropod species are now resistant to pyrethroids, while neonicotinoid tolerance is spreading in major crop pests. Farmers respond by shortening spray intervals and shifting to premium combinations that carry multiple modes of action. This challenge drives demand for RNAi and microbial solutions that can break cross-resistance patterns. Portfolio managers are bundling active ingredients with digital scouting services that help time applications precisely, thereby extending product efficacy and delaying the development of further resistance.
Introduction of Novel Chemistries with Improved Safety and Resistance-management Profile
New insecticide classes with distinct modes of action are opening premium segments and helping farmers overcome entrenched resistance. Broflanilide became the first IRAC Group 30 molecule cleared by the EPA in 2024, giving growers a fresh option when pyrethroids and neonicotinoids fail[2]Source: Environmental Protection Agency, “Biopesticide Registration,” epa.gov . The meta-diamide targets insect GABA-gated chloride channels, delivering strong control of lepidopteran and coleopteran pests. BASF markets the active as Teraxxa and Cimegra, which field trials show to be effective while posing low risk to pollinators and other beneficial organisms. Growers pay 25-30% premiums because the chemistry extends control windows and slows resistance build-up. Regulators often fast-track review of such safer profiles, giving companies that invest in next-generation actives a competitive head start in key markets.
Precision-agriculture Technologies Boosting Application Efficiency
Variable-rate rigs guided by GPS and machine-vision cameras cut insecticide volumes up to 30% while maintaining control levels[3]Source: Oxford Academic, “Insecticide Resistance in Agricultural Pests,” academic.oup.com. Remote imagery pinpoints pest hotspots, letting growers confine treatment to zones of economic threat. These savings cushion growers against cost inflation coming from raw-material shortages. Equipment vendors develop closed-loop systems that automatically adjust nozzle output based on pest density readings, transforming application efficiency into a measurable sustainability metric used by lenders and downstream buyers.
Restraints Impact Analysis*
| Restraint | (~) % Impact on CAGR Forecast | Geographic Relevance | Impact Timeline |
|---|---|---|---|
| Stringent environmental regulations on synthetic actives | −0.7% | Europe, North America are expanding globally | Short term (≤ 2 years) |
| Consumer shift toward organic produce | −0.4% | North America, Europe, urban Asia | Medium term (2–4 years) |
| Active-ingredient supply-chain disruptions (China curbs) | −0.3% | Global, highest in price-sensitive regions | Short term (≤ 2 years) |
| Climate-driven pest-range shifts shortening product life cycles | −0.2% | Global with local variations | Long term (≥ 4 years) |
| Source: Mordor Intelligence | |||
Stringent Environmental Regulations on Synthetic Actives
Europe’s blanket ban on neonicotinoids removed a significant chunk of sales, while the withdrawal of chlorpyrifos, also hampered the insecticides sales at the global level. Agencies prioritize pollinator safety, demanding extensive ecotoxicology dossiers that lengthen approval timelines. Firms pivot to lower-rate formulations and invest in registration for reduced-risk alternatives, but the gap between demand and approved actives remains. Compliance costs and uncertainty about future bans dampen R&D appetite for purely synthetic molecules.
Consumer Shift Toward Organic Produce
Global organic food sales grew 8.4% in 2024, commanding premiums of 20-40%. Retail chains require certified suppliers to meet zero-synthetic-residue standards, removing a portion of high-value horticulture demand from the conventional insecticides market. Producers of grapes, leafy greens, and berries switch to biological controls, pheromone mating-disruption, and intensive scouting. Chemical companies respond by developing OMRI-listed formulations that comply with organic protocols, although revenue per hectare decreases compared to conventional programs.
*Our forecasts treat driver/restraint impacts as directional, not additive. The impact forecasts reflect baseline growth, mix effects, and variable interactions.
Segment Analysis
By Application Mode: Foliar Command Leads While Seed Treatment Gains Ground
Foliar sprays accounted for 55.02% of 2025 revenue in the insecticide market, highlighting their versatility against both airborne and canopy-dwelling pests. Adoption endures in broad-acre grains where growers favor quick, visible action and familiar equipment. The segment benefits from advances in drift-reduction nozzles, which reduce off-target deposition. Yet regulatory scrutiny regarding aerial drift and worker exposure pressures formulators to innovate low-dose and encapsulated variants.
Seed treatment is projected to post the fastest 3.65% CAGR through 2031. Preventive placement of actives on seed surfaces limits field exposure and aligns with integrated programs emphasizing earliest life-stage protection. Compatibility with biological inoculants and micronutrient coatings adds value through stacking. As biotechnologies like RNAi move into seed-applied formulations, the market size for insecticide using these products is likely to accelerate further. Growers appreciate the uniform protection window and simplified logistics relative to multiple in-season foliar passes.


By Crop Type: Grains Dominate Volume, Specialty Crops Drive Value
Grains and cereals accounted for 41.12% of global insecticide volumes in 2025, reflecting the vast acreage of corn, wheat, and rice. Continuous monoculture intensifies pest prevalence, and growers rely on sequential treatments to safeguard yield ceilings. Stacked insect-resistant traits moderate usage in some geographies, but secondary pests, such as armyworm and aphids, fill the ecological niches vacated by primary targets, sustaining demand.
The pulses and oilseeds cohort is forecast to grow at a rate of 3.58% annually, driven by expanding soy and rapeseed cultivation in response to increasing plant-protein demand. Crop residues of certain chemistries face strict import tolerances, prompting exporters to shift toward lower-residue products to maintain premium markets. Fruits and vegetables, though smaller in acreage, command higher dollar-per-hectare spending because cosmetic damage thresholds are minimal. Specialty crops, such as cotton and plantation commodities, require bespoke solutions that balance efficacy with fiber or flavor integrity.
Geography Analysis
North America led with 37.62% revenue in 2025, underpinned by intensive corn-soy rotations, sophisticated farm machinery, and early adoption of digital agronomy tools. Growers confront mounting resistance in corn rootworm and soybean aphid complexes, spurring the uptake of RNAi seed treatments and stacked traits that reduce the frequency of chemical applications. State-level neonicotinoid constraints and Endangered Species Act reviews drive demand toward newer diamides and biologicals compatible with pollinator-protection guidelines. Canada’s canola sector and Mexico’s export-oriented produce belts add complementary demand for specialized formulations.
The Asia-Pacific region is anticipated to deliver the fastest growth, with a 3.88% CAGR to 2031, bolstered by high population density and government mandates to increase cereal self-sufficiency. India’s smallholders adopt higher-efficacy products as extension agencies demonstrate yield benefits. Vietnam, Thailand, and Indonesia are expanding rice production and diversifying into high-value fruit exports, which require tailored pest management programs. China remains the largest producer and user of insecticide, yet its dual role as supplier and regulator shapes global price dynamics. A domestic emphasis on food-quality metrics channels R&D toward safer molecules that can be replicated at an industrial scale.
Europe retains its prominent share in 2024 turnover, despite the world’s strictest approval framework, reflecting sustained demand for specialty crops under premium certification schemes. The Plant Protection Products Regulation eliminates many legacy actives, but value is recovered through the adoption of microbial and pheromone technologies, which are profitable at high production prices. Precision mapping and mandatory integrated pest management plans transform spray calendars into need-based interventions, reducing volumes while generating margins for differentiated products.

Competitive Landscape
The insecticide market exhibits a low concentration, with the five largest firms accounting for a minor share of the revenue, leaving ample room for regional champions and biologically rational start-ups. FMC leads with a portfolio spanning broader applications, fortified by recent acquisitions of pheromone specialists. Syngenta and Corteva leverage integrated offerings that bundle seeds, traits, and digital platforms, embedding chemical solutions within broader farm-decision ecosystems.
Strategic focus shifts from commodity synthesis toward the discovery of proprietary modes of action, notably in RNAi, microbial metabolites, and next-generation diamides. Patent applications for RNAi pest control increased between 2022 and 2024, signaling an escalation in the biotechnology arms race. AI partnerships between crop-protection majors and data-platform providers aim to tether product sales to digital advisory subscriptions, diversifying revenue streams.
Cost inflation in Chinese intermediates motivates dual sourcing and onshore capacity investments. Corteva’s Brazilian plant exemplifies near-market manufacturing to bypass logistic volatility. Meanwhile, European companies are exploring on-farm fermentation units that generate microbial actives locally, thereby reducing the constraints of the cold chain. Competitive advantage increasingly relies on regulatory literacy, digital integration, and the ability to articulate sustainability performance to value-chain auditors.
Insecticide Industry Leaders
FMC Corporation
Syngenta Group Co., Ltd. (ChemChina)
Corteva, Inc.
Bayer AG
ADAMA Agricultural Solutions Ltd. (Syngenta Group Co., Ltd.)
- *Disclaimer: Major Players sorted in no particular order

Recent Industry Developments
- August 2025: Bayer rolled out Camalus, a dual action insecticide crafted for horticulture growers in 11 Indian states, including Punjab, Maharashtra, and Karnataka. The product combines control of chewing and sucking pests in high value vegetables such as tomato, brinjal, and chilli, aligns with Integrated Pest Management practices, and lowers the number of spray rounds needed.
- September 2025: Bayer launched BICOTA, a granular insecticide that protects paddy from stem borers with one application, while encouraging stronger roots and more tillers. Targeted at India’s key rice belts, the formulation keeps beneficial insects safe even under shifting weather conditions.
- February 2025: Syngenta filed with the EPA for isocycloseram, the new PLINAZOLIN based active to be marketed as Opello for corn and Equento for cereals and pulses. Classified in IRAC Group 30, the molecule delivers rapid feeding stop through contact and ingestion, providing growers a fresh resistance management tool against early season pests such as corn rootworm, wireworm, and white grub.


Global Insecticide Market Report Scope
Chemigation, Foliar, Fumigation, Seed Treatment, and Soil Treatment are covered as segments by Application Mode. Commercial Crops, Fruits and Vegetables, Grains and Cereals, Pulses and Oilseeds, and Turf and Ornamentals are covered as segments by Crop Type. North America, Europe, Asia-Pacific, South America, and Africa are the segments covered by the Region.
| Chemigation |
| Foliar |
| Fumigation |
| Seed Treatment |
| Soil Treatment |
| Commercial Crops |
| Fruits and Vegetables |
| Grains and Cereals |
| Pulses and Oilseeds |
| Turf and Ornamental |
| North America | United States |
| Canada | |
| Mexico | |
| Rest of North America | |
| Europe | Germany |
| France | |
| Spain | |
| Russia | |
| Italy | |
| United Kingdom | |
| Netherlands | |
| Ukraine | |
| Rest of Europe | |
| Asia-Pacific | China |
| India | |
| Japan | |
| Australia | |
| Vietnam | |
| Philippines | |
| Pakistan | |
| Myanmar | |
| Indonesia | |
| Thailand | |
| Rest of Asia-Pacific | |
| South America | Brazil |
| Argentina | |
| Chile | |
| Rest of South America | |
| Africa | South Africa |
| Rest of Africa |
| Application Mode | Chemigation | |
| Foliar | ||
| Fumigation | ||
| Seed Treatment | ||
| Soil Treatment | ||
| Crop Type | Commercial Crops | |
| Fruits and Vegetables | ||
| Grains and Cereals | ||
| Pulses and Oilseeds | ||
| Turf and Ornamental | ||
| Geography | North America | United States |
| Canada | ||
| Mexico | ||
| Rest of North America | ||
| Europe | Germany | |
| France | ||
| Spain | ||
| Russia | ||
| Italy | ||
| United Kingdom | ||
| Netherlands | ||
| Ukraine | ||
| Rest of Europe | ||
| Asia-Pacific | China | |
| India | ||
| Japan | ||
| Australia | ||
| Vietnam | ||
| Philippines | ||
| Pakistan | ||
| Myanmar | ||
| Indonesia | ||
| Thailand | ||
| Rest of Asia-Pacific | ||
| South America | Brazil | |
| Argentina | ||
| Chile | ||
| Rest of South America | ||
| Africa | South Africa | |
| Rest of Africa | ||


Market Definition
- Function - Insecticides are chemicals used to control or prevent insects from damaging the crop and prevent yield loss.
- Application Mode - Foliar, Seed Treatment, Soil Treatment, Chemigation, and Fumigation are the different type of application modes through which crop protection chemicals are applied to the crops.
- Crop Type - This represents the consumption of crop protection chemicals by Cereals, Pulses, Oilseeds, Fruits, Vegetables, Turf, and Ornamental crops.
| Keyword | Definition |
|---|---|
| IWM | Integrated weed management (IWM) is an approach to incorporate multiple weed control techniques throughout the growing season to give producers the best opportunity to control problematic weeds. |
| Host | Hosts are the plants that form relationships with beneficial microorganisms and help them colonize. |
| Pathogen | A disease-causing organism. |
| Herbigation | Herbigation is an effective method of applying herbicides through irrigation systems. |
| Maximum residue levels (MRL) | Maximum Residue Limit (MRL) is the maximum allowed limit of pesticide residue in food or feed obtained from plants and animals. |
| IoT | The Internet of Things (IoT) is a network of interconnected devices that connect and exchange data with other IoT devices and the cloud. |
| Herbicide-tolerant varieties (HTVs) | Herbicide-tolerant varieties are plant species that have been genetically engineered to be resistant to herbicides used on crops. |
| Chemigation | Chemigation is a method of applying pesticides to crops through an irrigation system. |
| Crop Protection | Crop protection is a method of protecting crop yields from different pests, including insects, weeds, plant diseases, and others that cause damage to agricultural crops. |
| Seed Treatment | Seed treatment helps to disinfect seeds or seedlings from seed-borne or soil-borne pests. Crop protection chemicals, such as fungicides, insecticides, or nematicides, are commonly used for seed treatment. |
| Fumigation | Fumigation is the application of crop protection chemicals in gaseous form to control pests. |
| Bait | A bait is a food or other material used to lure a pest and kill it through various methods, including poisoning. |
| Contact Fungicide | Contact pesticides prevent crop contamination and combat fungal pathogens. They act on pests (fungi) only when they come in contact with the pests. |
| Systemic Fungicide | A systemic fungicide is a compound taken up by a plant and then translocated within the plant, thus protecting the plant from attack by pathogens. |
| Mass Drug Administration (MDA) | Mass drug administration is the strategy to control or eliminate many neglected tropical diseases. |
| Mollusks | Mollusks are pests that feed on crops, causing crop damage and yield loss. Mollusks include octopi, squid, snails, and slugs. |
| Pre-emergence Herbicide | Preemergence herbicides are a form of chemical weed control that prevents germinated weed seedlings from becoming established. |
| Post-emergence Herbicide | Postemergence herbicides are applied to the agricultural field to control weeds after emergence (germination) of seeds or seedlings. |
| Active Ingredients | Active ingredients are the chemicals in pesticide products that kill, control, or repel pests. |
| United States Department of Agriculture (USDA) | The Department of Agriculture provides leadership on food, agriculture, natural resources, and related issues. |
| Weed Science Society of America (WSSA) | The WSSA, a non-profit professional society, promotes research, education, and extension outreach activities related to weeds. |
| Suspension concentrate | Suspension concentrate (SC) is one of the formulations of crop protection chemicals with solid active ingredients dispersed in water. |
| Wettable powder | A wettable powder (WP) is a powder formulation that forms a suspension when mixed with water prior to spraying. |
| Emulsifiable concentrate | Emulsifiable concentrate (EC) is a concentrated liquid formulation of pesticide that needs to be diluted with water to create a spray solution. |
| Plant-parasitic nematodes | Parasitic Nematodes feed on the roots of crops, causing damage to the roots. These damages allow for easy plant infestation by soil-borne pathogens, which results in crop or yield loss. |
| Australian Weeds Strategy (AWS) | The Australian Weeds Strategy, owned by the Environment and Invasives Committee, provides national guidance on weed management. |
| Weed Science Society of Japan (WSSJ) | WSSJ aims to contribute to the prevention of weed damage and the utilization of weed value by providing the chance for research presentation and information exchange. |


Research Methodology
Mordor Intelligence follows a four-step methodology in all our reports.
- Step-1: Identify Key Variables: In order to build a robust forecasting methodology, the variables and factors identified in Step-1 are tested against available historical market numbers. Through an iterative process, the variables required for market forecast are set and the model is built on the basis of these variables.
- Step-2: Build a Market Model: Market-size estimations for the forecast years are in nominal terms. Inflation is not a part of the pricing, and the average selling price (ASP) is kept constant throughout the forecast period.
- Step-3: Validate and Finalize: In this important step, all market numbers, variables and analyst calls are validated through an extensive network of primary research experts from the market studied. The respondents are selected across levels and functions to generate a holistic picture of the market studied.
- Step-4: Research Outputs: Syndicated Reports, Custom Consulting Assignments, Databases & Subscription Platforms


