North America Insecticide Market Size and Share
Market Overview
| Study Period | 2017 - 2030 |
|---|---|
| Forecast Data Period | 2025 - 2030 |
| Historical Data Period | 2017 - 2023 |
| Market Size (2025) | USD 8.92 Billion |
| Market Size (2030) | USD 11.06 Billion |
| Growth Rate (2025 - 2030) | 4.38% CAGR |
| Market Concentration | Low |
Major Players*Disclaimer: Major Players sorted in no particular order Image © Mordor Intelligence. Reuse requires attribution under CC BY 4.0. | |

North America Insecticide Market Analysis by Mordor Intelligence
The North America Insecticide Market size is estimated at 8.92 billion USD in 2025, and is expected to reach 11.06 billion USD by 2030, growing at a CAGR of 4.38% during the forecast period (2025-2030).
The North American insecticide industry is experiencing significant technological advancements in application methods and product formulations. Foliar applications continue to dominate the market, accounting for 41.2% of total applications in 2022, due to their proven effectiveness and widespread adoption. The industry is witnessing a shift toward precision agriculture, with chemigation methods gaining traction and representing 14.4% of applications in 2022. This evolution reflects the growing emphasis on efficient resource utilization and sustainable farming practices. The recent partnership between Bayer and Oerth Bio in 2023 for developing next-generation crop protection chemical products exemplifies the industry's commitment to innovation and sustainability.
Agricultural challenges have intensified the need for effective integrated pest management solutions across North America. Crop damage from invasive species remains a significant concern, with the Colorado Potato Beetle causing yield reductions ranging from 20% to 100% in potato crops. The severity of pest-related challenges is further evidenced by the 87.6% yield loss in corn production due to invertebrate pests in the United States and Canada. These challenges have spurred the development of more targeted and efficient insecticide solutions, with companies focusing on products that offer both preventive and curative control.
The industry is witnessing a notable shift toward integrated pest management approaches and sustainable solutions. Major industry players are investing in research and development to create products that align with environmental sustainability goals while maintaining efficacy. This trend is exemplified by strategic partnerships, such as FMC Corporation's agreement with UPL Limited for the distribution of the Rynazypyr active ingredient, which aims to expand access to sustainable agricultural pest control solutions. The focus on sustainability has led to innovations in product formulations that minimize environmental impact while maximizing pest control effectiveness.
Climate change is significantly impacting pest patterns and behaviors across North America, creating new challenges for crop protection. Wheat farmers face increasing pressure from pests like the Stem Sawfly, which causes yield losses between 10% and 15%. The changing climate has led to altered pest migration patterns and extended breeding seasons, necessitating more sophisticated and adaptable insecticide solutions. This has prompted the industry to develop more resilient and flexible pest management strategies, including the integration of digital technologies for better pest monitoring and targeted application of pest control chemical solutions.
North America Insecticide Market Trends and Insights
The need for improved yield by protecting the crops from pests is anticipated to boost the demand for insecticides
- Among the North American countries, the United States witnessed the largest consumption of insecticides per hectare, with 791.7 g in 2022, attributed to the large area under the cultivation of crops and increased exposure to insect pest infestations due to constantly changing climatic conditions due to factors like global warming. Rising temperatures have caused the increased survival of insect pests during the winter seasons, which is mainly observed in cases of corn earworm and cotton bollworm in the United States.
- This phenomenon has posed a notable risk to crop yields and presented a significant challenge in managing these pests, particularly in corn cultivation, which is a fundamentally grown food crop in the United States. These kinds of circumstances have increased the need for heavy insecticide consumption per hectare of cropland.
- Mexico is the second-largest consumer of insecticides in North America, and in 2022, the country consumed 606 g of insecticides per hectare. The increased usage of insecticides in the country may be attributed to the reduction in the harvested crop yield due to increased infestation of insect pests. According to the data provided by the FAO Statistics, the yield of eggplant, which is one of the most largely grown crops in Mexico, decreased from 793.0 kg per hectare in 2019 to 785.0 kg per hectare in 2021, leading to reduced insecticide consumption. The aim to increase the yield of the crops is majorly driving the usage of insecticides in the country.
- It was reported that 87.6% of the yield loss from the total corn produced in the United States and Canada was due to invertebrate pest infestation. These factors are anticipated to drive the usage of insecticides in North America.


The prices of insecticides may be impacted by the fluctuation of raw material prices
- In 2022, cypermethrin was valued at USD 21.1 thousand per metric ton. Its widespread utilization in agriculture owes to its proficiency in managing diverse insect varieties, such as aphids, beetles, spotted ball worms, pink ball worms, early spot borers, and hairy caterpillars. Its proven efficacy has elevated its popularity among farmers aiming to protect their crops from pests and secure a fruitful yield.
- Imidacloprid stands as a potent neonicotinoid insecticide, displaying effective systemic and enduring characteristics. It boasts the ability to manage a broad spectrum of insects, such as aphids, cane beetles, thrips, stink bugs, locusts, and an array of other crop-damaging pests. It is also used as a seed treatment that shields young plants from harm, especially against subterranean pests that can threaten germinating and growing plants. Imidacloprid products are available in various forms, such as liquid concentrates and solids. Owing to its compatibility with plants and minimal application needs, it has gained popularity among farmers. The pricing of this active compound was recorded at USD 17.2 thousand per metric ton in 2022.
- Malathion is an organophosphate insecticide that is used to control a wide variety of food and feed crops to control many types of insects such as aphids, fleas, leafhoppers, Japanese beetles, and other insect pests on a number of crops. Five crops that are extensively grown in the United States that use malathion frequently are cherry tomato, broccoli, mulberry, cranberry, and fig. It is valued at a price of USD 12.6 thousand per metric ton in 2022.

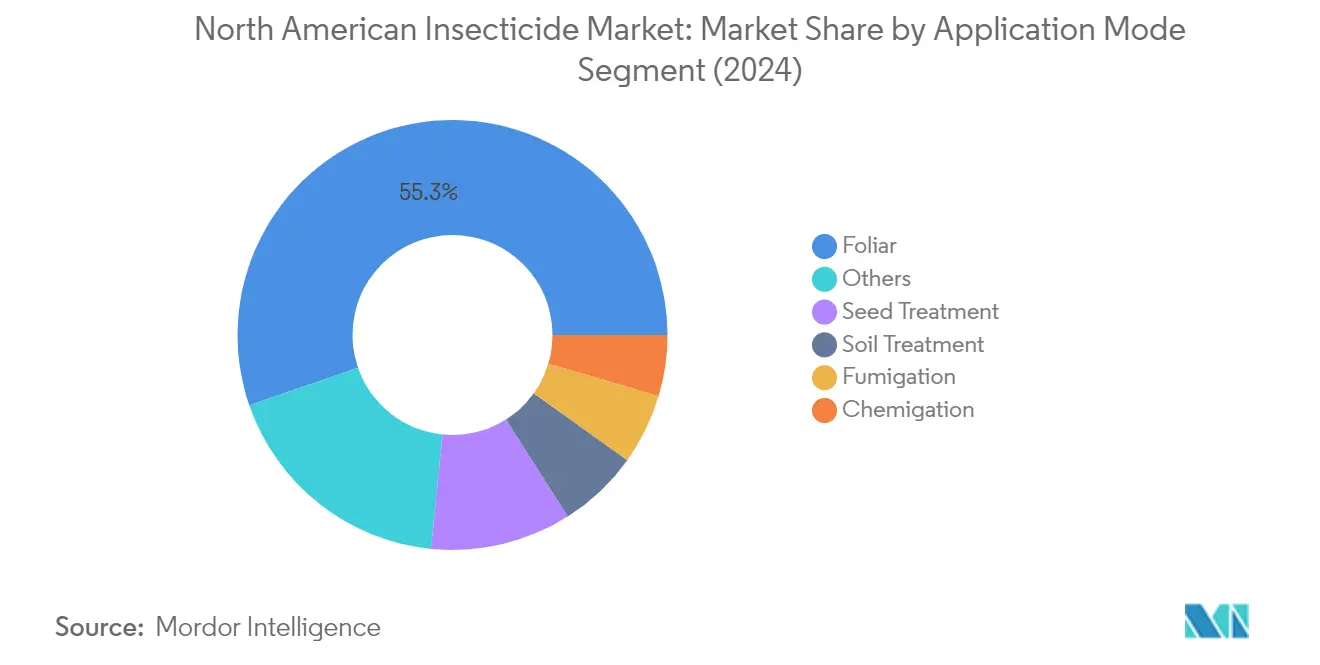
Segment Analysis: Application Mode
Foliar Segment in North American Insecticide Market
The foliar application segment dominates the North American insecticide market, accounting for approximately 55% market share in 2024. This significant market position is attributed to foliar application's versatility and effectiveness in controlling various pest control pressures across different crop types. Foliar applications provide targeted pest control, allowing farmers to focus on specific areas where pest pressures are highest, making it particularly valuable for large-scale agricultural operations. The method's popularity is further enhanced by its compatibility with modern precision farming techniques and its ability to provide quick absorption and rapid pest control. The segment's dominance is particularly evident in grains and cereals cultivation, where foliar insecticides play a crucial role in protecting crops from various pests that can significantly impact yield and quality.

Seed Treatment Segment in North American Insecticide Market
The seed treatment segment is emerging as the most dynamic sector in the North American insecticide market, projected to grow at approximately 5% CAGR from 2024 to 2029. This growth is driven by increasing awareness of the benefits offered by seed-applied technologies in protecting and establishing healthy seedlings. The segment's expansion is supported by technological advancements in insecticide formulations and application methods, making treatments more effective and environmentally sustainable. Farmers are increasingly recognizing seed treatment's value in providing early-season protection against soil-borne and early-season pests, which is crucial for establishing strong crop stands. The method's precision application and reduced environmental impact compared to traditional application methods are also contributing to its rapid adoption across various crop types.
Remaining Segments in Application Mode
The other application modes in the North American insecticide market include chemigation, fumigation, and soil treatment, each serving specific needs in pest management strategies. Chemigation combines irrigation systems with insecticide application, offering efficiency in water and chemical usage. Fumigation provides comprehensive pest control in stored grains and pre-planting soil treatment, while soil treatment focuses on managing soil-dwelling pests and protecting root systems. These application methods complement each other in integrated pest management programs, with their selection depending on factors such as crop type, pest pressure, and environmental conditions. Each method has its unique advantages and plays a vital role in different agricultural scenarios, contributing to the overall robustness of pest management solutions in North American agriculture.
Segment Analysis: Crop Type
Grains & Cereals Segment in North American Insecticide Market
The grains and cereals segment dominates the North American insecticide market, commanding approximately 45% of the total market value in 2024. This substantial market share is primarily attributed to the extensive cultivation of major cereal crops like maize, wheat, barley, oats, rice, and sorghum across the region. The segment's prominence is driven by the critical need to protect these staple crops from various insect pests that feed on foliage, grains, and stems, which can lead to significant yield losses and quality issues. The segment is experiencing robust growth due to increasing pest pressures, particularly from insects like fall armyworms and changing climatic conditions that affect pest populations. Beta-cyfluthrin, Carbaryl, Chlorpyrifos, Dimethoate, Malathion, and Methomyl are among the major insecticides used in this segment, proving effective in controlling pests such as aphids, bugs, beetles, caterpillars, and various sucking and chewing pests.
Fruits & Vegetables Segment in North American Insecticide Market
The fruits and vegetables segment is emerging as one of the fastest-growing segments in the North American insecticide market, projected to grow at approximately 5% during 2024-2029. This robust growth is driven by the increasing demand for high-quality produce and the rising challenges posed by various insect pests affecting these high-value crops. The segment's growth is further fueled by the adoption of integrated pest management practices, which emphasize using a combination of pest control methods to manage pest populations effectively. Climate change is playing a significant role in driving the demand for insecticides in this segment, as warmer temperatures and changing rainfall patterns create more favorable conditions for certain pests to thrive and reproduce. The segment's growth is also supported by the increasing awareness among farmers about the importance of protecting fruits and vegetables from pests to maintain their market value and meet consumer demands for unblemished produce.
Remaining Segments in Crop Type Segmentation
The remaining segments in the North American insecticide market include pulses & oilseeds, turf & ornamental, and commercial crops, each serving distinct agricultural needs. The pulses & oilseeds segment plays a crucial role in protecting crops like soybeans, canola, and various legumes from pest infestations. The turf & ornamental segment focuses on maintaining the aesthetic and health of landscaping areas, golf courses, and ornamental gardens. The commercial crops segment serves specialized crop protection needs for crops like sugarcane, cotton, coffee, and tobacco. These segments collectively contribute to the market's diversity and cater to specific pest management requirements across different agricultural and horticultural applications.
North America Insecticide Market Geography Segment Analysis
North America Insecticide Market in the United States
The United States dominates the North American insecticide market, commanding approximately 91% of the total market value in 2024. The country's leadership position is underpinned by its extensive agricultural sector, which encompasses a diverse range of crops requiring comprehensive pest control product solutions. The market is particularly driven by the substantial cultivation of major crops like soybeans, corn, and cotton, which face persistent challenges from various insect pests. The country's advanced agricultural practices, combined with the increasing adoption of integrated pest management strategies, have fostered a sophisticated market for insecticide products. The presence of major agricultural research institutions and a strong regulatory framework through the Environmental Protection Agency (EPA) has enabled the development and implementation of innovative insecticide solutions. Furthermore, the growing emphasis on sustainable agriculture and the rising demand for food security have catalyzed the adoption of newer, more efficient insecticide products in the United States.
North America Insecticide Market in Mexico
Mexico represents one of the most dynamic segments in the North American insecticide market, projected to grow at approximately 6% CAGR from 2024 to 2029. The country's agricultural sector is experiencing significant transformation, driven by modernization efforts and increasing export-oriented production. The diverse climatic conditions across Mexico enable year-round cultivation of various crops, necessitating comprehensive pest control product solutions. The market is witnessing substantial technological advancement in insecticide application methods, with farmers increasingly adopting precision agriculture techniques. The growing awareness about crop protection among small and medium-scale farmers has led to increased adoption of modern agricultural insecticide products. Additionally, the country's focus on enhancing agricultural productivity through better pest management practices has created a favorable environment for market growth. The government's initiatives to support agricultural modernization and sustainable farming practices have further strengthened the market dynamics.
North America Insecticide Market in Canada
Canada's insecticide market is characterized by its strong focus on sustainable agricultural practices and environmental stewardship. The country's agricultural sector faces unique challenges due to its shorter growing seasons and specific pest pressures, particularly in major crops like wheat, canola, and pulses. The market is heavily influenced by the stringent regulatory framework established by the Pest Management Regulatory Agency (PMRA), which ensures the safety and efficacy of insecticide products. Canadian farmers are increasingly adopting integrated pest management approaches, combining chemical and biological insecticide control methods. The market has witnessed significant developments in seed treatment applications, particularly in grain and oilseed crops. The growing emphasis on organic farming and sustainable agriculture has also influenced the development and adoption of newer, more environmentally friendly insecticide solutions. The country's robust agricultural research infrastructure continues to drive innovation in pest management strategies.
North America Insecticide Market in Other Countries
The insecticide market in other North American countries, including Guatemala, Panama, Jamaica, and Cuba, exhibits distinct characteristics shaped by their unique agricultural landscapes and pest management needs. These markets are primarily driven by the cultivation of tropical and subtropical crops, which face specific pest challenges requiring targeted insecticide solutions. The agricultural sectors in these countries are gradually modernizing, with increasing adoption of advanced pest management practices. Local farming communities are becoming more aware of the importance of proper insecticide usage and integrated pest management approaches. The market in these regions is also influenced by international trade requirements, particularly for export-oriented crops. Climate change and evolving pest patterns have necessitated adaptive pest management strategies, driving the evolution of insecticide usage patterns. The growing focus on sustainable agriculture and environmental protection is shaping the development and adoption of new insecticide products in these markets.

Competitive Landscape
Top Companies in North America Insecticide Market
The North American insecticide market is characterized by companies focusing on continuous product innovation and the development of novel active ingredients to address evolving pest challenges. Companies are investing heavily in research and development to create more effective and environmentally sustainable solutions, particularly in developing new modes of action to combat pest resistance. Strategic partnerships and collaborations have become increasingly common, allowing companies to expand their product portfolios and geographic reach while leveraging complementary strengths. Operational agility is demonstrated through investments in manufacturing facilities and distribution networks, enabling companies to respond quickly to market demands and maintain supply chain efficiency. Companies are also expanding their presence through strategic acquisitions and partnerships with local distributors, particularly in emerging agricultural regions, while simultaneously focusing on developing integrated pest management solutions that combine chemical and biological insecticide approaches.
Consolidated Market Led By Global Players
The North American insecticide market exhibits a consolidated structure dominated by large multinational corporations with diverse agricultural portfolios. These major players leverage their extensive research capabilities, established distribution networks, and strong brand recognition to maintain their market positions. The market is characterized by the presence of both diversified agricultural science companies and specialized crop protection chemical firms, with global conglomerates holding significant market share due to their comprehensive product offerings and substantial resources for research and development.
The market has witnessed significant merger and acquisition activity as companies seek to strengthen their market presence and expand their technological capabilities. These strategic moves have resulted in further market consolidation, with larger players acquiring smaller, specialized companies to enhance their product portfolios and access new technologies. Companies are also forming strategic alliances and partnerships to share resources, reduce development costs, and accelerate innovation, particularly in developing next-generation pest control chemical solutions.
Innovation and Sustainability Drive Future Success
For incumbent companies to maintain and increase their market share, focusing on sustainable product development and integrated pest management solutions has become crucial. Success factors include investing in research and development to create products with novel modes of action, improving formulation technologies, and developing solutions that address specific regional pest challenges. Companies must also strengthen their distribution networks, build strong relationships with local agricultural communities, and provide comprehensive technical support to end-users while adapting their strategies to meet evolving regulatory requirements and sustainability goals.
Market contenders can gain ground by focusing on specialized market segments and developing innovative solutions for specific crop-pest combinations. Success strategies include forming strategic partnerships with established players for distribution and manufacturing, investing in sustainable and environmentally friendly technologies, and building strong technical support capabilities. Companies must also consider the increasing importance of digital agriculture and precision application technologies while maintaining flexibility to adapt to changing regulatory landscapes and environmental concerns. Building strong relationships with key stakeholders, including farmers, agricultural organizations, and regulatory bodies, will be crucial for long-term success in this market.
North America Insecticide Industry Leaders
Bayer AG
Corteva Agriscience
FMC Corporation
Nufarm Ltd
Syngenta Group
- *Disclaimer: Major Players sorted in no particular order


Recent Industry Developments
- January 2023: Bayer formed a new partnership with Oerth Bio to enhance crop protection technology and create more eco-friendly crop protection solutions.
- May 2022: UPL partnered with Bayer for Spirotetramat insecticide to develop new pest management solutions. Through this long-term global data access and supply agreement with Bayer, specifically for addressing farmer demands regarding resistance management and difficult-to-control sucking pests, UPL will develop, register, and distribute new unique solutions, including Spirotetramat, using its experience in insecticides and worldwide research and development network.
- November 2021: Syngenta Crop Protection introduced the Plinazolin technology, a new active ingredient with a unique Mode of Action (IRAC Group 30) for insect control to assist farmers in protecting their crops from a variety of pests.


North America Insecticide Market Report Scope
Chemigation, Foliar, Fumigation, Seed Treatment, Soil Treatment are covered as segments by Application Mode. Commercial Crops, Fruits & Vegetables, Grains & Cereals, Pulses & Oilseeds, Turf & Ornamental are covered as segments by Crop Type. Canada, Mexico, United States are covered as segments by Country.| Chemigation |
| Foliar |
| Fumigation |
| Seed Treatment |
| Soil Treatment |
| Commercial Crops |
| Fruits and Vegetables |
| Grains and Cereals |
| Pulses and Oilseeds |
| Turf and Ornamental |
| Canada |
| Mexico |
| United States |
| Rest of North America |
| Application Mode | Chemigation |
| Foliar | |
| Fumigation | |
| Seed Treatment | |
| Soil Treatment | |
| Crop Type | Commercial Crops |
| Fruits and Vegetables | |
| Grains and Cereals | |
| Pulses and Oilseeds | |
| Turf and Ornamental | |
| Country | Canada |
| Mexico | |
| United States | |
| Rest of North America |


Market Definition
- Function - Insecticides are chemicals used to control or prevent insects from damaging the crop and prevent yield loss.
- Application Mode - Foliar, Seed Treatment, Soil Treatment, Chemigation, and Fumigation are the different type of application modes through which crop protection chemicals are applied to the crops.
- Crop Type - This represents the consumption of crop protection chemicals by Cereals, Pulses, Oilseeds, Fruits, Vegetables, Turf, and Ornamental crops.
| Keyword | Definition |
|---|---|
| IWM | Integrated weed management (IWM) is an approach to incorporate multiple weed control techniques throughout the growing season to give producers the best opportunity to control problematic weeds. |
| Host | Hosts are the plants that form relationships with beneficial microorganisms and help them colonize. |
| Pathogen | A disease-causing organism. |
| Herbigation | Herbigation is an effective method of applying herbicides through irrigation systems. |
| Maximum residue levels (MRL) | Maximum Residue Limit (MRL) is the maximum allowed limit of pesticide residue in food or feed obtained from plants and animals. |
| IoT | The Internet of Things (IoT) is a network of interconnected devices that connect and exchange data with other IoT devices and the cloud. |
| Herbicide-tolerant varieties (HTVs) | Herbicide-tolerant varieties are plant species that have been genetically engineered to be resistant to herbicides used on crops. |
| Chemigation | Chemigation is a method of applying pesticides to crops through an irrigation system. |
| Crop Protection | Crop protection is a method of protecting crop yields from different pests, including insects, weeds, plant diseases, and others that cause damage to agricultural crops. |
| Seed Treatment | Seed treatment helps to disinfect seeds or seedlings from seed-borne or soil-borne pests. Crop protection chemicals, such as fungicides, insecticides, or nematicides, are commonly used for seed treatment. |
| Fumigation | Fumigation is the application of crop protection chemicals in gaseous form to control pests. |
| Bait | A bait is a food or other material used to lure a pest and kill it through various methods, including poisoning. |
| Contact Fungicide | Contact pesticides prevent crop contamination and combat fungal pathogens. They act on pests (fungi) only when they come in contact with the pests. |
| Systemic Fungicide | A systemic fungicide is a compound taken up by a plant and then translocated within the plant, thus protecting the plant from attack by pathogens. |
| Mass Drug Administration (MDA) | Mass drug administration is the strategy to control or eliminate many neglected tropical diseases. |
| Mollusks | Mollusks are pests that feed on crops, causing crop damage and yield loss. Mollusks include octopi, squid, snails, and slugs. |
| Pre-emergence Herbicide | Preemergence herbicides are a form of chemical weed control that prevents germinated weed seedlings from becoming established. |
| Post-emergence Herbicide | Postemergence herbicides are applied to the agricultural field to control weeds after emergence (germination) of seeds or seedlings. |
| Active Ingredients | Active ingredients are the chemicals in pesticide products that kill, control, or repel pests. |
| United States Department of Agriculture (USDA) | The Department of Agriculture provides leadership on food, agriculture, natural resources, and related issues. |
| Weed Science Society of America (WSSA) | The WSSA, a non-profit professional society, promotes research, education, and extension outreach activities related to weeds. |
| Suspension concentrate | Suspension concentrate (SC) is one of the formulations of crop protection chemicals with solid active ingredients dispersed in water. |
| Wettable powder | A wettable powder (WP) is a powder formulation that forms a suspension when mixed with water prior to spraying. |
| Emulsifiable concentrate | Emulsifiable concentrate (EC) is a concentrated liquid formulation of pesticide that needs to be diluted with water to create a spray solution. |
| Plant-parasitic nematodes | Parasitic Nematodes feed on the roots of crops, causing damage to the roots. These damages allow for easy plant infestation by soil-borne pathogens, which results in crop or yield loss. |
| Australian Weeds Strategy (AWS) | The Australian Weeds Strategy, owned by the Environment and Invasives Committee, provides national guidance on weed management. |
| Weed Science Society of Japan (WSSJ) | WSSJ aims to contribute to the prevention of weed damage and the utilization of weed value by providing the chance for research presentation and information exchange. |


Research Methodology
Mordor Intelligence follows a four-step methodology in all our reports.
- Step-1: Identify Key Variables: In order to build a robust forecasting methodology, the variables and factors identified in Step-1 are tested against available historical market numbers. Through an iterative process, the variables required for market forecast are set and the model is built on the basis of these variables.
- Step-2: Build a Market Model: Market-size estimations for the forecast years are in nominal terms. Inflation is not a part of the pricing, and the average selling price (ASP) is kept constant throughout the forecast period.
- Step-3: Validate and Finalize: In this important step, all market numbers, variables and analyst calls are validated through an extensive network of primary research experts from the market studied. The respondents are selected across levels and functions to generate a holistic picture of the market studied.
- Step-4: Research Outputs: Syndicated Reports, Custom Consulting Assignments, Databases & Subscription Platforms


