
Fitness And Recreational Sports Centers Market Size and Share
Market Overview
| Study Period | 2021 - 2031 |
|---|---|
| Market Size (2026) | USD 159.39 Billion |
| Market Size (2031) | USD 235.47 Billion |
| Growth Rate (2026 - 2031) | 8.12 % |
| Fastest Growing Market | Asia Pacific |
| Largest Market | North America |
| Market Concentration | Low |
Major Players *Disclaimer: Major Players sorted in no particular order Image © Mordor Intelligence. Reuse requires attribution under CC BY 4.0. | |
Fitness And Recreational Sports Centers Market Analysis by Mordor Intelligence
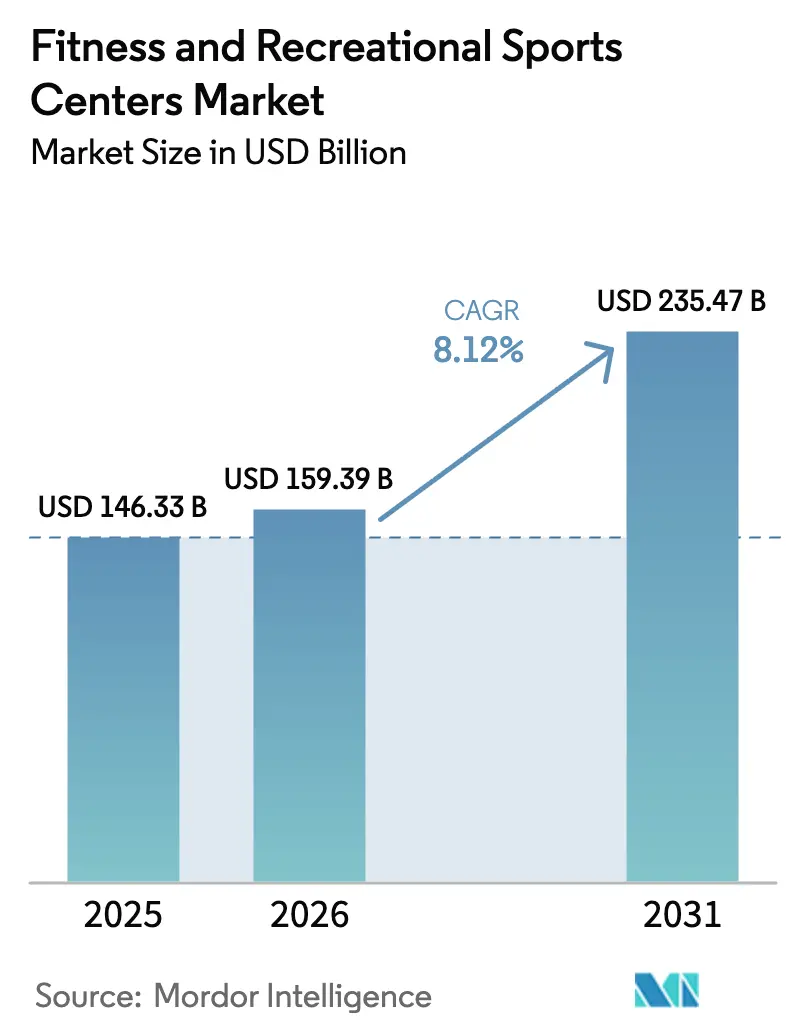
The Fitness and Recreational Sports Centres Market size was valued at USD 146.33 billion in 2025 and estimated to grow from USD 159.39 billion in 2026 to reach USD 235.47 billion by 2031, at a CAGR of 8.12% during the forecast period (2026 to 2031). The robust expansion stems from consumers directing a growing share of household budgets toward preventive health, spurred by government mandates that reward regular physical activity. Operators that certify member engagement now tap quasi-public revenue streams, shielding cash flows from cyclical shocks. Format fragmentation is sharpening competitive tactics; boutique studios command premium pricing, while big-box chains defend scale through budget memberships. Digital integration is turning facilities into data platforms, enabling algorithmic capacity planning and outcome-based pricing. The parallel growth of corporate wellness programs and senior preventive care is widening procurement opportunities as employers and insurers co-fund utilization-linked contracts.
Key Report Takeaways
- By facility type, gymnasiums and health clubs captured 41.15% of the fitness and recreational sports centers market share in 2025, whereas yoga studios are on track to post an 8.53% CAGR to 2031.
- By end-user, adults generated 46.26% of revenue in 2025, while the kids and children segment is projected to expand at a 9.24% CAGR through 2031.
- By service type, memberships contributed 91.35% of revenue in 2025, yet personal training and instruction are advancing at an 8.75% CAGR to 2031.
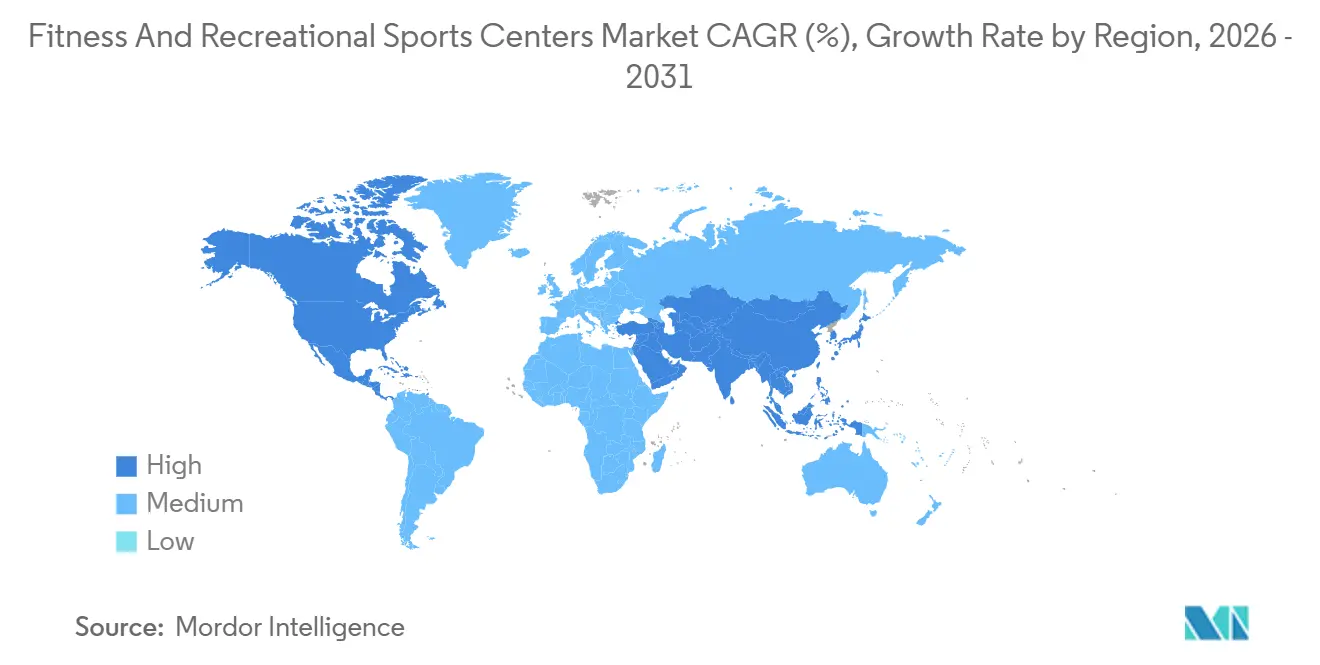
- By geography, North America led with a 38.44% share in 2025; Asia-Pacific is forecast to accelerate at a 9.43% CAGR through 2031.
Note: Market size and forecast figures in this report are generated using Mordor Intelligence’s proprietary estimation framework, updated with the latest available data and insights as of January 2026.
Market Trends and Insights
Drivers Impact Analysis of Fitness And Recreational Sports Centers Market*
| Driver | (~) % Impact on CAGR Forecast | Geographic Relevance | Impact Timeline |
|---|---|---|---|
| Rising Health and Wellness Awareness | +1.8% | Global, strongest in North America and Europe | Medium term (2-4 years) |
| Growth of Boutique and Specialized Formats | +1.5% | North America, Europe, Asia-Pacific urban hubs | Short term (≤ 2 years) |
| Expansion of Corporate Wellness Programs | +1.2% | North America, Europe, Singapore, Japan, Australia | Medium term (2-4 years) |
| Digital Integration and Smart Fitness | +1.0% | Global, led by North America and Asia-Pacific tech centers | Short term (≤ 2 years) |
| Aging Population and Preventive Adoption | +0.9% | Europe, North America, Japan, South Korea | Long term (≥ 4 years) |
| Rising Participation in Amateur Sports | +0.7% | Asia-Pacific, South America, Middle East and Africa | Medium term (2-4 years) |
| Source: Mordor Intelligence | |||
Rising Health and Wellness Awareness
Household spending patterns are shifting as preventive healthcare increasingly aligns with curative medical expenses, repositioning fitness centers from optional lifestyle services to essential health infrastructure. The Centers for Disease Control and Prevention (CDC) Active People, Healthy Nation initiative aims to engage 27 million participants by 2027, encouraging gym operators to adopt biometric tracking technologies to support compliance and public health reporting[1]Source: Centers for Disease Control and Prevention, “Active People, Healthy Nation,” CDC.GOV. In 2024, the World Health Organization estimated that physical inactivity costs the global economy USD 300 billion each year in healthcare spending, prompting governments in countries such as Germany, Singapore, and Australia to test tax credits tied to verified gym attendance[2]Source: World Health Organization, “Physical Activity,” WHO.INT. This policy shift effectively reframes membership fees as quasi-public funding, reducing operators’ dependence on discretionary consumer spending and helping stabilize revenues during economic slowdowns.
Growth of Boutique and Specialized Fitness Formats
Boutique fitness studios are capturing disproportionate revenue growth by unbundling the traditional gym model into instructor-led, format-specific classes that command price premiums of 40–60% over big-box memberships. Xponential Fitness operated 3,150 studios globally as of Q3 2024 and reported system-wide sales of USD 405.8 million, a 9% increase year over year. Brands such as Club Pilates, CycleBar, and StretchLab target distinct biomechanical niches. Its franchise model shifts real estate risk to licensees while centralizing instructor certification and data-driven class scheduling, enabling rapid expansion without balance-sheet strain. Yoga studios are projected to grow at an 8.53% CAGR through 2031, the fastest among facility types, as corporate wellness programs increasingly pair mindfulness with strength training to address burnout. At the same time, F45 Training and Orangetheory Fitness have scaled HIIT formats by integrating wearable heart-rate monitors that gamify performance, using real-time data and leaderboards to drive engagement, retention, and network effects.
Expansion of Corporate Wellness Programs
Employers are incorporating fitness subsidies into total compensation packages to mitigate healthcare cost inflation and reduce absenteeism, a trend that helps stabilize facility utilization during economic volatility. PwC's 2024 workforce survey found that 68% of multinational corporations now offer gym reimbursements or on-site fitness facilities, up from 42% in 2020. Fortune 500 companies allocate an average of USD 800 per employee annually to wellness benefits. Life Time Fitness reported that corporate partnerships accounted for 22% of new memberships in 2024, with contracts structured around utilization thresholds that tie pricing to documented employee engagement rather than flat per-capita fees. This shift from headcount-based to outcome-based pricing rewards operators who invest in biometric tracking and digital check-in systems that generate audit-ready attendance data. Singapore's Health Promotion Board expanded its corporate wellness grant in 2025, covering up to 50% of fitness program costs for employers who demonstrate measurable reductions in employee body mass index or blood pressure metrics[3]Source: Health Promotion Board, “Corporate Wellness Grants,” HPB.GOV.SG. Such public-private co-funding models are emerging in Japan, Australia, and the Netherlands, creating procurement tailwinds for chains that can navigate multi-stakeholder contracting and compliance reporting.
Digital Integration and Smart Fitness Adoption
Connected equipment and wearable integration are reshaping gyms into data-driven platforms, allowing operators to monetize performance insights while tailoring retention strategies at the individual level. In 2024, Planet Fitness announced plans to retrofit 1,200 locations with IoT-enabled cardio equipment compatible with Apple Watch, Fitbit, and Garmin, enabling members to track workouts across locations and receive algorithm-generated exercise recommendations. This level of interoperability helps address a major cause of churn, uneven equipment access, by supporting dynamic capacity management and nudging members toward underutilized time slots through push notifications. Peloton has similarly shifted its focus from hardware-led growth to B2B partnerships, installing connected bikes and treadmills in 800 hotel gyms and 200 corporate fitness centers by mid-2024 to generate recurring software licensing revenue amid softer direct-to-consumer demand. Boutique studios are also adopting smart mirrors and AI-based form-correction tools, which provide real-time biomechanical feedback, supporting premium pricing and reducing injury-related liability. At the same time, biometric check-in systems using facial recognition or fingerprint scans are being integrated with payment platforms, streamlining onboarding and cutting front-desk labor costs by 30–40%, a meaningful margin advantage in high-rent urban locations.
Restraints Impact Analysis of Fitness And Recreational Sports Centers Market*
| Restraint | (~) % Impact on CAGR Forecast | Geographic Relevance | Impact Timeline |
|---|---|---|---|
| High Capital Investment Requirements | -1.1% | Global, most acute in high-rent urban markets | Short term (≤ 2 years) |
| Limited Availability of Skilled Trainers and Staff | -0.8% | North America, Europe, Asia-Pacific developed markets | Medium term (2-4 years) |
| Regulatory and Licensing Challenges | -0.6% | Europe, Asia-Pacific, South America | Medium term (2-4 years) |
| Seasonal and Regional Fluctuations in Demand | -0.4% | North America, Europe, seasonal tourism markets | Short term (≤ 2 years) |
| Source: Mordor Intelligence | |||
High Capital Investment Requirements
High upfront facility launch costs, covering real estate, equipment, and technology infrastructure, create significant barriers to entry, concentrating market share among well-capitalized chains and limiting expansion into secondary cities. A mid-sized gym spanning 10,000–15,000 square feet typically requires an initial investment of USD 500,000 to USD 1.5 million, with cardio and strength equipment accounting for roughly 30-40% of the total costs, based on industry benchmarks from equipment manufacturers and real estate consultants. While boutique studios involve lower overall capital outlays, their per-square-foot costs are higher due to specialized requirements, such as flooring, mirrors, and audio systems. For example, a 2,000-square-foot yoga studio generally requires USD 150,000–300,000 in build-out capital. Long-term lease agreements in prime urban areas often span 10 years and include personal guarantees, exposing franchisees to sustained downside risk if membership growth falls short. Additional costs associated with smart-gym upgrades, including IoT-enabled equipment, biometric access systems, and integrated payment platforms, can add USD 100,000-250,000 to renovation budgets, making them difficult to justify for budget operators without clear evidence of improved retention. Although equipment financing and sale-leaseback models are becoming more common, interest-rate volatility in 2024–2025 has pushed borrowing costs higher, squeezing returns on new locations and slowing expansion plans for regional chains.
Regulatory and Licensing Challenges
Fragmented regulatory frameworks across countries impose significant administrative burdens and can slow market entry, especially for chains seeking multi-country expansion. Within the European Union, fitness facility standards vary widely: Germany mandates annual inspections by TÜV-certified auditors, France requires on-site CPR-trained staff throughout operating hours, and Spain enforces ventilation standards based on occupancy levels. ISO 9001 quality certifications are increasingly necessary for operators pursuing public-sector contracts or health insurance reimbursements, but the 12-18 month audit process and consulting fees of USD 20,000-50,000 often deter smaller, independent operators. In India, licensing requirements differ by state. Maharashtra demands fire-safety approvals that can take 6–9 months, while Karnataka requires environmental clearances for facilities over 5,000 square feet. In China, the General Administration of Sport ties operating licenses to instructor-to-member ratios (at least one certified trainer per 100 members) and mandates the presence of emergency medical equipment, such as automated external defibrillators, in facilities larger than 2,000 square meters, favoring operators with state backing. Liability insurance costs are also rising in North America and Europe, driven by litigation related to equipment injuries and lapses in supervision. For a mid-sized gym, annual premiums typically range from USD 10,000 to USD 30,000, adding to the financial burden of regulatory compliance.
*Our forecasts treat driver/restraint impacts as directional, not additive. The impact forecasts reflect baseline growth, mix effects, and variable interactions.
Fitness And Recreational Sports Centers Market Segment Analysis
By Facility Type:
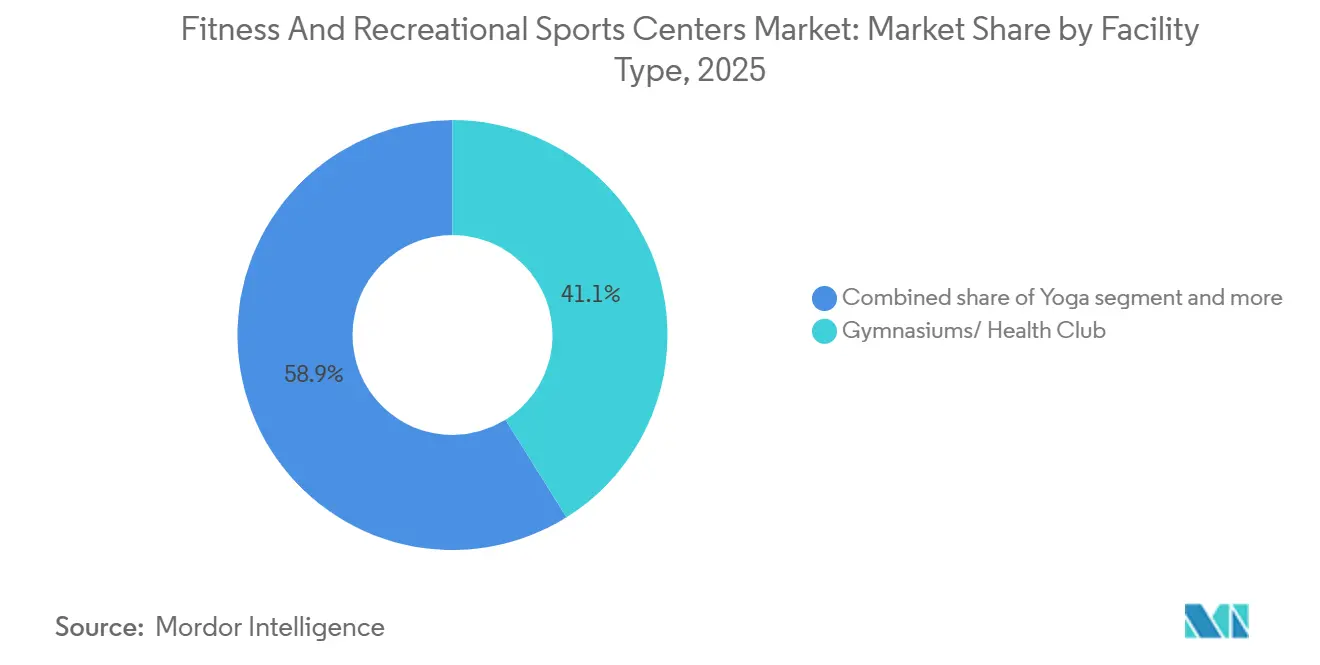
Boutique Formats Reshape Traditional Gym DominanceGymnasiums and health clubs held a 41.15% share of the market in 2025, driven by their ability to provide extensive equipment and multi-generational programming under one roof. Meanwhile, yoga studios are growing at an 8.53% CAGR through 2031, the fastest among facility types, as corporate wellness programs increasingly combine mindfulness training with traditional strength conditioning. Xponential Fitness, which franchises Club Pilates, CycleBar, StretchLab, and YogaSix, operated 3,150 studios globally by Q3 2024 and reported system-wide sales of USD 405.8 million, up 9% year over year, demonstrating how specialized formats support premium pricing and rapid franchise growth. Aerobic dance studios, including Zumba, barre, and dance cardio formats, are benefiting from TikTok-driven virality, where user-generated choreography videos spur trial memberships among Gen Z and millennial consumers. Handball facilities remain concentrated in Europe and South America, where municipal co-funding lowers operator capital requirements, while racquet sports are experiencing a resurgence, driven by pickleball’s 158% participation growth in the U.S. from 2020 to 2024, prompting operators to repurpose underutilized tennis courts (SFIA)[4]Source: Sports & Fitness Industry Association, “2024 Participation Report,” SFIA.ORG.
Swimming facilities are expanding in Middle Eastern markets, where extreme heat limits outdoor exercise. Saudi Arabia’s Vision 2030 sports strategy allocated USD 1.3 billion to aquatic center construction, aiming for 40% female participation in line with social-reform goals. Skating rinks face high energy costs for refrigeration, limiting profitability outside cold climates, yet operators in Canada and Scandinavia are maximizing utilization through multi-use programming such as hockey leagues, figure skating, and public sessions. The “Others” segment, including climbing gyms, trampoline parks, and functional-training studios, is attracting venture capital, with climbing gyms benefiting from the sport’s inclusion in the 2024 Paris Olympics, which boosted mainstream visibility. Planet Fitness, with 2,600 locations and 19.7 million members in Q3 2024, highlights the continued strength of low-cost, high-volume models. However, the company’s USD 1.1 billion revenue reflects average monthly dues of USD 10–25, limiting per-member profitability compared with boutique chains that can charge USD 150–300 per month.



By End-User:
Pediatric Fitness Outpaces Adult GrowthThe kids and children segment is expected to grow at a 9.24% CAGR through 2031, outpacing adult growth as municipalities introduce physical education alternatives and insurers pilot pediatric obesity-prevention reimbursement programs. Adults accounted for 46.26% of end-user revenue in 2025, driven by employer wellness subsidies and the increasing adoption of preventive fitness among older populations. However, youth programming is emerging as a key differentiator for operators seeking recession-resilient revenue streams. The CDC recommends 60 minutes of daily physical activity for children aged 6–17, yet only 24% of U.S. youth met this target in 2024, creating opportunities for school-gym partnerships and after-school programs. Life Time Fitness expanded its junior academy offerings in 2024, adding swim lessons, youth sports leagues, and STEM-integrated fitness camps with monthly fees ranging from USD 200 to USD 500, which is double the typical adult membership rate. The company also provides childcare that allows parents to work out.
Operators in the pediatric segment face stricter regulatory oversight, including mandatory background checks for instructors, child-to-staff ratios (typically 10:1 for ages 6-12), and facility requirements that separate youth zones from adult areas. India’s Fit India Movement prioritized school fitness infrastructure in 2024, allocating USD 150 million to upgrade 10,000 government schools with gym equipment and certified physical education teachers, creating opportunities for private operators to provide training and curriculum support. In Japan, declining birth rates have shifted focus toward senior programming, yet urban centers like Tokyo and Osaka are seeing a rise in boutique kids’ fitness studios offering parkour, martial arts, and obstacle-course training in response to parental demand for structured after-school activities. Growth in the adult segment is anchored by preventive fitness uptake among the 50-plus cohort, with operators incorporating telehealth consultations and chronic-disease management programs to capture Medicare and national health insurance reimbursements, allowing revenue streams to extend beyond traditional membership fees.
By Service Type:
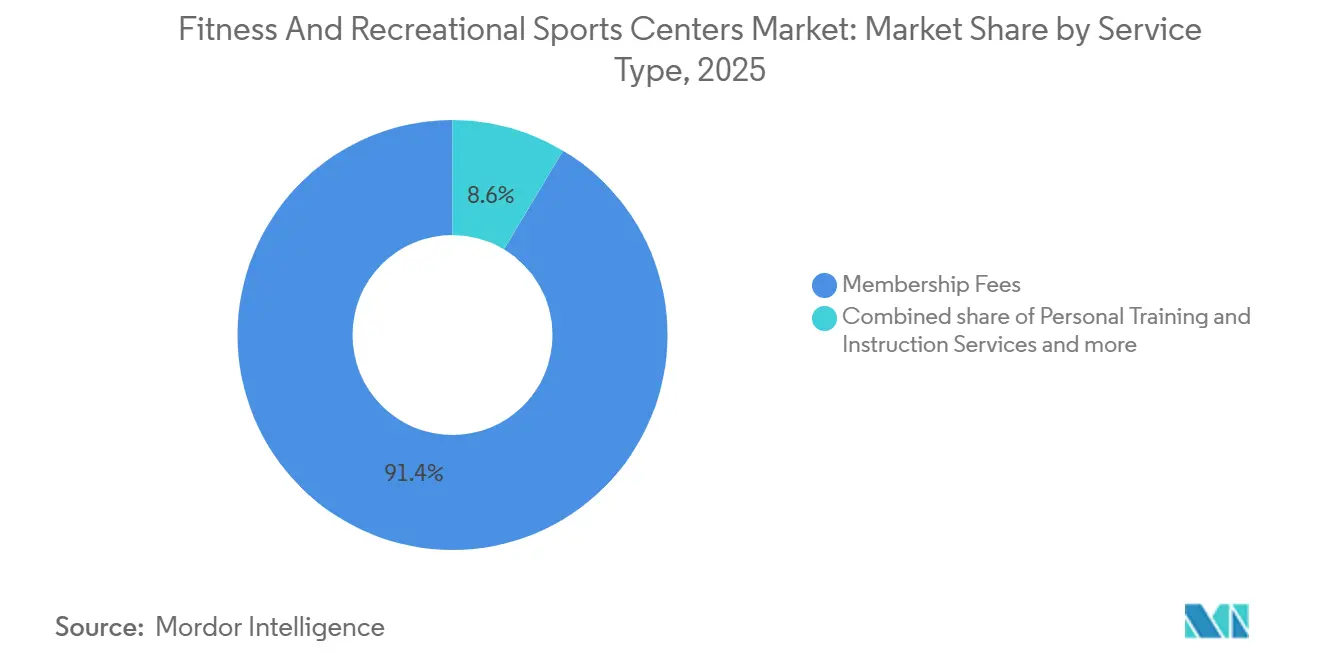
Personal Training Gains Share Amid Membership CommoditizationMembership fees accounted for 91.35% of service-type revenue in 2025, yet personal training and instructional services are growing at an 8.75% CAGR through 2031, reflecting consumers’ willingness to pay for outcome-focused programs as digital-only offerings diminish the value of equipment-access memberships. In North America, personal training sessions typically range from USD 50 to USD 150 per hour, while boutique studios offer small-group sessions (3–6 participants) at USD 30-60 per person to balance revenue with instructor capacity. Operators are increasingly integrating AI-powered form-correction tools and wearable technology to justify premium pricing, allowing trainers to manage larger client rosters without compromising personalized programming.
The “Other Service Type” segment, including nutrition counseling, physical therapy, spa treatments, and retail products such as apparel and supplements, is also expanding, providing non-dues revenue to offset membership commoditization. Equinox reported in 2024 that these ancillary services contributed 18% of total revenue, with in-house spa and nutrition offerings generating an average of USD 120 per member per month above base dues. Hybrid membership models, combining unlimited facility access with a set number of personal training sessions, are becoming more common, supported by algorithmic scheduling that maximizes trainer utilization and reduces idle time during off-peak hours. Certification bodies like NASM and ACE are expanding specialized credentials, covering areas such as pre- and post-natal fitness, sports-specific conditioning, and geriatric training, allowing trainers to charge higher rates and protect against commoditization (nasm.org; acefitness.org). Premium operators are increasingly adopting outcome-based pricing, where clients pay for measurable progress such as strength gains or body-composition changes rather than session time, creating margin upside for those investing in biometric tracking and data analytics.
Geography Analysis
North America Fitness and Recreational Sports Centers Market
North America accounted for 38.44% of the global market in 2025, driven by high per-capita gym spending, averaging USD 60-80 per month, and employer-sponsored wellness programs that help stabilize demand during economic uncertainty. The United States drives the bulk of regional revenue, with a clear split between low-cost operators, such as Planet Fitness, which charges USD 10–25 per month, and premium brands like Life Time, where monthly fees range from USD 150 to USD 300. In Canada, GoodLife Fitness operates more than 400 locations and is deepening its focus on corporate wellness partnerships. Meanwhile, in Mexico, growth is being seen in manufacturing centers such as Monterrey and Guadalajara, where multinational employers are subsidizing gym access to attract and retain skilled workers.
Europe Fitness and Recreational Sports Centers Market
Europe presents a fragmented landscape, with fitness penetration differing sharply by country. The UK supports more than 7,000 gyms and around 11 million members, Germany maintains a robust health-club culture reinforced by employer wellness policies, and Southern European markets such as Spain and Italy are growing faster from a lower spending base as household incomes recover. Budget operators are gaining scale: PureGym runs over 500 locations across the UK and Europe with 24-hour, no-contract models, while Netherlands-based Basic-Fit expanded to more than 1,300 clubs across six countries by 2024, using centralized procurement and marketing to pressure independent operators. However, varying national regulations, ranging from Germany’s TÜV inspections to France’s staffing requirements and Spain’s ventilation standards, raise compliance costs and tend to favor larger chains with dedicated regulatory capabilities.
APAC, MEA and South America Fitness and Recreational Sports Centers Market
Asia-Pacific is the fastest-growing region, projected to expand at a 9.43% CAGR through 2031, driven by urbanization, rising incomes, and state-led investment in sports infrastructure. China anchors regional growth, supported by the State Council’s USD 687 billion sports industry target by 2025 and a base of more than 500 million regular exercisers, with operators benefiting from land-lease incentives near transit hubs. India’s fitness market reached USD 2.6 billion in 2024 and is growing 8–10% annually under the Fit India Movement, which links licensing to accessibility and air-quality standards. Japan’s USD 4 billion market emphasizes aging-population services, including fall-prevention programs tied to national health insurance reimbursements, while Australia’s AUD 3.1 billion industry is expanding functional training formats. In South America, Brazil’s market contracted in 2024 amid inflation and currency pressure, though Chile and Colombia are seeing steady middle-class demand via flexible pricing and hybrid models. The Middle East and Africa are benefiting from government-backed wellness initiatives, notably Saudi Arabia’s Vision 2030 investment in aquatic facilities and the UAE’s corporate wellness mandates, while growth in Africa remains concentrated in major urban centers such as Johannesburg and Cape Town due to infrastructure constraints elsewhere.

Regulatory Landscape
Regulation for fitness and recreational sports centers is fragmented across countries and, in large markets, across sub-national jurisdictions, which creates uneven compliance costs for multi-site operators. In the United States, the Health & Fitness Association tracked more than 160 fitness-relevant bills considered in 2025, with 21 enacted, with emphasis on consumer protection topics such as pricing transparency and auto-renewal rules. At the state level, South Carolina approved Act 4635 on June 30, 2026, allowing electronic notification for automatic contract renewals. Alongside contract and consumer-protection rules, operators face inspection, sanitation, and safety obligations that vary by market, and liability insurance costs add an ongoing compliance-linked operating expense.
Staffing models and service design also get shaped by rules tied to professional credentialing and facility standards. In the European Union, requirements differ materially, including Germany's TÜV-related inspection practices, France's CPR-trained staff coverage during operating hours, and Spain's ventilation standards based on occupancy. In Asia-Pacific, Sport Singapore tightened professional standards for registered exercise professionals, with mandatory Basic Exercise Science (BES) certification for National Registry of Exercise Professionals (NREP)-registered professionals effective June 1, 2026, increasing the importance of recognized certifications for operators offering instruction-led services and corporate wellness programs.
Competitive Landscape
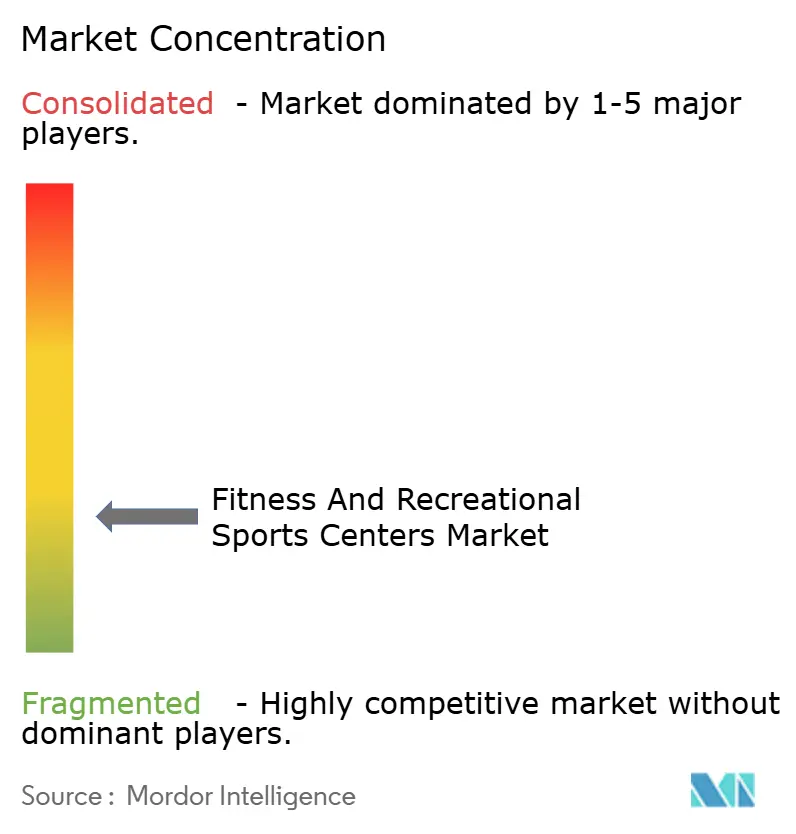
The fitness and recreational sports centers market remains highly fragmented, with no single operator holding more than 5% of the global share. This structure leaves meaningful room for regional players to tailor programming to local preferences and secure favorable municipal real estate arrangements. Planet Fitness, with 19.7 million members across 2,600 locations in Q3 2024 and USD 1.1 billion in revenue, exemplifies the high-volume, low-touch model built on minimal staffing and low monthly fees. At the opposite end, Life Time serves 777,000 members through 172 luxury athletic resorts, generating USD 2.4 billion in revenue in 2023 by bundling personal training, spa services, childcare, and premium amenities that support monthly dues of USD 150 to USD 300.
Xponential Fitness occupies a middle ground through its franchise-led strategy, operating 3,150 studios globally and posting system-wide sales of USD 405.8 million in Q3 2024. While shifting real-estate risk to franchisees, it retains centralized control over instructor certification and data-driven class scheduling, allowing for efficient scaling without heavy balance-sheet exposure. Technology is increasingly shaping competitive advantage. Planet Fitness’s rollout of IoT-enabled cardio equipment in 2024, compatible with Apple Watch, Fitbit, and Garmin devices, aims to reduce churn by allowing members to track workouts across locations and by enabling operators to manage crowding through algorithmic capacity planning. At the same time, newer formats such as climbing gyms and functional-training studios are attracting venture capital, aided by heightened visibility from climbing’s inclusion in the 2024 Paris Olympics.
Established operators are also pushing deeper into ancillary services to counter membership commoditization: Equinox reported that spa, nutrition, and related offerings contributed 18% of total revenue in 2024, adding roughly USD 120 per member each month beyond base dues. Corporate wellness partnerships are further reshaping competition, with Life Time noting that 22% of new memberships in 2024 came through employer contracts tied to measured utilization rather than flat fees. As regulatory requirements tighten, certifications such as ISO 9001 are becoming prerequisites for public-sector and insurer-linked revenue streams, though the time and cost of compliance continue to disadvantage smaller independents. Secondary cities offer untapped potential due to lower real-estate costs and limited incumbent presence, but high upfront capital needs and shortages of qualified trainers remain key constraints on rapid expansion.
Fitness And Recreational Sports Centers Industry Leaders
Planet Fitness
Life Time Fitness
Basic-Fit
LA Fitness
Anytime Fitness
- *Disclaimer: Major Players sorted in no particular order
Fitness And Recreational Sports Centers Market Companies Covered in this Report
- Planet Fitness
- Basic‑Fit
- LA Fitness
- 24 Hour Fitness
- Anytime Fitness
- Life Time Fitness
- Equinox
- Gold’s Gym
- Snap Fitness
- F45 Training
- Orangetheory Fitness
- Crunch Fitness
- PureGym
- David Lloyd Leisure
- Virgin Active
- GoodLife Fitness
- YMCA
- CrossFit
- Town Sports International
- XSport Fitness
Read Analysis of Fitness And Recreational Sports Centers Companies

Market Opportunities and Future Outlook
Opportunities are expanding where fitness participation is being formalized into reimbursable, measurable wellness activity, pushing operators to build audit-ready engagement and outcome tracking. In the United States, fitness center penetration reached 26.1% of the population ages 6+ in 2025, representing 81 million members, and this scale supports productization of corporate and insurer-linked programs that depend on reliable check-in data and program compliance. Operators that invest in interoperable digital experiences (for example, Planet Fitness retrofitting 1,200 locations with IoT-enabled cardio equipment compatible with major wearables) have a pathway to monetize beyond access-based dues through utilization-linked contracts, capacity-managed scheduling, and add-on services tied to tracked activity.
Service whitespace is also showing up around strength training, recovery, mental wellness, and other holistic health services, particularly for cohorts willing to add discretionary spending inside clubs. Health & Fitness Association reporting points to Gen Z and Millennials as 60% of discretionary fitness spending growth, which aligns with demand for integrated recovery, meditation, and wellness add-ons inside clubs rather than equipment-only access. Premium multi-service operators already demonstrate how non-dues offerings can scale, with Equinox reporting ancillary services as 18% of revenue in 2024, while budget and mid-market chains can respond with tiered memberships, partner-led experiences, and standardized programs built for rollout across fragmented regulatory environments.
Recent Industry Developments in Fitness And Recreational Sports Centers Market
- July 2026: Planet Fitness, Inc. announces an Apple Music partnership to offer up to three free months for new members during July 20 to July 31, 2026. The alliance broadens engagement channels and accelerates member onboarding through bundled digital experiences.
- July 2026: BravoFit (Planet Fitness Australia) reports that Franchise Equity Partners acquire a 52.5 percent stake to fund future club expansion. The capital infusion strengthens Australia portfolio and accelerates growth plans in the APAC market.
- July 2026: United PF Holdings, the largest Planet Fitness franchisee, negotiates with lenders for a debt-for-equity swap. The transaction reshapes franchisor franchisee finance dynamics and could alter expansion pace.


Fitness And Recreational Sports Centers Market Report Scope and Research Methodology
Market Definition and Coverage
This market covers the revenue earned by fitness and recreational sports centers from delivering in-facility fitness and sports services to paying users, including memberships and activity-based service fees across major regions.
Scope exclusions: We exclude at-home fitness content, equipment-only retail sales, and pure digital subscriptions that do not grant access to a physical facility.
Segments Covered in This Report
- By Facility Type
- Gymnasiums/ Health Club
- Yoga
- Aerobic Dance
- Handball Sports
- Racquet Sports
- Skating
- Swimming
- Others
- By End-User
- Adults
- Kids/Children
- By Service Type
- Membership Fees
- Personal Training and Instruction Services
- Other Service Type
- By Geography
- North America
- United States
- Canada
- Mexico
- Rest of North America
- Europe
- Germany
- United Kingdom
- Italy
- France
- Spain
- Netherlands
- Poland
- Belgium
- Sweden
- Rest of Europe
- Asia-Pacific
- China
- India
- Japan
- Australia
- Indonesia
- South Korea
- Thailand
- Singapore
- Rest of Asia-Pacific
- South America
- Brazil
- Argentina
- Colombia
- Chile
- Peru
- Rest of South America
- Middle East and Africa
- South Africa
- Saudi Arabia
- United Arab Emirates
- Nigeria
- Egypt
- Morocco
- Turkey
- Rest of Middle East and Africa
- North America
Data Sources, Market Sizing, and Validation
Desk Research
Desk research was used to map the industry footprint and to ground the model in repeatable, public signals. We referenced sources such as the US Census Bureau (NAICS services output and counts), the US Bureau of Labor Statistics (employment and wage series tied to sports and fitness facilities), Eurostat structural business statistics, and national statistics offices in major countries that publish services turnover.
To make the inputs practical, we also reviewed illustrative materials from global and national fitness and sports associations, public health bodies that track physical activity participation, and city or municipal recreation departments that report facility utilization. Company filings, investor presentations, and reputable press coverage were used to cross-check pricing changes, membership trends, and expansion plans. Where needed, we supplemented with paid subscriptions for company financials and intelligence, news and financials, and a patent database to understand equipment and facility innovation cues. These sources are not exhaustive, and many other references were used for data collection, validation, and clarification during the study.
Primary Interviews and Surveys
Primary work focused on validating how revenue is actually earned across facility formats and geographies, and then pressure-testing the assumptions used in the model. We spoke with operators, industry advisors, and downstream stakeholders such as landlords, trainers, and corporate wellness buyers across APAC, EMEA, and the Americas, so gaps in participation, pricing, and utilization could be addressed before the totals were finalized.
Distribution of primary research fieldwork respondents
| Company type | Respondent position | Region |
|---|---|---|
| Top tier: 33% | CXOs: 17% | APAC: 42% |
| Mid tier: 45% | Functional/Unit leaders: 35% | EMEA: 37% |
| Smaller Players: 22% | Managers: 48% | Americas: 21% |
Market-Sizing & Forecasting
Sizing starts with a top-down build that reconstructs the demand pool using country level services turnover, facility counts, and participation indicators, and then converts that into center revenue by applying realistic price and utilization assumptions. Once that structure was in place, we corroborated the totals with selective bottom-up approximations such as sampled membership fee levels, personal training attachment rates, and supplier and channel checks on facility openings and closures.
Inputs that were tracked (illustrative) include active membership or participation rates by age group, average monthly dues and joining fees, personal training take-up, class or court utilization patterns, and the pace of new club openings versus closures. When the public trail was thin for a country, we used proxy variables like urban population share, household discretionary spend signals, and employment in sports and fitness services, and then adjusted the implied revenue per facility through interview feedback.
For forecasting, scenario analysis was used so that changes in pricing, retention, and utilization could be flexed separately, followed by an ARIMA check on the consolidated revenue trend to flag unrealistic jumps. The final forecast curve was accepted only after the variable level direction (price progression, participation, and facility count momentum) matched what practitioners said they expect over the next five years.
Data Validation & Update Cycle
Outputs were validated through triangulation across independent signals, including the implied revenue per facility, implied spend per participant, and year over year growth versus services indicators. When any region showed a sharp variance, the drivers were rechecked, and targeted follow-ups were triggered with respondents to confirm whether pricing, closures, or utilization shifts explained the change.
Before sign-off, the model goes through a multi-step analyst review where assumptions, unit consistency, currency conversion timing, and CAGR math are checked again. Reports are refreshed annually, and interim updates are added when material events occur that can move demand or pricing. Right before delivery, a final pass is completed so clients receive the most up-to-date view available.
Mordor Intelligence's Fitness and Recreational Sports Centers Market Size Compared With Other Published Estimates
Published market values for fitness and recreational sports centers can look far apart because the underlying scope and the revenue lines counted are not the same, even when the titles sound similar. Differences in facility coverage, the way membership and add-on services are treated, and how currencies and inflation are handled across countries usually create the biggest spread.
Some published numbers narrow the view to admissions only or to classic gym and health club dues, and some others broaden it by blending in adjacent recreation services that do not operate like membership-based centers. In Mordor Intelligence, the market total is counted only when revenue is earned by fitness and recreational sports centers from memberships and on-site service lines such as instruction and personal training, and then it is rolled up consistently across regions using the same currency timing and validation checks.
Benchmark comparison
| Source | Market Size | Gaps in Research Methodology |
|---|---|---|
| Mordor Intelligence | USD 159.39 B (2026) | |
| Trade Journal A | USD 80.95 B (2024) | Uses an earlier base year and appears to focus on a narrower revenue concept closer to gym and sports center admissions, which can omit recurring membership value and add-on instruction services in many countries. |
| Industry Database B | USD 163.30 B (2025) | Tracks gyms and fitness centers with a broad country coverage, but the category treatment can differ for multi-sport recreational centers and bundled services, and the year alignment and currency timing do not match the 2026 base used here. |
The comparison mainly shows that scope choices and base-year alignment can move the headline value more than the growth math itself. By tying the total to clearly defined center-generated revenue streams, and then checking implied revenue per facility and spend per participant, the estimate stays traceable to inputs that a buyer can audit and re-run.


Key Questions Answered in the Report
How large is the fitness and recreational sports centers market today?
Global revenue reached USD 159.39 billion in 2026 and is set to climb to USD 235.47 billion by 2031 at an 8.12% CAGR.
Which region will grow the fastest through 2031?
Asia-Pacific is forecast to post a 9.43% CAGR, supported by China’s sports infrastructure goals and India’s Fit India policies that lower licensing barriers.
Which facility format is expanding most quickly?
Yoga studios lead with an 8.53% CAGR through 2031 as corporations bundle mindfulness with traditional exercise in wellness contracts.
Why are personal training services gaining share?
Consumers are paying for measurable outcomes; sessions priced at USD 50–150 per hour outpace basic memberships as AI tools let trainers handle more clients.
What role do corporate wellness programs play?
Two-thirds of multinationals now subsidize gym use, and utilization-based contracts supply stable traffic and diversified revenue for operators.
Page last updated on:


 Your data is secure and never sold or shared.


