Football Market Size and Share
Market Overview
| Study Period | 2021 - 2031 |
|---|---|
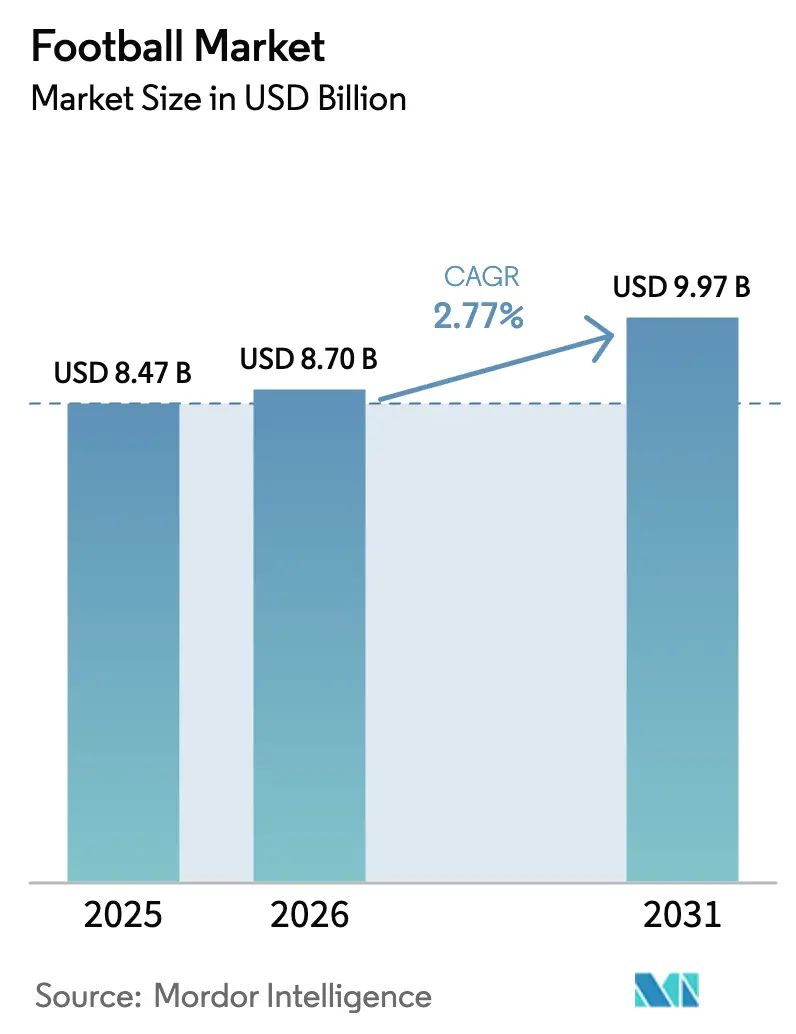
| Market Size (2026) | USD 8.70 Billion |
| Market Size (2031) | USD 9.97 Billion |
| Growth Rate (2026 - 2031) | 2.77% CAGR |
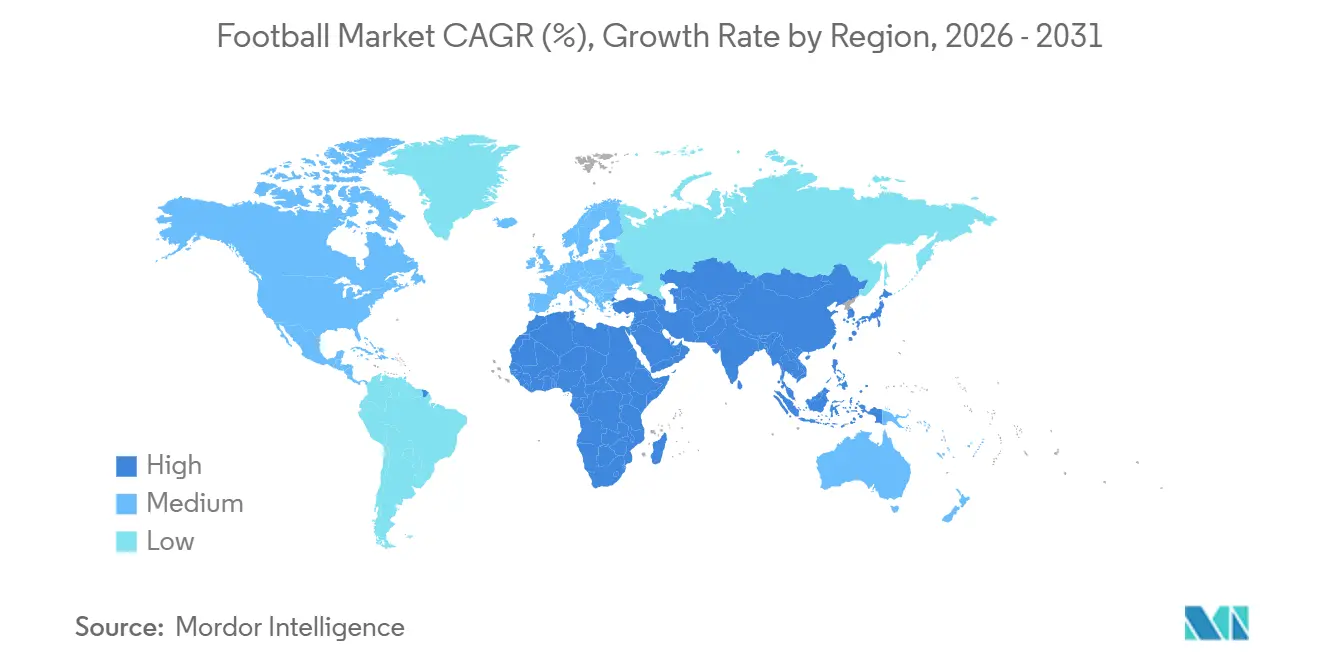
| Fastest Growing Market | Asia Pacific |
| Largest Market | Europe |
| Market Concentration | Medium |
Major Players
*Disclaimer: Major Players sorted in no particular order Image © Mordor Intelligence. Reuse requires attribution under CC BY 4.0. |
|
Football Market Analysis by Mordor Intelligence
The global football market size recorded at USD 8.47 billoin in 2025, and reached USD 8.70 billion in 2026 and is projected to attain USD 9.97 billion by 2031, reflecting a CAGR of 2.77% over the period. Despite certain segments of the gaming industry experiencing stagnation, live-match attendance continues to demonstrate strong engagement, highlighting the enduring appeal of in-person stadium experiences. Digital commerce is witnessing significant acceleration as brands increasingly integrate loyalty programs with online-exclusive offerings. At the same time, offline retail stores maintain their relevance by catering to consumers' preference for tactile shopping experiences. Sialkot, Pakistan, serves as a critical manufacturing hub, contributing significantly to global football production. This concentration provides notable scale efficiencies but also exposes the supply chain to potential geopolitical risks. In Europe and North America, the adoption of premium sensor-enabled footballs is driving an increase in average selling prices. Conversely, in regions such as Asia and Africa, mass-market PVC footballs continue to dominate in terms of volume. Suppliers that successfully combine technological innovation with cost-effective production strategies are well-positioned to capture market share across both grassroots and elite segments of the football market.
Key Report Takeaways
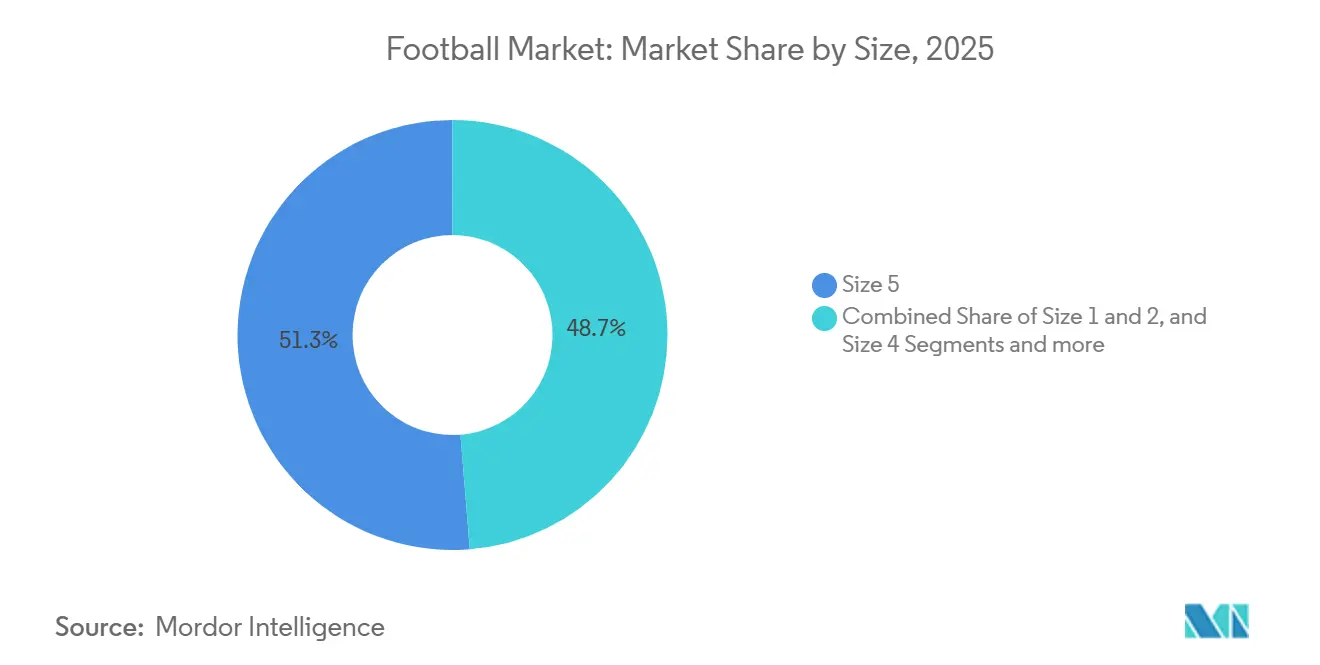
- By size, Size 5 led with 51.28% revenue share in 2025, while Size 1 and 2 segments are projected to grow at a 2.98% CAGR through 2031.
- By category, mass-market balls accounted for 76.32% of the football market share in 2025, while premium balls are forecast to expand at a 3.28% CAGR through 2031.
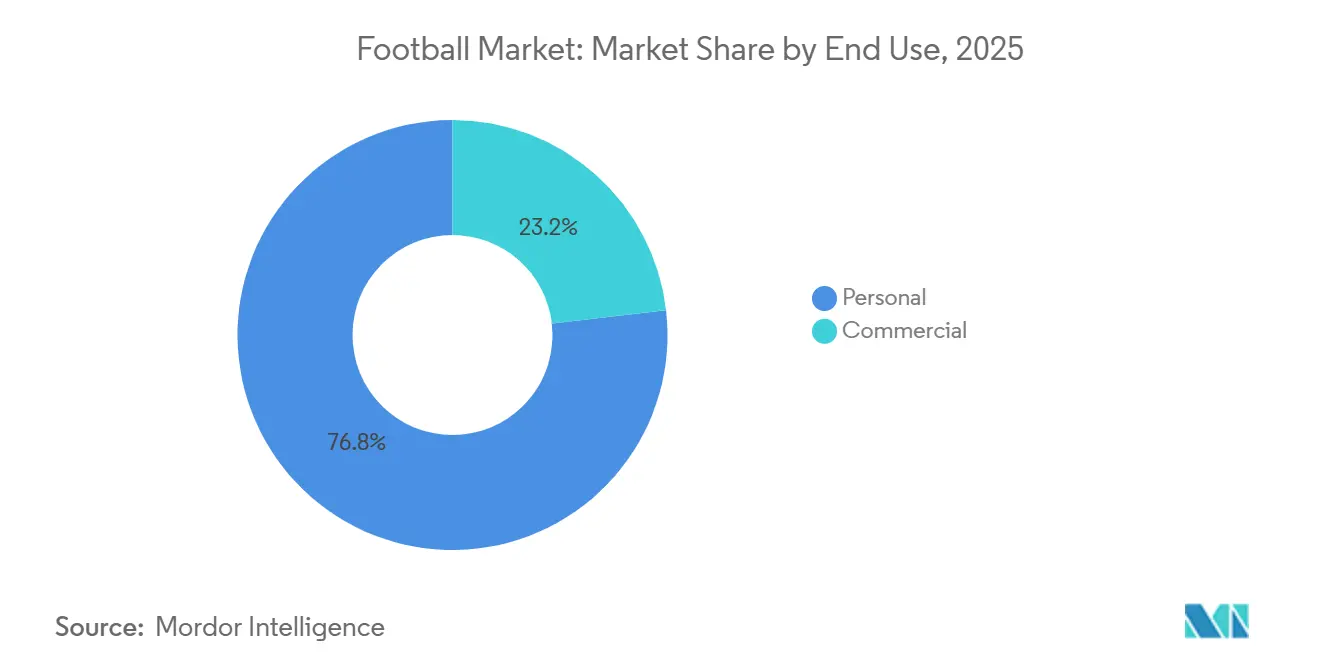
- By end use, personal purchases held 76.83% of the football market share in 2025, while commercial demand is set to grow at a 3.35% CAGR through 2031.
- By distribution channel, offline stores captured 84.79% share of the football market size in 2025, while online stores are advancing at a 3.85% CAGR through 2031.
- By region, Europe held a 41.21% share in 2025, while Asia-Pacific is expected to register a 4.22% CAGR to 2031.
Note: Market size and forecast figures in this report are generated using Mordor Intelligence’s proprietary estimation framework, updated with the latest available data and insights as of January 2026.
Global Football Market Trends and Insights
Drivers Impact Analysis*
| Driver | (~) % Impact on CAGR Forecast | Geographic Relevance | Impact Timeline |
|---|---|---|---|
| Rising popularity of football as a global sport | +0.6% | Global, with accelerated gains in Asia-Pacific (China, India, Southeast Asia) and Middle East (Saudi Arabia, UAE) | Long term (≥ 4 years) |
| Growth of professional leagues and competitions | +0.5% | Europe (established), Asia-Pacific (emerging), Middle East (rapid expansion) | Medium term (2-4 years) |
| Technological advancements in football manufacturing | +0.4% | Global, with premium adoption concentrated in Europe and North America | Medium term (2-4 years) |
| Rising sponsorships and partnerships from brands | +0.3% | Global, with highest intensity in Europe and emerging concentration in Middle East | Short term (≤ 2 years) |
| Expansion of football merchandise and licensing | +0.2% | Europe, Asia-Pacific, North America | Medium term (2-4 years) |
| Development of youth and grassroots football programs | +0.5% | Global, with institutional scale in Europe and accelerating investment in Asia-Pacific and Africa | Long term (≥ 4 years) |
| Source: Mordor Intelligence | |||
Rising popularity of football as a global sport
Football's growing popularity is significantly driving the global market, with a notable rise in demand for broadcasting rights, sponsorships, and merchandise. This growth is propelled by extensive fan bases, the appeal of global tournaments such as the World Cup, and increasing participation rates, particularly among youth and women. These factors are generating substantial revenue streams across various segments, including media, apparel, equipment, and digital platforms, thereby expanding the economic ecosystem from elite professional clubs to grassroots initiatives. For example, Sport England reported that in 2024, 40% of children in England participated in football, highlighting the sport's widespread appeal [1]Source: Sport England, "Active Lives Children and Young People Survey", sportengland.org. Institutional investments and advancements in digital engagement are further enhancing football's global reach, ensuring consistent demand for equipment across all levels of participation. During the 2024/25 season, UEFA competitions attracted over 240 million spectators, showcasing the sport's ability to drive cross-border consumer spending [2]Source: Union of European Football Associations, "Five European football trends", uefa.com. This immense popularity translates into increased equipment sales through two primary channels: direct participation, which includes schools, amateur clubs, and personal use, and aspirational purchases, often influenced by the excitement surrounding major tournament cycles.
Growth of professional leagues and competitions
As leagues continue to expand and diversify their competition formats, they are unlocking new commercial opportunities, which are driving a surge in institutional ball procurement. This evolving model is being replicated across Asia. For instance, India's Indian Super League has significantly increased its viewership base, which has, in turn, attracted lucrative multi-year broadcast agreements, further solidifying its market presence. Similarly, in China, multi-club ownership groups are implementing standardized equipment specifications across their portfolio of clubs. This standardization creates economies of scale, benefiting suppliers capable of meeting centralized procurement requirements efficiently. In Europe, the introduction of post-season playoffs and modifications to league formats are contributing to an increase in match inventory, thereby enhancing commercial potential. Additionally, Puma's forthcoming five-year partnership with the Premier League, set to commence in the 2025/26 season and replacing Nike, highlights the critical role of league rights in shaping market dynamics. These rights not only amplify brand visibility but also necessitate significant research and development investments. Suppliers are required to develop footballs that consistently meet FIFA Quality Pro standards, ensuring optimal performance under varying weather conditions and across diverse pitch surfaces throughout the league's 38 matchweeks.
Technological advancements in football manufacturing
Manufacturers are dividing the market into mass-produced training balls and premium, sensor-embedded products that command 3-5 times higher prices. Adidas's Connected Ball Technology, featured at the 2024 UEFA Euro tournament, includes a 500Hz inertial measurement unit. This technology transmits real-time positional data, enabling VAR officials to make offside decisions with millimeter precision and providing broadcasters with advanced analytics. Select Sport's iBalls, integrated with KINEXON sensors and certified with FIFA Quality Pro, extend these advanced features to training environments. Coaches can now assess shot velocity, spin rate, and trajectory consistency, metrics previously confined to laboratory testing. In the premium segment, thermal bonding has replaced hand-stitching, reducing water absorption by up to 40%. This ensures panel durability against friction from artificial turf, a critical requirement as synthetic pitches become more prevalent in Asia and the Middle East. Sustainability is emerging as a key differentiator: Puma's RE: FIBRE initiative, which incorporates recycled polyester and water-based inks, appeals to federations and clubs aiming to meet environmental, social, and governance (ESG) goals. However, the associated cost premiums currently restrict adoption to elite tiers.
Rising sponsorships and partnerships from brands
Sponsorship capital is reaching unprecedented levels in football, but its allocation is evolving. Instead of distributing resources across numerous athletes, brands are now focusing on high-profile superstars and league-level collaborations. Nike, for example, has streamlined its endorsements by discontinuing deals with aging stars like Kane, Neymar Jr., and Casemiro, redirecting its efforts toward emerging generational talents such as Haaland, Mbappé, and Musiala. Additionally, Nike is adopting a vertical integration strategy by withdrawing products from wholesale channels and emphasizing direct distribution. This approach reflects Nike's belief that fewer, high-impact partnerships can deliver stronger returns on investment, particularly through social media amplification and exclusive product launches. Similarly, Under Armour's March 2025 announcement as the NFL's official footwear and glove partner highlights a comparable strategy in American football. This shift indicates that brands are prioritizing institutional partnerships over athlete-focused marketing, especially during periods of economic uncertainty.
Restraints Impact Analysis*
| Restraint | (~) % Impact on CAGR Forecast | Geographic Relevance | Impact Timeline |
|---|---|---|---|
| Growing popularity of online gaming | -0.4% | Global, with highest substitution effect in North America, Europe, and urban Asia-Pacific | Short term (≤ 2 years) |
| High equipment and infrastructure costs limit accessibility | -0.3% | Africa, South Asia, South America (rural areas), parts of Southeast Asia | Long term (≥ 4 years) |
| Availability of counterfeit products | -0.2% | Asia-Pacific (China, India, Southeast Asia), Africa, South America | Medium term (2-4 years) |
| Economic volatility and inflation impact sponsorship budgets | -0.3% | Global, with acute pressure in Europe and North America; emerging-market currency depreciation amplifies impact | Short term (≤ 2 years) |
| Source: Mordor Intelligence | |||
Growing popularity of online gaming
The growing intersection between physical football and video game engagement introduces a substitution risk. An EA executive noted that younger fans increasingly discover football through video games rather than attending matches, leading to a generation whose primary connection to the sport is digital. This trend carries notable commercial implications. The substitution occurs in two key ways: time spent gaming reduces the hours available for physical play, and spending on in-game microtransactions, such as Ultimate Team packs, competes with discretionary spending on physical football equipment. The expansion of internet access further supports online gaming. For example, the International Telecommunication Union estimated that by 2025, approximately 6 billion people, about three-quarters of the global population, will have internet access, up from 5.8 billion in 2024 [3]Source: International Telecommunication Union, "Global number of Internet users increases", itu.int. If digital engagement declines, physical football equipment could see a resurgence, especially if clubs and federations enhance grassroots programs to rebuild physical participation rates among Gen Z.
High equipment and infrastructure costs limit accessibility
Cost barriers hinder market expansion in regions with the highest latent demand, limiting potential volume growth. A FIFA Quality Pro ball, priced at USD 100–150, represents several days' wages in sub-Saharan Africa and South Asia. Additionally, installing synthetic turf for a full-size pitch costs making it unaffordable for municipalities in lower-income countries. Sialkot's global production dominance stems from its labor cost advantages, but these benefits are insufficient in markets with lower per-capita incomes. Infrastructure challenges further intensify the issue: India's ISL expansion faces obstacles due to a lack of FIFA-standard pitches, forcing clubs to share facilities and reduce training hours. This constraint not only impacts training but also extends equipment wear rates and replacement cycles. To address these challenges, suppliers have introduced tiered product lines: mass-market balls with PVC covers and butyl bladders are priced at USD 10–20. Although these balls trade off durability and performance, they effectively expand market accessibility.
*Our forecasts treat driver/restraint impacts as directional, not additive. The impact forecasts reflect baseline growth, mix effects, and variable interactions.
Segment Analysis
By Size: Youth Training Drives Fastest Growth
In 2025, Size 5 balls, the official standard for players aged 12 and older, accounted for 51.28% of the market share, highlighting their importance in both professional competitions and adult recreational activities. Meanwhile, Size 1 and 2 balls, measuring 18-20 inches in circumference and primarily designed for skill development among children under 8, are expected to grow at a rate of 2.98% through 2031, representing the fastest growth within the size segmentation. This growth is largely driven by FIFA's "Football for Schools" initiative, which works with national education ministries to distribute age-appropriate equipment. This strategy bypasses traditional retail channels and ensures a steady demand for smaller sizes. Size 3 balls, commonly used by players aged 8-12, occupy a moderate position in terms of both volume and growth. In contrast, Size 4 balls, previously the standard for youth competitions aged 8-12 in certain regions, are increasingly being replaced. Many leagues are shifting to Size 5 for players as young as 10 to accelerate skill development.
These trends indicate that suppliers must optimize production lines to accommodate different size specifications, each with distinct margin characteristics. While Size 1 and 2 balls generate lower revenue per unit, their high turnover, driven by institutional procurement, offsets this limitation. Conversely, Size 5 balls command premium pricing due to technological advancements. For instance, innovations like Adidas's "Connected Ball" and Select's "iBalls" are exclusively available in Size 5. This exclusivity stems from challenges such as sensor miniaturization and battery life, which make smaller sizes economically unviable at current cost levels. Additionally, Molten's AFC Asian Qualifiers ball, designed with heat-resistant adhesives for artificial turf and high-temperature conditions, demonstrates the R&D investments that are feasible for Size 5 but not for smaller sizes. Manufacturers focusing on Asia-Pacific growth must address these complexities: China's school football programs prioritize Size 4 and 5 balls, while India's grassroots initiatives favor Size 3. This requires localized inventory strategies, increasing working capital demands but aligning with regional demand patterns.


By Category: Premium Technology Commands Price Premiums
In 2025, mass-market footballs accounted for 76.32% of the market share. These footballs, designed for recreational players, schools, and amateur clubs, focused on affordability rather than performance. Conversely, premium footballs, featuring advancements like thermal bonding, sensor technology, and FIFA Quality Pro certification, are projected to grow at a rate of 3.28% through 2031. This growth rate surpasses the market average by 51 basis points, driven by their adoption in professional leagues and elite training academies. Adidas's FUSSBALLLIEBE exemplifies this premium segment. Priced at EUR 150 (approximately USD 163) and set to debut in UEFA Euro 2024, the ball incorporates a 500Hz IMU sensor. This technology enables real-time offside detection and provides broadcasters with trajectory analytics, justifying its 5-7x price premium over mass-market alternatives. Similarly, Select Sport's iBalls, which have earned FIFA Quality Pro certification and feature integrated KINEXON sensors, extend these capabilities to training environments. These sensors allow coaches to measure shot metrics, a capability previously confined to lab testing.
Mass-market footballs, typically made with PVC covers and butyl bladders, compete primarily on price and durability. These affordable products drive the market's volume. For example, Decathlon's expansion in India, with a goal of achieving 85% local sourcing by 2026, relies on strong demand for mass-market footballs in tier-2 and tier-3 cities, where lower income levels limit premium product adoption. This market segmentation has created distinct competitive dynamics: premium brands like Adidas, Select, and Molten focus on innovation and partnerships with federations, while mass-market players such as Decathlon, Baden, and unbranded manufacturers emphasize distribution reach and cost efficiency. Puma, aiming to capture a share of the premium market, has secured a partnership with the Premier League for the 2025/26 season. By leveraging the league's visibility, Puma seeks to justify higher price points. However, the brand faces execution risks due to recent financial challenges and inventory issues.
By End Use: Institutional Procurement Accelerates
In 2025, personal use represented a significant 76.83% of sales, catering to recreational players, amateur clubs, and individuals purchasing for training or casual play. Meanwhile, the commercial sector, encompassing training academies, professional clubs, schools, and municipal sports programs, is expected to grow at a rate of 3.35% through 2031. This growth, the highest among end-use segments, is driven by increased institutional investments in football infrastructure and youth development. Saudi Arabia's preparations for the 2034 World Cup, including plans for 15 new stadiums, are driving demand for match balls, training equipment, and youth development kits. Procurement is anticipated to favor suppliers certified under the FIFA Quality Programme. In China, multi-club ownership groups are standardizing equipment specifications across their clubs, enabling suppliers who meet these centralized requirements to achieve economies of scale and maintain consistent quality across regions.
Personal-use demand is highly elastic, contracting during economic downturns and expanding during tournament cycles when aspirational purchasing spikes. However, the faster growth of the commercial segment reflects a structural shift: as federations and clubs professionalize operations and adopt ESG commitments, they increasingly prefer established suppliers. These suppliers are chosen for their use of sustainable materials, such as recycled polyester and water-based inks, and compliance with performance certifications like FIFA Quality Pro and ISO standards. This trend aligns with Under Armour's expansion into team sports, marked by partnerships with USA Football and the NFL. Such initiatives highlight a similar pattern in American football, where institutional relationships provide revenue stability, mitigating the impact of fluctuations in consumer spending.
By Distribution Channel: Digital Commerce Gains Share
In 2025, offline stores, including sporting goods chains, specialty retailers, and club shops, accounted for 84.79% of sales. This highlights football's tactile purchasing behavior, where consumers prefer to evaluate a ball's weight, grip, and construction before buying. Online stores are expected to grow at a rate of 3.85% through 2031, driven by advancements in e-commerce features such as enhanced product visualization (360-degree imagery and augmented reality try-ons) and the increasing adoption of direct-to-consumer strategies. Adidas's adiClub membership platform reflects this trend by integrating loyalty rewards across both physical and online stores. The platform provides members with early access to limited-edition balls and exclusive colorways tied to major tournaments, effectively converting tournament excitement into immediate online sales while building a database of highly engaged consumers.
Offline channels maintain a significant advantage in commercial procurement, as bulk orders from clubs and schools often require in-person negotiations and customizations, such as logo printing and color specifications. PUMA's decision to open its largest European flagship store in January 2025, spanning 24,000 square feet on London's Oxford Street, demonstrates the enduring value of physical retail. The flagship prominently features football boot lines and dedicated customization areas, emphasizing that physical retail remains a powerful tool for brand building, particularly in high-traffic locations. Experiential elements like digital running walls and archive displays further justify the investment. However, online channels are steadily capturing incremental growth. Amazon's expansion into the sports equipment category and Alibaba's extensive third-party seller ecosystem provide a distribution reach that traditional retail cannot match, although counterfeit products on these platforms remain a challenge. The strategic takeaway for suppliers is to adopt a dual-channel approach. By investing in flagship stores, they can enhance brand equity, while optimizing e-commerce channels ensures efficient transactions. This balance requires effective inventory management and disciplined pricing strategies to prevent channel conflicts.
Geography Analysis
In 2025, Europe accounted for 41.21% of the market share, supported by its strong professional leagues, high participation rates, and established retail networks. Europe's football infrastructure is highly developed: Germany's Bundesliga and England's Premier League consistently achieve over 95% stadium capacity utilization. This high level of engagement drives consistent demand for match balls and training equipment. Additionally, lower-tier leagues attracted over 80 million spectators during the 2024/25 season, highlighting widespread interest beyond top-tier competitions. Puma will replace Nike as the Premier League's partner starting in the 2025/26 season, a move expected to boost premium product adoption as the league's global visibility generates aspirational demand in international markets. Women's football is growing rapidly, creating a new procurement segment as federations integrate women's teams into club structures and enforce minimum investment requirements. However, economic challenges are reducing discretionary spending. Puma's revised 2025 forecast, which anticipates an operating loss due to U.S. tariffs and weak consumer sentiment, highlights increasing margin pressures. These challenges may push suppliers to focus on volume sales rather than pricing power in the short term.
Asia-Pacific is projected to grow at a rate of 4.22% through 2031, making it the fastest-growing region. This growth is driven by institutional investments in China and India, the expansion of grassroots programs, and increasing participation from the middle class. Decathlon's EUR 100 million investment in India over five years aims to establish 63 new stores and achieve 85% local sourcing by 2026. This reflects confidence in demand from tier-2 and tier-3 cities, where sports retail infrastructure remains underdeveloped. However, rising smartphone penetration and the adoption of digital payments are enabling rapid e-commerce growth. In China, multi-club ownership models are gaining traction, with private equity firms like 777 Partners and City Football Group leading the way. These models standardize equipment procurement across clubs, creating centralized buying power that benefits suppliers offering volume discounts and consistent quality. Japan and South Korea, while mature markets with slower growth, present opportunities for premium pricing due to consumers' willingness to pay for technology-enhanced products.
The Middle East and Africa offer varied opportunities influenced by sovereign investments and infrastructure challenges. Saudi Arabia's National Gaming and Esports Sector Strategy aims to contribute USD 13.3 billion to GDP by 2030. Interestingly, this strategy includes physical football development, blending digital and physical participation to diversify the sports ecosystem. Sub-Saharan Africa faces affordability and infrastructure barriers, but FIFA's Forward Programme provides a funding baseline for equipment procurement, partially offsetting low consumer purchasing power. North America and South America are experiencing moderate growth. The United States is preparing to host the 2026 World Cup, while Brazil's SAF model is unlocking commercialization opportunities through private club investments. However, Argentina's resistance to privatization, as courts blocked President Milei's decree, creates regulatory uncertainty that could delay institutional investments.

Competitive Landscape
The football market is fragmented, with leading specialized ball manufacturers and regional competitors each holding less than a 15% global market share. This fragmentation stems from low entry barriers in mass-market segments, where Sialkot's contract manufacturers produce unbranded balls for USD 3-5 each, and significant entry barriers in premium tiers. In the premium segment, FIFA Quality Programme certification, sensor integration, and federation partnerships create strong competitive advantages. Adidas and Nike have historically dominated the premium market through long-standing partnerships with FIFA and UEFA, but both face strategic challenges. Nike is streamlining its athlete roster and shifting toward vertical integration by reducing wholesale distribution. However, this approach negatively impacted its fiscal 2023 revenue, prompting a partial reversal. Meanwhile, Adidas, after focusing heavily on direct-to-consumer sales during the pandemic, is now reestablishing its wholesale partnerships.
Major players in the market include Molten Corporation, Select Sport A/S, Nike, Inc., Puma SE, and the Adidas Group. Key market trends emphasize the integration of advanced technologies, adherence to sustainability standards, and the adoption of direct-to-consumer business models. These strategies not only enhance profit margins but also strengthen customer relationships. The competitive landscape increasingly favors companies that combine physical products with digital services. For example, partnerships in advanced ball technology integrate traditional manufacturing with data analytics, delivering enhanced performance insights to consumers.
Three areas present significant growth opportunities: sustainable materials (initiatives like Puma's RE: FIBRE and Molten's recycled-content balls address ESG mandates but remain niche), women's football (a segment that legacy suppliers have underinvested in), and connected training products. While premium tiers feature Select's iBalls and Adidas's Connected Ball Technology, there is a clear gap for mid-priced sensor-enabled balls targeting amateur clubs and training academies. Under Armour's March 2025 NFL partnership and December 2024 investor meeting focus on team sports highlight a U.S.-based competitor prioritizing institutional relationships over consumer spending. This strategy could extend into football if Under Armour leverages its collegiate partnerships, such as Maryland and Georgia Tech, to build grassroots credibility. In premium tiers, technology adoption is the primary competitive differentiator. Suppliers investing in innovations like thermal bonding, sensor integration, and heat-resistant adhesives (e.g., Molten's Acentec) can command price premiums of 3-5x. However, maintaining these advanced capabilities requires R&D budgets that only the top 5-7 players can sustain, reinforcing concentration in the premium segment while the mass market remains fragmented.
Football Industry Leaders
-
Puma SE
-
Molten Corporation
-
Select Sport A/S
-
Nike, Inc.
-
Adidas Group
- *Disclaimer: Major Players sorted in no particular order


Recent Industry Developments
- June 2025: Puma has introduced the Premier League match ball for the 2025-26 season, marking the beginning of a new era after Nike's 25-year tenure with the league. According to the brand, the Puma Premier League 25-26 ball features a white base with purple, pink, and black graphic patterns, incorporating angular and zigzag shapes to convey motion and energy.
- May 2025: La Liga introduced the new PUMA Órbita for the 2025‑26 campaign, featuring a seamless 12‑panel structure and 3D‑textured PU finish that enhances flight stability, grip, and visual clarity.
- January 2025: Adidas launched the official ball for the USA-hosted FIFA Club World Cup 2025, featuring red‑white‑blue graphics and incorporating Connected Ball Technology with a 500 Hz IMU for VAR precision.
- January 2025: Nike, Inc. introduced its Nike Flight 2025, the official match ball of the English Premier League 2024/2025 season, 2nd half. According to the brand, the Nike Flight Premier League ball 2025 features a predominantly white base, adorned with bold blue "stripes" that include purple and lighter accents.


Research Methodology Framework and Report Scope
Market Definitions and Key Coverage
Our study defines the global football market as the value generated from new association-football balls sold for match-play, training, and recreational use across all retail and institutional channels during the calendar year. The universe therefore covers size-regulated balls that are hand-stitched, machine-stitched, or thermally bonded, while it deliberately omits cleats, apparel, media rights, and memorabilia.
Scope exclusion: equipment for American football and futsal mini-balls is outside this estimate.
Segmentation Overview
-
By Size
- Size 1 and 2
- Size 3
- Size 4
- Size 5
-
By Category
- Mass
- Premium
-
By End Use
- Personal
- Commercial
-
By Distribution Channel
- Online Stores
- Offline Stores
-
By Geography
-
North America
- United States
- Canada
- Mexico
- Rest of North America
-
South America
- Brazil
- Argentina
- Colombia
- Chile
- Rest of South America
-
Europe
- United Kingdom
- Germany
- France
- Italy
- Spain
- Russia
- Sweden
- Belgium
- Poland
- Netherlands
- Rest of Europe
-
Asia-Pacific
- China
- Japan
- India
- Thailand
- Singapore
- Indonesia
- South Korea
- Australia
- New Zealand
- Rest of Asia-Pacific
-
Middle East and Africa
- United Arab Emirates
- South Africa
- Saudi Arabia
- Nigeria
- Egypt
- Morocco
- Turkey
- Rest of Middle East and Africa
-
North America
Detailed Research Methodology and Data Validation
Primary Research
Mordor analysts then interviewed distributors across Europe, Asia-Pacific, and Latin America, store buyers from specialty chains, and equipment managers at academies. Those conversations helped us validate ball replacement cycles, typical average selling prices, and the recent shift toward online direct-to-consumer models before we finalized our assumptions.
Desk Research
We began by pulling baseline shipment and trade codes from UN Comtrade, Eurostat, and USITC, then reviewed player registration counts released by FIFA, UEFA, and national federations to gauge active demand pools. Insights from sport-goods associations such as the SFIA, together with retail sell-through snapshots in company 10-Ks and investor decks, grounded our volume assumptions. D&B Hoovers and Dow Jones Factiva supplied supplemental manufacturer revenue splits and pricing commentary. These example sources are illustrative; many additional publications and datasets informed the analysis.
The next phase used aggregated customs lines to triangulate import parity prices for synthetic-leather balls, with World Bank inflation and exchange factors normalizing values to constant 2025 USD.
Market-Sizing & Forecasting
A single top-down reconstruction of global production and trade data rebuilt into regional consumption forms the spine of the model, which is subsequently pressure tested with selective bottom-up roll-ups of branded supplier revenues. Key variables include registered player population, grassroots program enrollments, average ball life (in months), e-commerce share of sports gear, and polyurethane input costs. Multivariate regression links these drivers to historical sales, while scenario analysis handles event spikes such as the 2026 FIFA World Cup. Gaps in low-reporting countries are bridged by regional proxies adjusted for GDP per capita.
Data Validation & Update Cycle
Outputs pass through variance checks versus discretionary consumer-goods indices, peer review by a second analyst, and management sign-off. We refresh the dataset every twelve months, with interim mini-updates if supply shocks or major tournaments materially shift demand.
Why Mordor's Football Baseline Commands Reliability
Published numbers differ because publishers pick distinct product baskets, deflators, and refresh cadences. According to Mordor Intelligence, our disciplined scope and annual update rhythm reduce drift that can creep in when figures are back-calculated from older base years.
Benchmark comparison
| Market Size | Anonymized source | Primary gap driver |
|---|---|---|
| USD 3.72 B (2025) | Mordor Intelligence | - |
| USD 3.41 B (2024) | Global Consultancy A | excludes training balls and applies higher ASP escalation |
| USD 3.03 B (2024) | Regional Consultancy B | covers only offline retail and a subset of 40 countries |
| USD 3.30 B (2023) | Sector Specialist C | older base year and no currency inflation rebasing |
The comparison shows that variances stem less from arithmetic and more from scope filters and dated baselines. This is where Mordor Intelligence differentiates, offering a transparent, repeatable model tied to clearly documented variables so decision-makers can plan with confidence.


Key Questions Answered in the Report
How large is the football market in 2026?
The football market size was USD 8.7 billion in 2026 and is forecast to reach USD 9.97 billion by 2031.
Which ball size is growing fastest?
Size 1 and 2 balls, mainly used for youth training, are projected to grow at a 2.98% CAGR through 2031.
Why are online sales of footballs increasing?
Convenience, augmented reality product views, and loyalty programs such as adiClub are driving a 3.85% CAGR for online channels.
What region will post the highest growth?
Asia-Pacific is expected to expand at 4.22% through 2031, led by investments in India and China.
Page last updated on:


