
Sports Protective Equipment Market Size and Share
Market Overview
| Study Period | 2021 - 2031 |
|---|---|
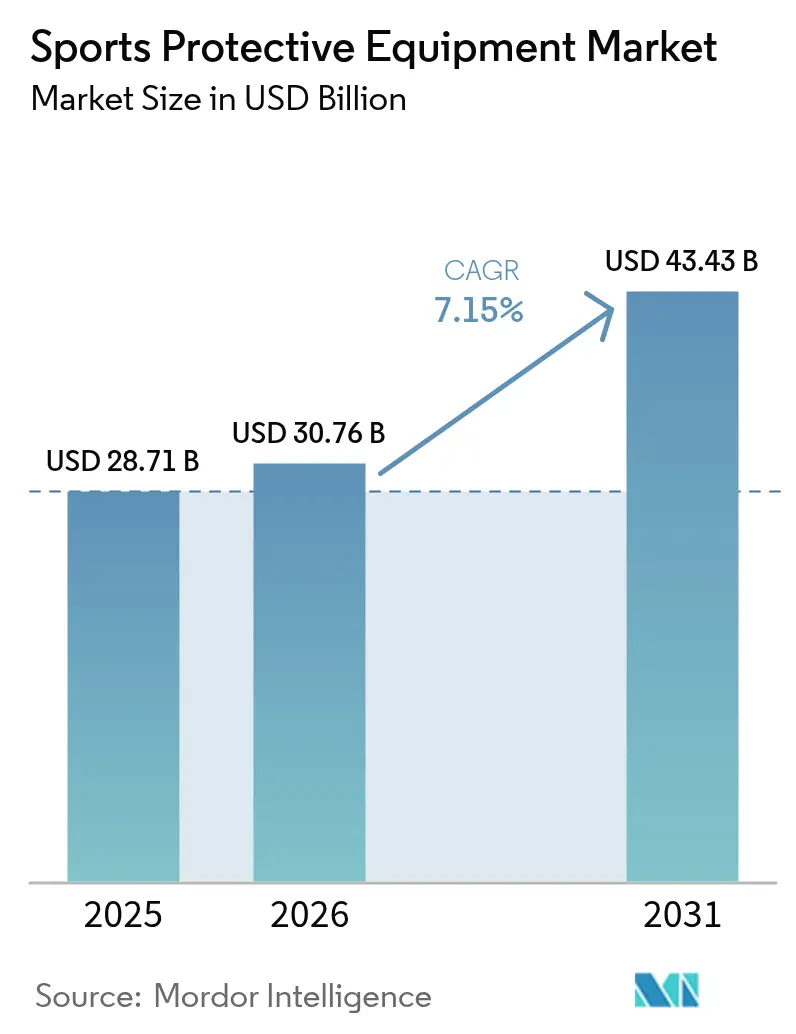
| Market Size (2026) | USD 30.76 Billion |
| Market Size (2031) | USD 43.43 Billion |
| Growth Rate (2026 - 2031) | 7.15 % |
| Fastest Growing Market | Asia Pacific |
| Largest Market | North America |
| Market Concentration | Medium |
Major Players *Disclaimer: Major Players sorted in no particular order Image © Mordor Intelligence. Reuse requires attribution under CC BY 4.0. | |
Sports Protective Equipment Market Analysis by Mordor Intelligence
The global sports protective equipment market size in 2026 is estimated at USD 30.76 billion, growing from 2025 value of USD 28.71 billion with 2031 projections showing USD 43.43 billion, growing at 7.15% CAGR over 2026-2031. This growth trajectory reflects the convergence of heightened safety awareness, technological innovation, and expanding sports participation across traditional and emerging athletic disciplines. The market's expansion is particularly driven by the integration of smart technologies, with innovations like liquid shock absorbers reducing concussive impacts by 33% compared to traditional helmets, as demonstrated by Stanford University research [1]. The customization movement creates opportunities for direct-to-consumer business models and premium pricing strategies, as consumers demonstrate a willingness to pay higher prices for personalized products that enhance both performance and aesthetic appeal. The sector benefits from major sporting events, including UEFA EURO 2024 and the Olympic Games Paris 2024, which catalyze equipment upgrades and performance enhancements across professional and amateur segments.
Key Report Takeaways
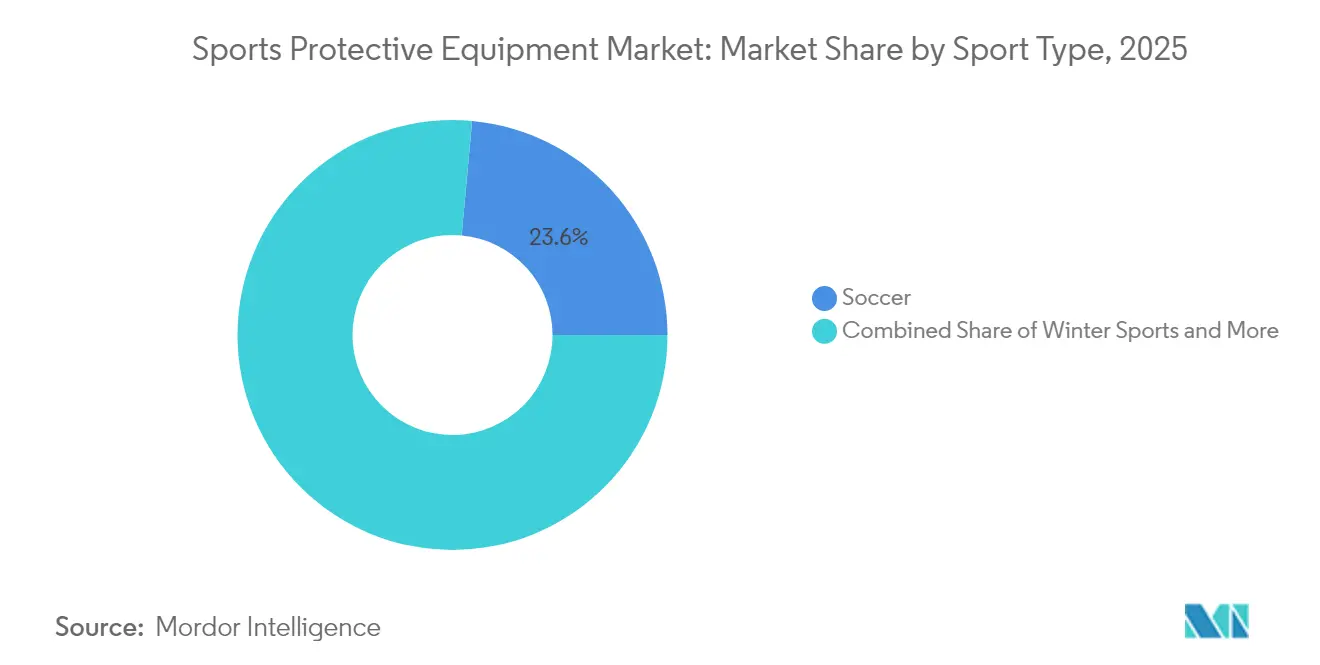
- By sport type, soccer led with 23.55% revenue share in 2025; winter sports is projected to expand at a 7.48% CAGR through 2031.
- By end-user, adults held 84.62% of the sports protective equipment market share in 2025, while the kids/children segment is advancing at a 7.22% CAGR through 2031.
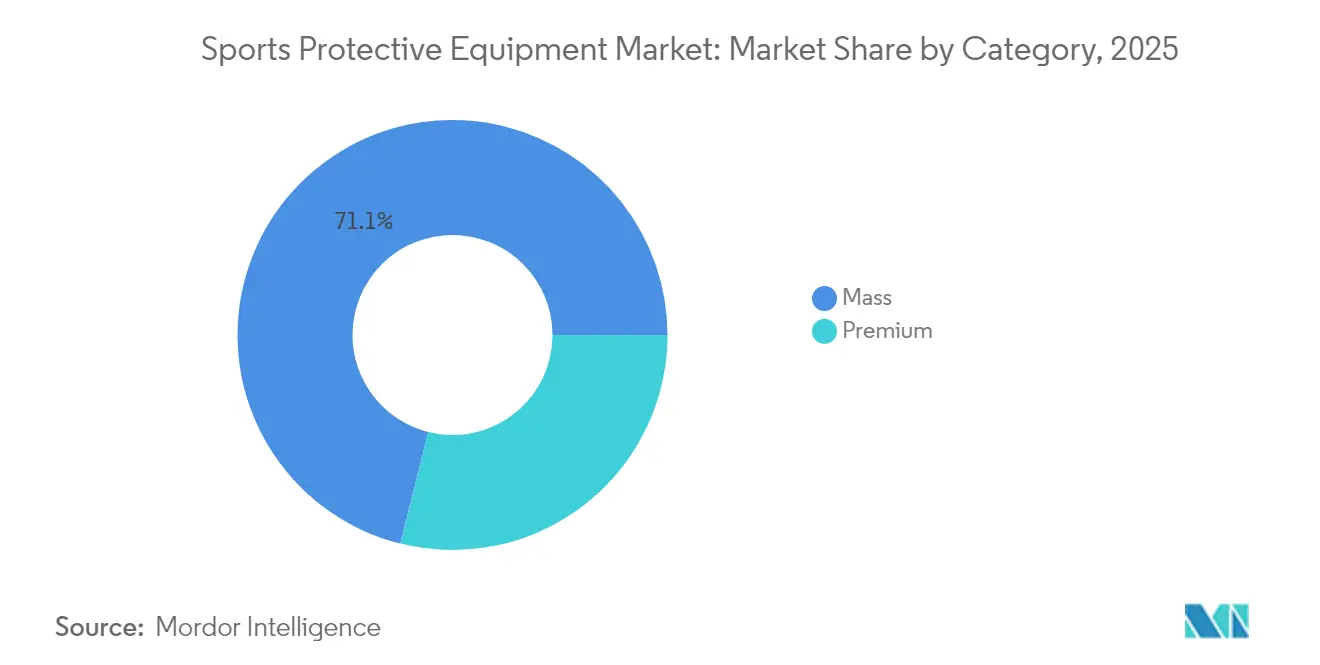
- By category, mass products accounted for 71.10% share of the sports protective equipment market size in 2025; premium offerings are set to grow at a 7.52% CAGR between 2026 and 2031.
- By distribution channel, offline retail stores captured 66.55% share of the sports protective equipment market size in 2025; online platforms are forecast to register a 7.69% CAGR through 2031.
- By geography, North America dominated with 39.95% revenue share in 2025, while Asia-Pacific is poised to record a 7.98% CAGR to 2031.
Note: Market size and forecast figures in this report are generated using Mordor Intelligence’s proprietary estimation framework, updated with the latest available data and insights as of 2026.
Market Trends and Insights
Drivers Impact Analysis of Sports Protective Equipment Market*
| Driver | (~) % Impact on CAGR Forecast | Geographic Relevance | Impact Timeline |
|---|---|---|---|
| Rising Awareness of Sports Injuries and Safety | +1.8% | Global, with highest impact in North America and Europe | Medium term (2-4 years) |
| Customization and Personalization of Protective Gear | +1.2% | North America and APAC core, spill-over to Europe | Long term (≥ 4 years) |
| Technological Advancements in Materials and Design | +1.5% | Global, led by North America and Europe | Medium term (2-4 years) |
| Expansion of Action and Extreme Sports Culture | +0.9% | APAC core, North America, emerging in MEA | Long term (≥ 4 years) |
| Integration of Smart Technologies | +1.4% | North America and Europe, expanding to APAC | Short term (≤ 2 years) |
| Product Diversification for Women and Youth Athletes | +1.1% | Global, with early gains in North America and Europe | Medium term (2-4 years) |
| Source: Mordor Intelligence | |||
Rising Awareness of Sports Injuries and Safety
The escalating recognition of sports-related injuries fundamentally reshapes protective equipment adoption patterns across all athletic levels. CDC data reveals over 2.5 million children and teens receive treatment for sports-related injuries annually, with contact sports like football showing disproportionately higher injury rates [2]. This awareness translates into regulatory pressure and institutional mandates, particularly evident in the NFL's introduction of 7 new helmet models for 2025 to enhance performance standards. Organizations like NOCSAE continue advancing safety standards, with recent research breakthroughs addressing previously puzzling fatal sports injuries. This heightened safety consciousness creates sustained demand for advanced protective equipment across all market segments, particularly driving premium product adoption where safety features justify higher price points.
Technological Advancements in Materials and Design
Material science innovations revolutionize protective equipment performance through advanced composites and engineered structures that enhance both safety and comfort. Carbon-carbon composites demonstrate exceptional thermal shock resistance and structural integrity at extreme temperatures, while maintaining lightweight properties essential for athletic performance. University of Colorado Boulder research reveals new padding designs utilizing 3D-printed honeycomb structures that absorb up to 25% more force than traditional foams, with controlled collapse mechanisms providing consistent performance across varying impact levels[3]. Moreover, the integration of AI-driven material optimization accelerates innovation cycles, enabling manufacturers to design high-performance protective equipment that meets evolving athlete demands while maintaining cost-effectiveness. This technological evolution creates competitive advantages for companies that successfully translate laboratory innovations into commercially viable products, particularly in premium market segments where performance differentiation commands pricing power.
Customization and Personalization of Protective Gear
The shift toward personalized protective equipment reflects growing consumer expectations for products tailored to individual anatomical and performance requirements. 3D printing technology enables unprecedented customization capabilities, as demonstrated by CRP USA's development of lighter, more durable racing gloves for Paralympic athletes and Carbon/Hypsole's creation of versatile athletic guards for cleats that adapt across multiple sports. Wilson's customizable airless basketball exemplifies how personalization extends beyond protective gear to encompass broader sports equipment categories, indicating market-wide adoption of individualized solutions. This trend particularly resonates with younger demographics who prioritize unique, performance-optimized equipment that reflects personal style preferences while maintaining safety standards. Manufacturing scalability through advanced production technologies enables companies to offer customization without prohibitive cost increases, making personalized protective equipment accessible across broader market segments.
Integration of Smart Technologies
Smart technology integration transforms protective equipment from passive safety devices into active monitoring and performance enhancement systems. Smart mouthguards represent a breakthrough in concussion detection technology, providing real-time impact assessment capabilities that enable earlier intervention and improved player safety protocols. Wearable technology integration extends beyond impact detection to encompass comprehensive biometric monitoring, including heart rate, GPS tracking, and biomechanical analysis that optimize training effectiveness while reducing injury risks. The NFL's advancement in helmet technology for concussion reduction demonstrates how smart features become standard requirements rather than premium options, driving market-wide adoption across professional and amateur levels. This technological convergence creates new revenue streams through data services and subscription models, while establishing barriers to entry for companies lacking technological capabilities or partnerships.
Restraints Impact Analysis of Sports Protective Equipment Market*
| Restraint | (~) % Impact on CAGR Forecast | Geographic Relevance | Impact Timeline |
|---|---|---|---|
| High Cost of Quality Protective Equipment | -0.8% | Global, most pronounced in emerging markets | Medium term (2-4 years) |
| Reluctance Among Amateurs to Use Protective Gear | -0.6% | APAC & MEA primarily, selective impact in rural North America | Long term (≥ 4 years) |
| Lack of Comprehensive Regulations and Standards | -0.4% | Emerging markets, regulatory gaps in MEA & South America | Short term (≤ 2 years) |
| Risk of Counterfeit and Low-Quality Products | -0.5% | APAC core, expanding to MEA and South America | Medium term (2-4 years) |
| Source: Mordor Intelligence | |||
High Cost of Quality Protective Equipment
Premium protective equipment pricing creates accessibility barriers that limit market penetration, particularly in price-sensitive segments and emerging economies. Advanced materials and smart technology integration drive manufacturing costs higher, creating tension between safety optimization and affordability requirements. This cost dynamic particularly affects youth sports participation, where families must balance safety investments against budget constraints across multiple children and sports activities. The price gap between mass and premium segments widens as technological sophistication increases, potentially creating a two-tier market where advanced safety features become exclusive to affluent consumers and professional athletes.
Reluctance Among Amateurs to Use Protective Gear
Cultural resistance to protective equipment adoption persists among amateur athletes who perceive safety gear as performance-limiting or unnecessary for recreational activities. This reluctance particularly affects emerging markets where traditional sports practices may not emphasize protective equipment usage, despite growing injury awareness. Educational initiatives and regulatory mandates gradually address this resistance, but behavioral change requires sustained effort and community-level engagement. The challenge intensifies in individual sports where equipment usage lacks peer pressure or institutional requirements that characterize team sports environments.
*Our forecasts treat driver/restraint impacts as directional, not additive. The impact forecasts reflect baseline growth, mix effects, and variable interactions.
Sports Protective Equipment Market Segment Analysis
By Sport Type:
Soccer Leads While Winter Sports AccelerateSoccer's commanding 23.55% market share in 2025 reflects the sport's global popularity and increasing emphasis on player protection across all competitive levels. Professional leagues mandate specific protective equipment standards, while amateur and youth organizations implement comprehensive safety protocols. The segment benefits from growing awareness of head injuries and the implementation of protective headgear in youth leagues, particularly in North America and Europe. Advanced materials technology drives innovation in shin guards and protective padding, with manufacturers developing lightweight, impact-resistant composites and smart materials that adapt to player movement.
Winter sports emerge as the fastest-growing segment at 7.48% CAGR through 2031, driven by expanding participation in skiing, snowboarding, and ice hockey across emerging markets. Advanced helmet technology, incorporating features like MIPS (Multi-directional Impact Protection System) and integrated communication systems, drives market value in premium segments. The segment also benefits from increasing adoption of protective equipment in recreational skiing and snowboarding, supported by resort regulations and insurance requirements. The segment benefits from technological advancements in impact-absorbing materials and the integration of lightweight protective solutions. Snowboarding protection evolves with specialized wrist guards, impact shorts, and spine protectors, gaining popularity among both recreational and professional athletes. The winter sports protective equipment market also sees increased demand for women-specific designs and sizing options, reflecting the growing female participation in winter sports activities.

By End User:
Adult Dominance with Youth Growth MomentumAdult users command 84.62% market share in 2025, reflecting higher purchasing power and greater awareness of injury prevention across recreational and competitive sports participation. This segment drives demand for premium protective equipment featuring advanced materials and smart technologies, particularly in contact sports where injury risks justify higher investment levels. Professional and semi-professional athletes within this segment influence broader market trends through equipment choices that demonstrate performance benefits and safety enhancements.
The kids/children segment accelerates at 7.22% CAGR through 2031, propelled by parental safety consciousness and institutional mandates for youth sports participation. This growth reflects increasing recognition that developing athletes require specialized protection designed for smaller body sizes and different impact dynamics compared to adult equipment. Educational initiatives by organizations like NFHS emphasize proper equipment fitting and maintenance, creating sustained demand for age-appropriate protective gear. The segment benefits from programs like the Denver Broncos' helmet distribution initiative, which demonstrates institutional commitment to youth safety while creating brand loyalty that extends into adult purchasing decisions.
By Category:
Premium Growth Outpaces Mass MarketMass category products maintain 71.10% market share in 2025, serving price-conscious consumers who prioritize basic protection over advanced features. This segment benefits from manufacturing scale economies and standardized designs that reduce production costs while meeting essential safety requirements. Mass market products increasingly incorporate technological innovations as manufacturing processes mature and component costs decline, gradually closing the performance gap with premium alternatives.
Premium segments expand at 7.52% CAGR through 2031, driven by consumers willing to invest in advanced materials, smart technologies, and customization features that enhance both safety and performance. This growth reflects increasing disposable income among sports enthusiasts and growing recognition that superior protective equipment provides long-term value through injury prevention and enhanced athletic performance. The premium segment particularly benefits from professional athlete endorsements and institutional adoptions that validate performance claims and create aspirational demand among amateur athletes. Sustainability initiatives also drive premium segment growth, as environmentally conscious consumers seek products featuring recycled materials and responsible manufacturing processes.
By Distribution Channel:
Digital Transformation Accelerates Online GrowthOffline retail stores maintain 66.55% market share in 2025, benefiting from consumers' preference for physical product evaluation before purchase, particularly for protective equipment, where fit and comfort significantly impact performance and safety. Traditional retailers provide expert fitting services and immediate availability that remain crucial for time-sensitive purchases and emergency replacements. Dick's Sporting Goods exemplifies this channel's evolution, operating 724 locations across United States while investing in omni-channel experiences that integrate online and in-store shopping capabilities.
Online retail stores surge at 7.69% CAGR through 2031, driven by enhanced product visualization technologies, virtual fitting tools, and expanded customization capabilities that address traditional e-commerce limitations for protective equipment. The channel benefits from broader product selection, competitive pricing, and convenience factors that appeal to time-constrained consumers. Digital platforms increasingly offer augmented reality fitting experiences and detailed sizing guides that reduce return rates while improving customer satisfaction. The COVID-19 pandemic accelerated online adoption patterns that persist as consumers appreciate the convenience and often superior product information available through digital channels.
Geography Analysis
North America Sports Protective Equipment Market
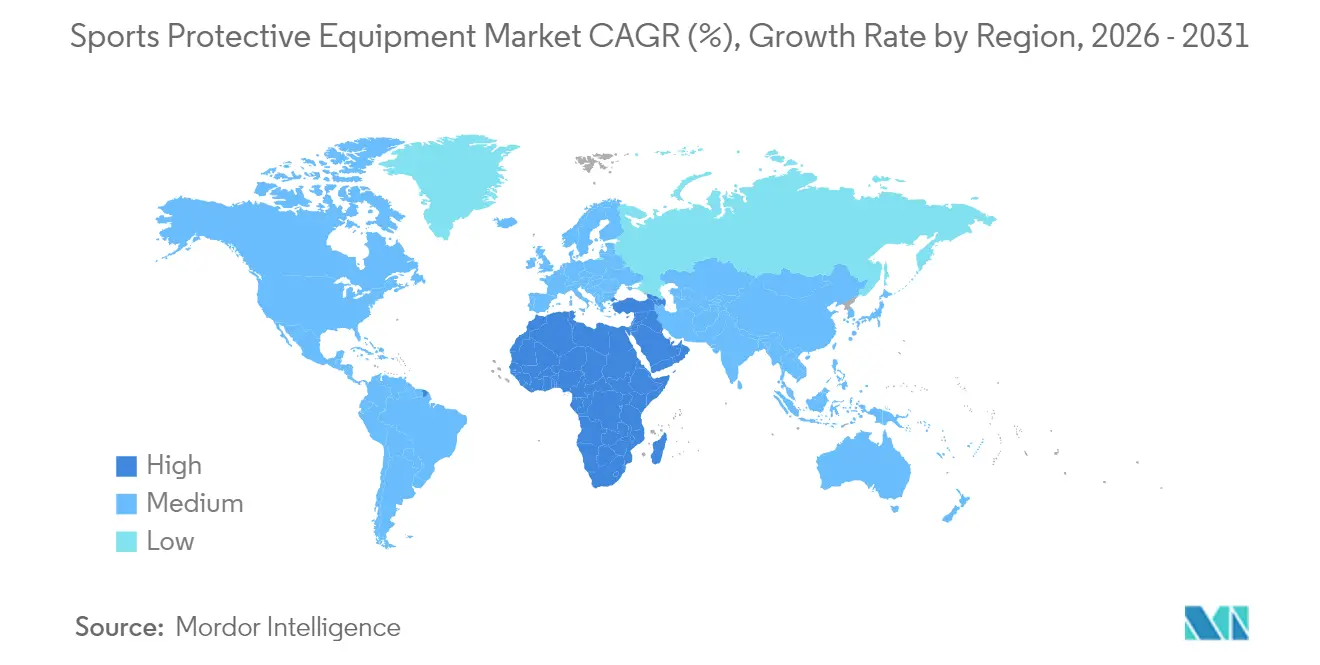
North America dominates with 39.95% market share in 2025, supported by stringent safety regulations, high sports participation rates, and strong institutional support for protective equipment adoption. The region benefits from advanced regulatory frameworks established by organizations like NOCSAE, which continuously update safety standards and drive equipment innovation. Professional sports leagues, including the NFL, NHL, and MLB, serve as innovation catalysts, with equipment choices influencing broader market adoption patterns. The region is expected to experience sustained growth through technological advancement and expanding youth sports participation.
APAC Sports Protective Equipment Market
Asia-Pacific emerges as the fastest-growing region at 7.98% CAGR through 2031, driven by expanding middle-class participation in sports, government infrastructure investments, and increasing safety awareness across developing economies. China's winter sports development for international competitions creates substantial demand for specialized protective equipment, while Japan's focus on sports safety through organizations like the Japan Sport Council drives regulatory compliance and equipment standards. The region benefits from manufacturing capabilities that enable both domestic consumption and export opportunities, creating economies of scale that support market expansion.
EMEA and South America Sports Protective Equipment Market
Europe maintains steady growth through 2030, supported by established sports cultures and regulatory frameworks that emphasize safety compliance. The region benefits from major sporting events including UEFA EURO 2024 and ongoing Olympic preparations that drive equipment upgrades and performance enhancements. South America shows promising growth, driven by expanding sports participation and increasing safety awareness, though market development remains constrained by economic volatility and infrastructure limitations. Middle East and Africa demonstrate high growth potential, reflecting early-stage market development with substantial upside as disposable incomes rise and sports participation expands across diverse demographic segments.
Note: Segment shares of all individual regions will be available upon report purchase
Regulatory Landscape
Sports protective equipment is shaped by a mix of mandatory consumer-safety rules and voluntary consensus standards that often operate as de facto market-access requirements in key regions. In North America, NOCSAE performance standards underpin certification and procurement in organized sports, while ASTM International Committee F08 issues sport- and product-specific specifications that manufacturers use to demonstrate conformity (for example, ASTM issued updated eye-protection specifications in 2025 and expanded paintball and airsoft protective-device specifications in 2026). In Europe, product safety obligations are anchored in the EU General Product Safety framework, with conformity frequently supported through alignment to recognized standards and, for some protective categories, CE-marking routes.
Regulatory specificity is also tightening in select categories and geographies. Canada enforces equipment-focused rules such as its Ice Hockey Helmet Regulations (SOR/2016-186), while Australia commenced the Consumer Goods (Bicycle Helmets) Safety Standard 2024 in March 2024, increasing technical and labeling expectations for helmets sold in that market. Internationally, ISO published new ice-hockey protective equipment standards in July 2024 (ISO 10256-1:2024, ISO 10256-2:2024, and ISO 10256-3:2024), reinforcing harmonized test methods and requirements that affect product development, certification planning, and cross-border assortment decisions for helmets and face/eye protection.
Competitive Landscape
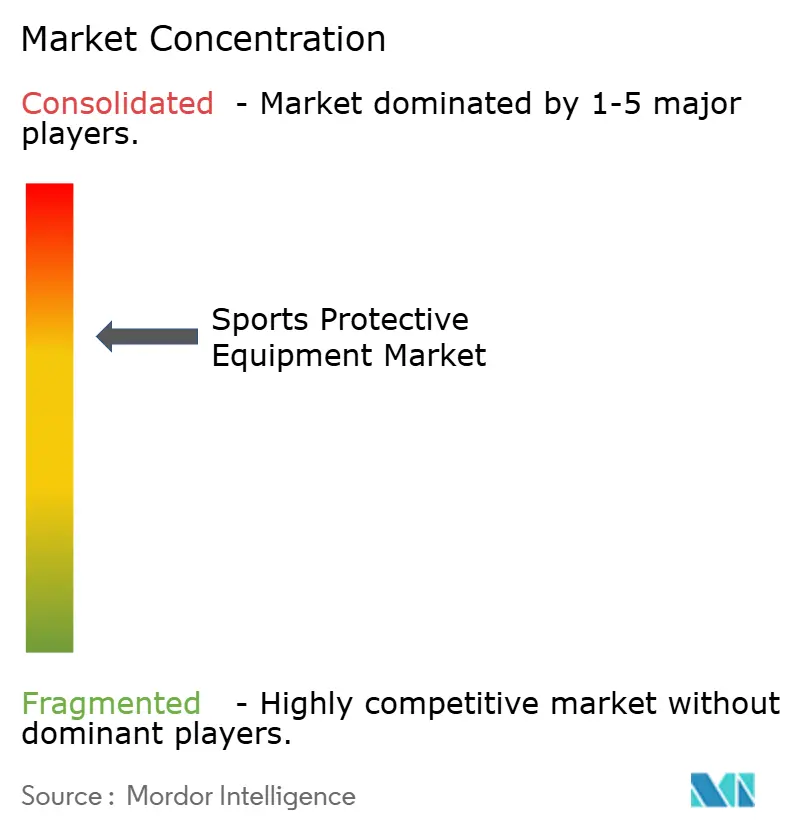
The sports protective equipment market maintains a moderate concentration level. This structure enables both established companies and new entrants to gain market share through technological advancements and strategic positioning. Major players in the market include Nike, Inc., Amer Sports Holding Oy, Adidas AG, and Under Armour, Inc. These companies implement vertical integration to maintain quality control, optimize supply chains, streamline innovation processes, and reduce production costs. New entrants focus on specific market segments with innovative solutions, particularly in areas such as impact absorption technology, lightweight materials, and ergonomic designs.
Industry partnerships strengthen competitive positions, as demonstrated by Bauer Hockey's agreement with Hockey Canada to provide protective equipment, including helmets, visors, and gloves, for national teams through the 2026 Olympic and Paralympic Winter Games. Companies integrating smart features like impact sensors, performance tracking capabilities, and IoT connectivity gain advantages over traditional manufacturers. Advanced materials such as D3O, carbon fiber composites, and memory foams enhance product performance and durability. Customization options, including 3D-printed components and personalized fit systems, address individual athlete requirements.
Market opportunities exist in developing regions where sports participation is growing rapidly, particularly in the Asia-Pacific and South America. Specialized sports segments such as extreme sports, adventure racing, and emerging urban sports present untapped potential where established companies have limited presence. Success in the market depends on balancing innovation with compliance, particularly as safety regulations become more comprehensive across global markets. This includes adherence to standards set by organizations such as ASTM International, CE marking requirements, and sport-specific governing bodies.
Sports Protective Equipment Industry Leaders
-
Nike, Inc.
-
Adidas AG
-
Under Armour, Inc.
-
Amer Sports Holding Oy
-
Puma SE
- *Disclaimer: Major Players sorted in no particular order
Sports Protective Equipment Market Companies Covered in this Report
- Nike, Inc.
- Adidas AG
- Under Armour, Inc.
- Amer Sports Holding Oy
- Puma SE
- Bauer Hockey LLC
- Certor Sports, LLC
- Riddell Sports Group
- Mizuno Corporation
- Decathlon SA
- United Sports Brands
- G-Form LLC
- New Balance Athletics, Inc.
- Rawlings Sporting Goods
- Franklin Sports Inc.
- Harrow Sports
- NIPPON Sigmax Co., Ltd.
- Dainese S.p.A.
- TSG International AG
- Black Diamond Equipment, Ltd
Market Opportunities and Future Outlook
Standards-led refresh cycles and earlier-to-compliance product roadmaps are creating pockets of demand in youth and contact-sport protection, especially where new performance requirements are being formalized. A concrete example is NOCSAE's ND006 youth football helmet performance standard, with an effective date of September 1, 2027. Manufacturers have started commercializing products aligned to this timeline, including Riddell's ND6 football helmet line launched in March 2026 and positioned around meeting the upcoming standard. This also supports demand across certified youth offerings (helmets, facemasks, and accessory components) as well as fitting, reconditioning, and verification services that schools, leagues, and retailers use to manage compliance and replacement cycles.
A second opportunity is the shift from impact mitigation toward connected, data-driven capabilities that can make protective gear part of measurable risk management. In cycling and other high-impact categories, helmet-mounted impact sensing has moved into professional testing programs during 2026, while helmet and accessory designs increasingly incorporate new materials and mechanical systems, such as Guardian Sports' Guardian FLEX Chinstrap launched in February 2026 using a hydraulic shock-absorbing approach. Cross-industry partnerships are also widening the feature set in premium helmets, including Leatt Corporation partnering with Cardo Systems in July 2026 to commercialize an off-road helmet with integrated wireless mesh communications. For players focused on differentiation, this opens room for safety-plus-communication positioning rather than protection-only product claims.
Recent Industry Developments in Sports Protective Equipment Market
- July 2026: Leatt Corporation partnered with Cardo Systems to release the Cardo Venture, an off-road helmet with integrated wireless mesh communication. The release extends premium helmet value propositions beyond impact protection into in-ride connectivity and increases the influence of electronics partners on product differentiation.
- April 2025: Riddell acquired Xenith assets, consolidating two football helmet brands under one owner. The transaction strengthened Riddell's position in football head protection and broadened its technology and product portfolio for teams and institutional buyers.
- October 2024: Bauer Hockey expanded its partnership with Hockey Canada, continuing to supply protective equipment including helmets, visors, face masks, neck guards, and gloves under a three-year agreement through the 2026 Olympic and Paralympic Winter Games. The agreement reinforced a high-visibility channel for product validation and can influence downstream adoption in hockey retail and team procurement.
Sports Protective Equipment Market Report Scope and Research Methodology
Market Definition and Coverage
This market covers the sales value of protective gear used during sports and fitness activities to lower injury risk, across retail and institutional purchase channels. The sizing reflects product demand across major sports and activity formats and is measured in USD.
Scope exclusions: We exclude medical-grade orthopedic braces prescribed for clinical treatment, as well as industrial workplace PPE that is not designed or marketed for sports use.
Segments Covered in This Report
- By Sport Type
- Soccer
- Winter Sports
- Baseball
- Rugby
- Other Sport Types
- By End User
- Adult
- Kids/Children
- By Category
- Mass
- Premium
- By Distribution Channel
- Offline Retail Stores
- Online Retail Stores
- By Geography
- North America
- United States
- Canada
- Mexico
- Rest of North America
- Europe
- Germany
- United Kingdom
- Italy
- France
- Spain
- Netherlands
- Poland
- Belgium
- Sweden
- Rest of Europe
- Asia-Pacific
- China
- India
- Japan
- Australia
- Indonesia
- South Korea
- Thailand
- Singapore
- Rest of Asia-Pacific
- South America
- Brazil
- Argentina
- Colombia
- Chile
- Peru
- Rest of South America
- Middle East and Africa
- South Africa
- Saudi Arabia
- United Arab Emirates
- Nigeria
- Egypt
- Morocco
- Turkey
- Rest of Middle East and Africa
- North America
Data Sources, Market Sizing, and Validation
Desk Research
To structure the market and build the first set of inputs, we start with public statistics and reference sources that anchor participation, safety, and trade signals. Common sources used include, such as, the US Consumer Product Safety Commission injury data, US Census Bureau trade and retail datasets, Eurostat trade statistics, UN Comtrade, and World Bank macro indicators that help normalize spending and currency movements.
After that, we cross-check direction and timing using company annual reports, investor presentations, product catalogs, and reputable press coverage of sports participation and safety standards. Where it helps to fill gaps, we also use a paid subscription focused on company financials and intelligence, and another paid subscription that supports shipment level import and export checks for key protective gear categories. These desk sources are illustrative only, and many additional references were used to collect data, validate assumptions, and clarify open points during the work.
Primary Interviews and Surveys
Primary work was used to confirm what sells, how pricing moves, and how demand changes by sport and by channel, particularly where public data is too broad to isolate protective gear. We spoke with manufacturers, distributors, retailers, league and training stakeholders, and safety-focused specialists across APAC, EMEA, and the Americas, so the assumptions behind volume, mix, and ASPs could be challenged and refined ahead of final sign-off.
Distribution of primary research fieldwork respondents
| Company type | Respondent position | Region |
|---|---|---|
| Top tier: 30% | CXOs: 14% | APAC: 41% |
| Mid tier: 55% | Functional/Unit leaders: 34% | EMEA: 36% |
| Smaller Players: 15% | Managers: 52% | Americas: 23% |
Market-Sizing & Forecasting
Sizing is built using a top-down demand pool approach, where sports participation, injury incidence signals, and replacement cycles are translated into equipment needs, then priced using observed retail and wholesale ranges. Because the market spans many sports, the model captures mix shifts between contact sports, action sports, and water sports, before totals are rolled up to the global level.
To keep the numbers grounded, we corroborate results with selective bottom-up approximations, such as sampled ASP times estimated unit demand for common categories like helmets, pads, guards, and mouthguards, followed by channel checks on online versus offline sales weight. Key inputs that typically move the model include organized sports participation rates, league and school safety requirements, average selling price progression by category, promotional intensity in retail, and the share of premium versus mass products. For forecasting, scenario analysis is used around participation growth, safety adoption, and pricing, and then the final path is aligned to what interviewees describe as the most realistic next-step trend set for the sector.
Data Validation & Update Cycle
Once the first model run is complete, outputs are compared against independent signals like trade flows for relevant product groups, reported category revenues, and region-level sports spending direction, so obvious misalignment gets flagged early. Variance checks are performed across regions and major sports to catch mix errors, and any large swings are pushed back through assumptions until the driver is clearly explained.
Before publication, the work goes through multi-step analyst review, so the scope, math, and logic match the stated market definition. If an input looks unstable, respondents are re-contacted to confirm whether it is a one-time effect or a true shift. The report is refreshed on an annual cycle, and interim updates are made when material events change participation, pricing, or channel structure, followed by a final pre-delivery pass so clients receive the most current view.
Mordor Intelligence's Sports Protective Equipment Market Estimate Compared With Other Published Estimates
Published market values for sports protective equipment can vary a lot, even when published totals appear to cover similar product families. Differences usually come from what is counted as sports gear versus adjacent items, the base year selected, and how pricing is converted and carried forward.
The table shows a much higher 2026 market value than some 2024 based estimates, and in Mordor Intelligence's model the scope includes broad sports type coverage and channels globally. The value is tracked for the 2026 base year, rather than mixing earlier-year pricing and participation levels into the same total.
Benchmark comparison
| Source | Market Size | Gaps in Research Methodology |
|---|---|---|
| Mordor Intelligence | USD 30.76 B (2026) | |
| Global Consultancy A | USD 9.24 B (2024) | Uses a different base year and a narrower counted value pool, and the lower total is consistent with not fully reflecting the same year mix, channel scope, and category breadth used in the 2026-based model. |
| Industry Research Group B | USD 9.10 B (2025) | Often applies conservative participation and replacement assumptions and may hold ASP growth flatter across categories, which compresses the total when compared with a model that re-validates mix and pricing by sport and region. |
Overall, the spread is mainly explained by year choice and what gets included as sports-specific protection versus nearby gear categories, and then by how pricing is updated across regions. By tying totals back to participation signals, safety adoption, and realistic price ranges that are checked in interviews, the final number stays traceable to clear drivers and repeatable steps.
Key Questions Answered in the Report
How large is the sports protective equipment market in 2026?
The market is valued at USD 30.76 billion in 2026 and is set to grow to USD 43.43 billion by 2031.
Which sport type generates the highest revenue for protective gear?
Soccer leads, accounting for 23.55% of 2025 revenue, with widespread global participation and enforced shin and head protection rules.
What is the fastest-growing regional market for sports protective equipment?
Asia-Pacific is expanding at a 7.98% CAGR through 2031, driven by rising middle-class sports participation and government infrastructure spending.
What factors limit protective equipment adoption in emerging markets?
High unit costs and cultural reluctance among amateurs remain key hurdles, though education programs and subsidies are gradually improving uptake.