Sports And Leisure Equipment Market Size and Share
Market Overview
| Study Period | 2021 - 2031 |
|---|---|
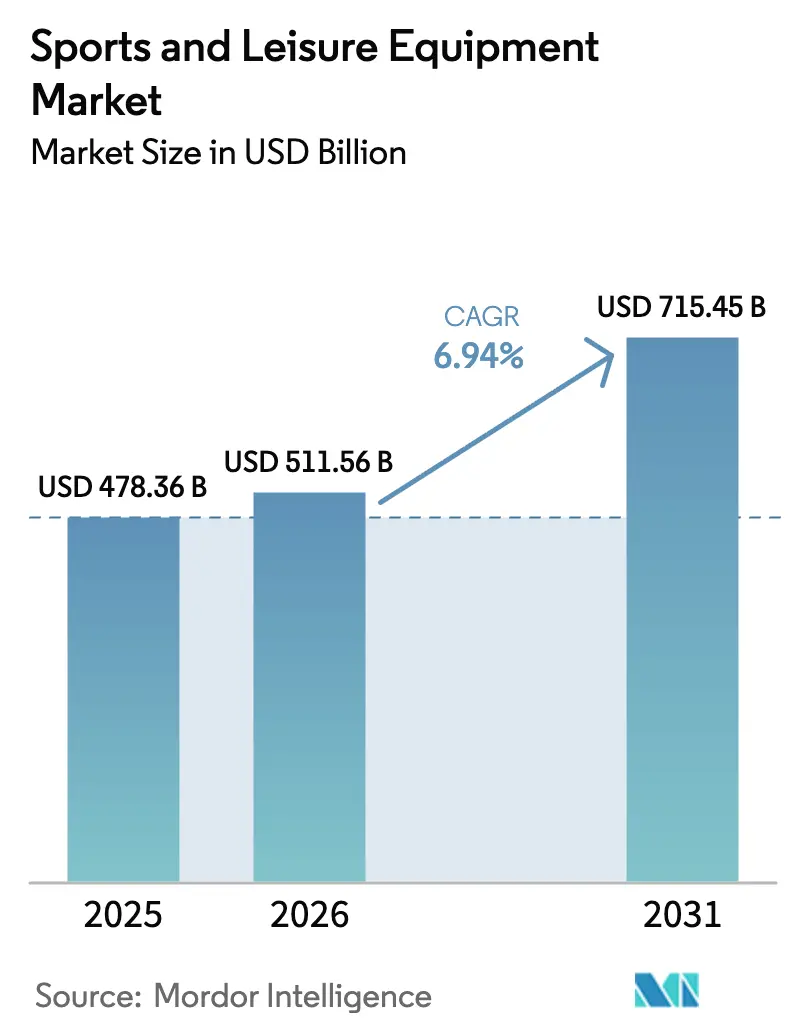
| Market Size (2026) | USD 511.56 Billion |
| Market Size (2031) | USD 715.45 Billion |
| Growth Rate (2026 - 2031) | 6.94% CAGR |
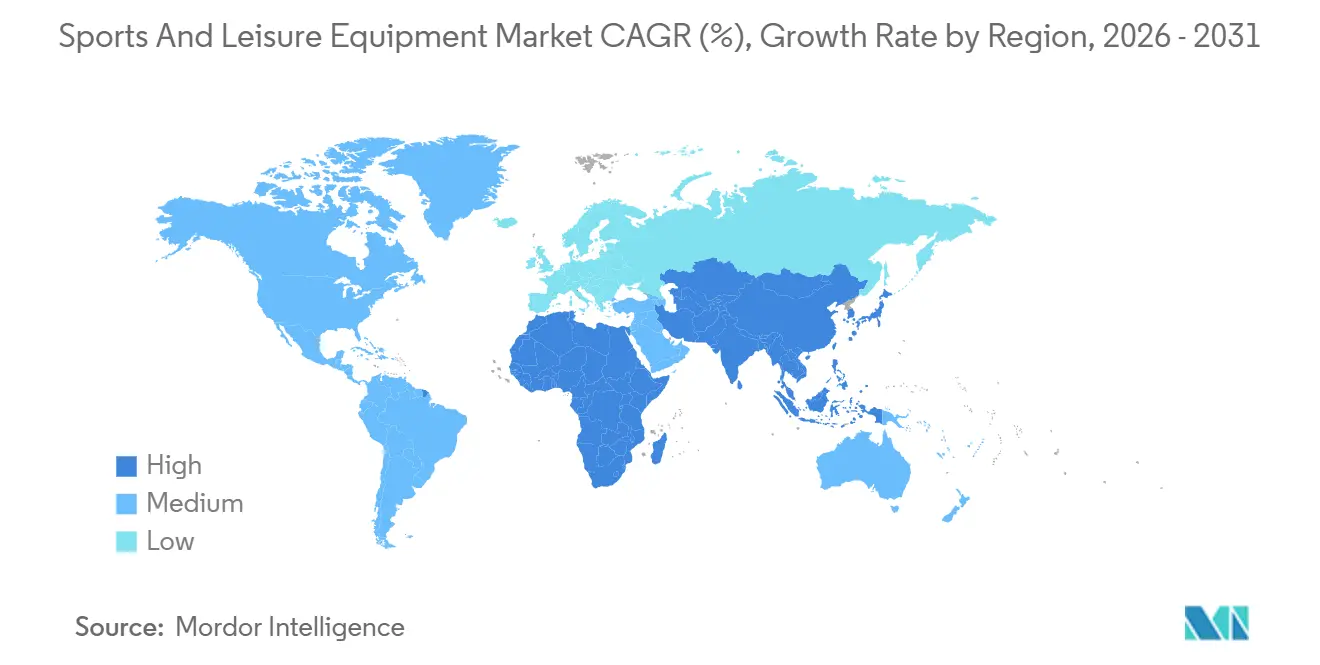
| Fastest Growing Market | Asia Pacific |
| Largest Market | North America |
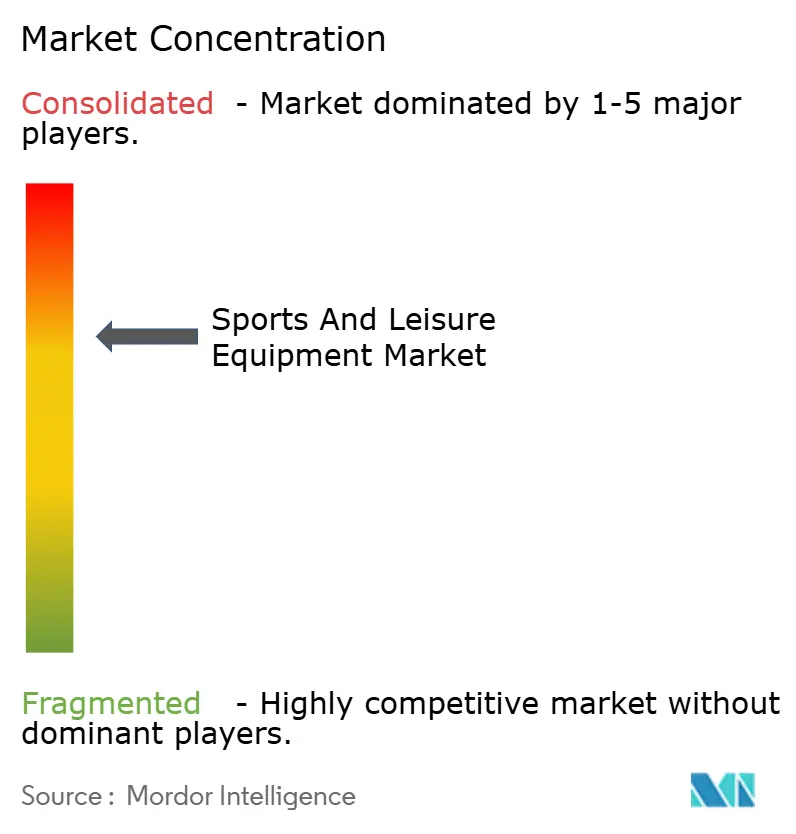
| Market Concentration | Medium |
Major Players
*Disclaimer: Major Players sorted in no particular order Image © Mordor Intelligence. Reuse requires attribution under CC BY 4.0. |
|
Sports And Leisure Equipment Market Analysis by Mordor Intelligence
The sports and leisure equipment market size was valued at USD 478.36 billion in 2025 and estimated to grow from USD 511.56 billion in 2026 to reach USD 715.45 billion by 2031, at a CAGR of 6.94% during the forecast period (2026-2031). This trajectory reflects a structural shift in how consumers allocate discretionary spending, with health-conscious purchasing now competing directly with traditional entertainment budgets. The World Health Organization documented that 31% of adults globally remain insufficiently active, yet paradoxically, fitness memberships in the United States hit a historic peak of 72.9 million in 2024, suggesting that equipment demand increasingly stems from a narrower but more committed cohort willing to invest in premium gear. Brand strategies now tilt toward direct-to-consumer distribution, while governments frame physical activity as a public-health priority, redirecting discretionary budgets toward premium equipment. Venture investment in smart equipment delivers higher margins and recurring software revenue, prompting incumbents and start-ups alike to embed sensors and analytics into balls, bats, and footwear. Meanwhile, sustainability regulations accelerate material innovation, nudging brands to integrate recycled fibers and circular design principles.
Key Report Takeaways
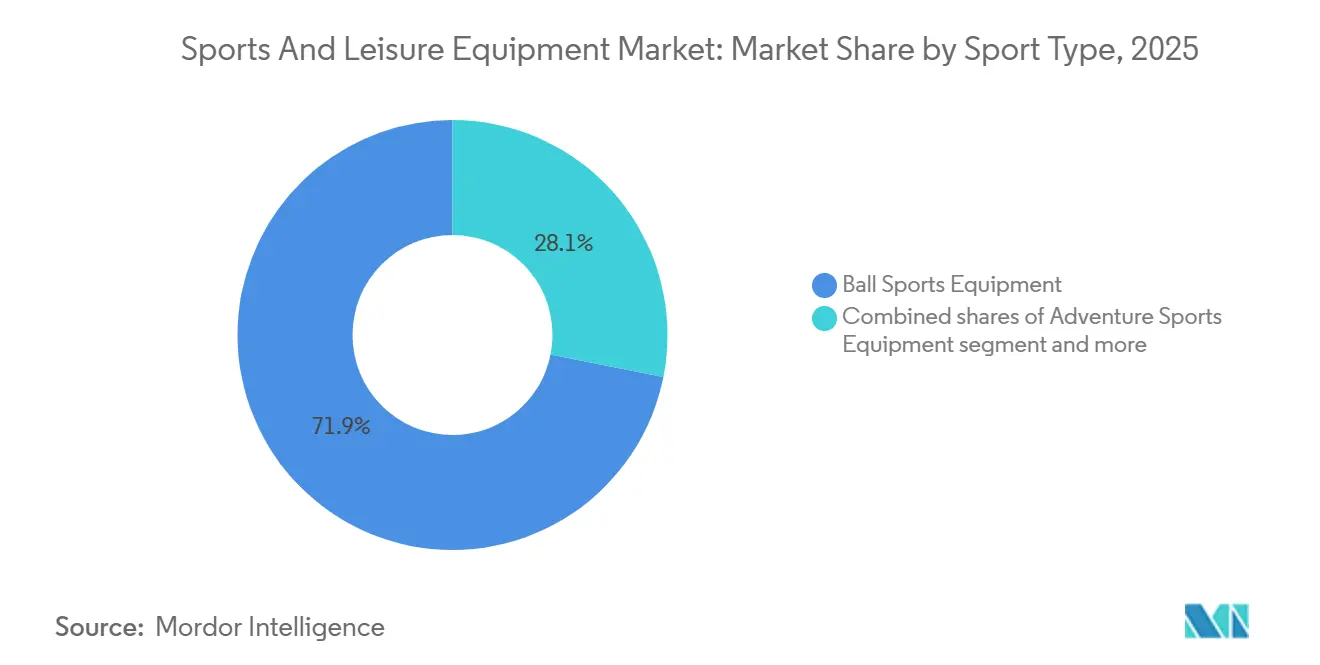
- By sport type, ball sports led with 71.88% of the sports and leisure equipment market share in 2025, whereas adventure sports equipment is forecast to expand at a 7.02% CAGR to 2031.
- By product type, apparel accounted for 49.71% share of the sports and leisure equipment market size in 2025; gears and accessories are projected to grow at 7.06% CAGR through 2031.
- By application, personal and household usage captured 88.02% of the sports and leisure equipment market size in 2025 and is advancing at a 6.98% CAGR to 2031.
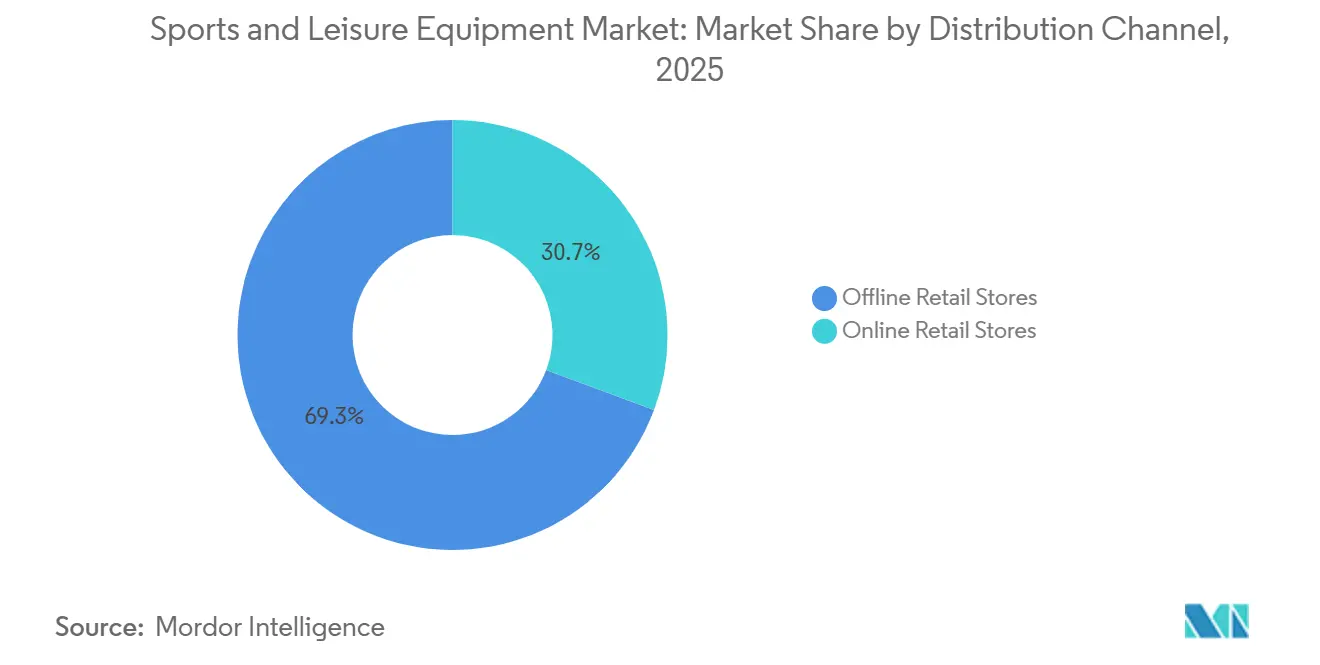
- By distribution channel, offline retail stores retained 69.33% revenue share in 2025, while online channels are set to record the highest CAGR at 7.49% during 2026-2031.
- By end-user, the male segment dominated with 66.04% revenue share in 2025; the female segment is poised for the fastest growth at a 7.15% CAGR through 2031.
- By geography, the North America segment dominated with 38.36% revenue share in 2025; the Asia-Pacific segment is poised for the fastest growth at a 7.88% CAGR through 2031.
Note: Market size and forecast figures in this report are generated using Mordor Intelligence’s proprietary estimation framework, updated with the latest available data and insights as of January 2026.
Global Sports And Leisure Equipment Market Trends and Insights
Drivers Impact Analysis*
| Driver | (~) % Impact on CAGR Forecast | Geographic Relevance | Impact Timeline |
|---|---|---|---|
| Increasing Awareness of Health and Fitness | +1.2% | Global, with stronger impact in North America and Europe | Medium term (2-4 years) |
| Growing Popularity of Outdoor and Adventure Sports | +1.0% | North America, Europe, Asia-Pacific core | Long term (≥ 4 years) |
| Government Initiatives and Sports Promotion | +0.8% | Global, with early gains in Ireland, South Africa, India | Short term (≤ 2 years) |
| Increasing Participation of Women | +0.7% | Global, with stronger momentum in North America and Europe | Medium term (2-4 years) |
| Technological Advancements in Equipment | +0.6% | Global, concentrated in developed markets initially | Long term (≥ 4 years) |
| Influence of Social Media Platforms and Celebrity Endorsements | +0.5% | Global, with highest impact in North America and Asia-Pacific | Short term (≤ 2 years) |
| Source: Mordor Intelligence | |||
Increasing Awareness of Health and Fitness
The increasing emphasis on health consciousness is fundamentally transforming consumer behavior in the sports and leisure equipment market. Consumers are adopting a more strategic approach by considering sports equipment as essential health infrastructure rather than discretionary purchases. This transformation corresponds with preventive healthcare initiatives, where regular physical activity contributes to healthcare cost reduction. In Australia, healthcare spending as a percentage of GDP has demonstrated a marginal decrease in recent years. According to the Australian Institute of Health and Welfare, Australia allocated USD 252.5 billion to health goods and services, with health spending recording a decrease of 0.3% compared to 2021-22[1]Source: Australian Institute of Health and Welfare, "Health expenditure", aihw.gov.au. Corporate wellness initiatives are generating substantial equipment procurement through bulk purchases, while individual consumers demonstrate a preference for performance-enhancing equipment that delivers quantifiable health outcomes.
Growing Popularity of Outdoor and Adventure Sports
The sports and leisure equipment market continues to expand due to rising participation in outdoor and adventure sports activities. Growth stems from increased health and wellness awareness, growing interest in experience-based activities, and technological improvements in equipment manufacturing. The market shows steady growth across various activities, including hiking, mountain biking, and water sports, as consumers focus on physical fitness and mental well-being. Social media platforms contribute to market expansion, with content creators and sports enthusiasts sharing experiences that encourage broader participation. For instance, according to Sport England, approximately 3.97 million people engaged in adventure sports in England between 2023 and 2024[2]Source: Sport England, "Number of people participating in adventure sports in England", sportengland.org. This resurgence stems less from new participant acquisition than from existing enthusiasts increasing frequency, with gateway activities like hiking attracting millions of participants who then graduate to equipment-intensive pursuits like mountain biking and climbing.
Government Initiatives and Sports Promotion
State-led sports development programs compress market adoption timelines by creating captive demand through infrastructure mandates and procurement contracts. China's "Healthy China 2030" initiative targets a CNY 5 trillion sports industry by 2025, with 2.9 billion sports venue visits recorded in 2023 and a 38.5% participation rate. India's Khelo India scheme allocated Rs. 3,165 crore for 2024-25, focusing on grassroots infrastructure that standardizes equipment specifications and favors domestic manufacturers. Saudi Arabia's Vision 2030 commits over SAR 50 billion to sports infrastructure, including hosting the 2034 FIFA World Cup and targeting an increase in weekly sports participation from 13% to 40% by 2030. These programs bypass organic adoption curves, creating immediate demand for standardized equipment that meets government specifications, which advantages established suppliers with public procurement expertise over digitally native brands optimized for consumer channels.
Influence of Social Media Platforms and Celebrity Endorsements
Influencer marketing expenditure grew in 2024, with athletic apparel and equipment brands capturing disproportionate share due to visual content's inherent virality. Celebrity endorsements now function less as brand awareness vehicles than as product co-creation partnerships, where athletes contribute to design specifications and share in downstream revenue through equity stakes rather than fixed fees. Nike's partnerships with athletes like LeBron James and Serena Williams extend beyond traditional endorsement to include signature product lines that command premium pricing and generate dedicated followings. The shift from broadcast advertising to social media allows brands to target micro-segments with precision, reducing customer acquisition costs while simultaneously fragmenting brand identity across multiple influencer personas. This dynamic favors brands with robust content production capabilities and real-time engagement infrastructure over those relying on traditional campaign cycles.
Restraints Impact Analysis*
| Restraint | (~) % Impact on CAGR Forecast | Geographic Relevance | Impact Timeline |
|---|---|---|---|
| Risk of Injury and Safety Concerns | -0.8% | Global, with higher impact in contact sports segments | Medium term (2-4 years) |
| Lack of Time and Lifestyle Constraints | -0.6% | Developed markets, urban areas globally | Long term (≥ 4 years) |
| Limited Access to Facilities and Infrastructure | -0.5% | Developing regions, rural areas globally | Long term (≥ 4 years) |
| Counterfeit and Low-quality Products | -0.4% | Global, concentrated in online channels | Short term (≤ 2 years) |
| Source: Mordor Intelligence | |||
Risk of Injury and Safety Concerns
Sports injury data indicate significant participation barriers in athletic activities. The National Safety Council reports an 8% increase in exercise and exercise equipment-related injuries in 2023 in the United States. These safety concerns affect contact sports and high-intensity activities, where equipment failure or inadequate protection can cause serious injuries. The NCAA's catastrophic injury insurance program, which covers medical expenses exceeding USD 90,000 for intercollegiate activities, demonstrates the substantial financial impact of sports-related injuries[3]Source: The National Collegiate Athletic Association (NCAA), "NCAA Catastrophic Injury Insurance Program", ncaa.org. Climate change intensifies safety risks, as rising temperatures increase heat-related illnesses among youth athletes, necessitating enhanced safety measures and equipment modifications. Equipment manufacturers' liability concerns lead to conservative design approaches, which may restrict innovation in performance-enhancing technologies. While protective equipment integration addresses safety concerns, it increases product costs and complexity, potentially limiting access for price-sensitive consumers.
Counterfeit and Low-quality Products
The OECD estimated counterfeit trade at USD 464 billion globally, with sporting goods ranking among the top targeted categories. Nike's lawsuit against StockX over NFT trademark infringement demonstrates how counterfeiting extends beyond physical products into digital assets, requiring brands to defend intellectual property across multiple domains simultaneously. Adidas invests heavily in anti-counterfeiting technologies, including blockchain authentication and serialized product tracking, yet these measures add cost that legitimate manufacturers cannot fully pass through to price-sensitive consumers. U.S. Customs seizures of counterfeit goods provide only a partial view of the problem, as direct-to-consumer shipments and social media marketplaces bypass traditional enforcement chokepoints. The proliferation of low-quality imitations erodes consumer trust in online channels, paradoxically strengthening brick-and-mortar retail where tactile inspection reduces purchase risk, which partially explains why offline stores retain the majority of market share despite e-commerce's convenience advantages.
*Our forecasts treat driver/restraint impacts as directional, not additive. The impact forecasts reflect baseline growth, mix effects, and variable interactions.
Segment Analysis
By Sport Type: Ball Sports Anchor Revenue, Adventure Gear Captures Growth
Ball sports equipment commanded 71.88% market share in 2025, reflecting entrenched participation in soccer, basketball, and tennis that benefits from established league infrastructure and school-based programs. Adventure sports equipment, despite a smaller base, accelerates at 7.02% CAGR through 2031, driven by experiential tourism and social media's amplification of outdoor pursuits. Golf equipment occupies a mature niche where innovation cycles have lengthened, and replacement purchases dominate new customer acquisition, constraining growth despite high average transaction values. Other sport types, including winter sports and water sports, exhibit seasonal volatility that complicates inventory management and working capital planning for suppliers lacking diversified product portfolios.
The Sports and Fitness Industry Association reported industry growth in 2023, up from the previous year, yet this aggregate figure masks divergent trajectories where team sports stagnate while individual pursuits like running and cycling gain share. This technology integration creates switching costs that lock consumers into brand ecosystems, yet adoption remains concentrated among competitive athletes rather than recreational participants who prioritize affordability over analytics. Ball sports' dominance persists because equipment replacement cycles are shorter than adventure gear, where durable goods like kayaks and climbing harnesses last multiple years, generating lower annual revenue per customer despite higher initial purchase prices.


By Product Type: Gears and Accessories Outpace Apparel's Volume Base
Apparel held 49.71% market share in 2025, benefiting from frequent replacement cycles and the athleisure trend that blurs boundaries between performance wear and casual fashion. Gears and accessories, however, expand at 7.06% CAGR through 2031, propelled by the connected equipment boom and consumers' willingness to invest in specialized tools that promise measurable performance gains. Footwear occupies a strategic middle ground where technical innovation justifies premium pricing, yet commoditization pressures from fast-fashion entrants compress margins for mid-tier brands lacking distinctive technology or brand equity. Nike's FlyWeb 3D-printed apparel and Aero-FIT cooling technology demonstrate how incumbents defend market share through patent-protected innovations that justify price premiums.
The Outdoor Industry Association noted that footwear and accessories posted the strongest gains in 2024, while equipment sales declined and apparel remained flat, suggesting that consumers prioritize versatile products usable across multiple activities over sport-specific gear. Casual products drove more sales than technical gear, indicating that mainstream consumers value style and comfort over performance specifications, which challenges brands positioning themselves as premium athletic suppliers. Smart wearables account for a significant share of connected equipment revenue, blurring the line between accessories and medical devices as features like heart rate monitoring and sleep tracking attract health-conscious buyers beyond traditional athletes. Gears and accessories benefit from lower inventory risk than apparel, where seasonal fashion cycles and size/color proliferation create markdown exposure, allowing specialized suppliers to maintain healthier gross margins despite smaller revenue bases.
By Application: Personal Dominance Masks Commercial Recovery
Personal and household applications represented 88.02% market share in 2025, growing at 6.98% CAGR through 2031, as pandemic-era home gym investments prove durable rather than temporary. Commercial applications, encompassing gyms, schools, and sports facilities, recover from COVID-19 closures yet face structural headwinds as consumers who invested in home equipment exhibit lower willingness to pay for memberships. Commercial buyers prioritize durability and serviceability over aesthetics, creating a distinct value proposition that favors industrial suppliers like Technogym and Johnson Health Tech over consumer-focused brands.
Government infrastructure programs in Asia-Pacific and the Middle East disproportionately benefit commercial equipment suppliers, as public procurement contracts specify institutional-grade products with extended warranties and maintenance agreements. Saudi Arabia's SAR 50 billion sports infrastructure investment and China's CNY 5 trillion industry target create lumpy revenue opportunities that can distort quarterly results for suppliers winning major tenders. Personal applications exhibit more predictable demand patterns but face margin pressure from e-commerce platforms that facilitate price comparison and reduce switching costs. The bifurcation between personal and commercial segments prevents most suppliers from achieving leadership in both, as distribution channels, product specifications, and sales cycles differ fundamentally, forcing strategic choices about resource allocation.
By Distribution Channel: Online Gains Share Despite Offline's Tactile Advantage
Offline retail stores retained 69.33% market share in 2025, yet online channels surged at 7.49% CAGR through 2031, reflecting consumers' growing comfort with remote purchasing for categories traditionally requiring tactile evaluation. The Outdoor Industry Association reported U.S. outdoor retail reached USD 28 billion in 2024, up 1% versus 2023, with online penetration varying dramatically by product category. Footwear and technical apparel maintain a higher offline share due to fit complexity, while accessories and consumables migrate online faster due to standardized specifications and lower return rates. Nike's direct-to-consumer revenue hit 44% of total sales in Q1 FY2025, targeting the majority as the company retreats from wholesale partnerships, demonstrating how brands use owned channels to capture retail margins and control customer data.
Dick's Sporting Goods and Decathlon leverage store networks as showrooms and distribution hubs, offering same-day pickup that neutralizes e-commerce's convenience advantage while maintaining the tactile evaluation that drives conversion for high-involvement purchases. Counterfeit prevalence on online marketplaces drives quality-conscious consumers back to authorized retailers, creating a defensive moat for brick-and-mortar that persists despite e-commerce's cost structure advantages. The distribution channel split reflects a transitional period where neither online nor offline achieves decisive superiority, forcing suppliers to maintain a dual infrastructure that inflates operating costs and complicates inventory allocation.
By End User: Female Participation Drives Growth
Male consumers maintain a dominant market position with 66.04% share in 2025, while female participation demonstrates significant growth at 7.15% CAGR during 2026-2031, indicating a fundamental shift in sports and fitness participation demographics. The increasing presence of female athletes in sports is evidenced by the influence of professional athletes such as Caitlin Clark on youth participation rates. Equipment manufacturers have responded by implementing comprehensive product development strategies that incorporate gender-specific physiological requirements and design preferences, superseding traditional modification approaches.
The expansion of women's participation in sports demonstrates substantial societal benefits, resulting in increased institutional investment in women's athletic programs and equipment development initiatives. Despite persistent barriers, including equipment acquisition costs, facility accessibility, and sociocultural factors affecting female participation, systematic initiatives and evolving social paradigms continue to address these limitations. The integration of inclusive design principles enhances equipment functionality across user demographics while specifically addressing the historically underserved requirements of female athletes.
Geography Analysis
North America commanded 38.36% market share in 2025, reflecting high per-capita sports spending and mature retail infrastructure, yet growth moderates as participation rates plateau and demographic shifts favor less equipment-intensive activities. The United States allocated significant funding through various programs, while Canada and Mexico benefit from cross-border supply chains and USMCA trade provisions that reduce tariff exposure. However, the outdoor recreation contribution to the U.S., while substantial, grew more slowly than overall GDP, indicating relative maturity, according to the U.S. Bureau of Economic Analysis. Regional disparities persist, with coastal urban centers exhibiting higher participation rates and premium product adoption than interior regions, where budget constraints and facility access limit market development.
Asia-Pacific accelerates at 7.88% CAGR through 2031, driven by government-mandated sports programs that create captive demand and rising middle-class incomes that enable discretionary sports spending. Japan's Sports Agency budgeted billions for 2024, with Tokyo hosting the 2025 Deaflympics, the first in 61 years, according to the Japan Sports Agency. Australia's National Sports Plan 2030 commits over AUD 200 million, with a majority of adults participating in sport or physical activity, according to the Australian Government. These programs compress adoption timelines by bypassing organic market development, favoring suppliers with public procurement expertise. However, income inequality within the region creates a bifurcated market where affluent coastal cities resemble developed markets while interior regions remain price-sensitive and underserved by premium brands.
Europe balances mature Western markets with emerging Eastern European growth pockets, while sustainability regulations reshape product design and supply chains. The EU Green Deal's circular economy action plan and Extended Producer Responsibility regulations force manufacturers to internalize end-of-life costs, favoring brands with established recycling infrastructure, according to the European Commission. South America and the Middle East and Africa exhibit nascent market development with pockets of government-led acceleration. The UAE develops sports hubs in Dubai and Abu Dhabi, hosting the 2031 Basketball World Cup, positioning itself as a regional center, according to the UAE Government. These investments create lumpy revenue opportunities for suppliers winning major contracts, yet consumer markets remain underdeveloped due to low participation rates and limited retail infrastructure. Sub-Saharan Africa's young demographics offer long-term potential, yet poverty and infrastructure deficits constrain near-term demand to urban elites and expatriate communities.

Competitive Landscape
The sports and leisure equipment market demonstrates moderate concentration. Major companies like Nike Inc., Adidas AG, PUMA SE, Under Armour, Inc., and New Balance Athletics, Inc. maintain strong market positions through their global presence, brand strength, and innovation capabilities. These established players face increasing competition from challenger brands and technological disruptors, necessitating strategic adaptations to maintain market dominance.
Industry participants are implementing comprehensive strategic initiatives to maintain competitive advantages. Companies are expanding direct-to-consumer channels, developing sustainability programs, and integrating advanced technologies across operations. Substantial investments in digital infrastructure and data analytics capabilities enable improved customer engagement and operational efficiency, reflecting the market's technological transformation.
Challenger brands continue to gain market share through targeted consumer segmentation and demographic-specific marketing strategies. The competitive landscape is further diversified by specialized outdoor equipment manufacturers, boutique fitness brands, and technology-focused startups expanding across traditional product categories. Market opportunities emerge in smart equipment integration, sustainable materials development, and underserved demographic segments, while new entrants differentiate through subscription-based models, product customization capabilities, and community-focused brand development strategies.
Sports And Leisure Equipment Industry Leaders
-
Nike Inc.
-
Adidas AG
-
PUMA SE
-
Under Armour, Inc.
-
New Balance Athletics, Inc
- *Disclaimer: Major Players sorted in no particular order

Recent Industry Developments
- May 2025: Nike has re-released the Hypervenom football boot line with the Hypervenom RGN. This updated version combines the original Hypervenom design with new technology, incorporating an enhanced upper, a redesigned plate, and the established mesh and Gripskin technology.
- January 2025: FILA introduced a new collection that blends street culture with self-expression. The collection features basketball-inspired designs and streetwear elements to target urban consumers.
- January 2025: Callaway Golf introduced the Elyte family of golf clubs. The Elyte Fairway Woods feature a Step Sole design and Tungsten Speed Wave technology, combined with an AI 10x Face. These design elements reduce turf interaction by 57% while enhancing launch height and ball speed with reduced spin.
- June 2024: New Balance launched its first football cleats designed for the American football market. The Prodigy model is engineered for skill position players, while the Fortress model provides stability and support for intense plays.


Research Methodology Framework and Report Scope
Market Definitions and Key Coverage
Our study defines the global sports and leisure equipment market as all revenue generated from the sale of new apparel, footwear, gear, and accessories purpose-built for organized sport, outdoor adventure, indoor fitness, or recreational play. We count purchases by households, clubs, institutions, and commercial gyms across every retail channel.
Scope Exclusions. We exclude second-hand goods, venue construction materials, and licensed media content from this valuation.
Segmentation Overview
-
Sport Type
- Ball Sports Equipment
- Adventure Sports Equipment
- Golf Equipment
- Other Types
-
Product Type
- Apparel
- Footwear
- Gears and Accessories
-
Application
- Personal/Houesehold
- Commercial
-
Distribution Channel
- Offline Retail Stores
- Online Retail Stores
-
End-User
- Male
- Female
-
Geography
-
North America
- United States
- Canada
- Mexico
- Rest of North America
-
Europe
- Germany
- United Kingdom
- Italy
- France
- Spain
- Netherlands
- Poland
- Belgium
- Sweden
- Rest of Europe
-
Asia-Pacific
- China
- India
- Japan
- Australia
- Indonesia
- South Korea
- Thailand
- Singapore
- Rest of Asia-Pacific
-
South America
- Brazil
- Argentina
- Colombia
- Chile
- Peru
- Rest of South America
-
Middle East and Africa
- South Africa
- Saudi Arabia
- United Arab Emirates
- Nigeria
- Egypt
- Morocco
- Turkey
- Rest of Middle East and Africa
-
North America
Detailed Research Methodology and Data Validation
Primary Research
We next speak with retail buyers, equipment brand managers, gym operators, and distributors across North America, Europe, Asia-Pacific, and Latin America. Their insights on pricing cadence, inventory turns, and participation trends fill data gaps and help us fine-tune assumed penetration rates, price ladders, and seasonality factors.
Desk Research
Our analysts first map the landscape with open-access statistics from UN Comtrade customs data, Eurostat retail trade files, the US Bureau of Economic Analysis consumption tables, and Sport England's Active Lives survey. Company 10-Ks, investor decks, and association yearbooks on cycling, golf, and outdoor recreation are then reviewed to benchmark category volumes and average selling prices. Subscription datasets such as D&B Hoovers and Dow Jones Factiva supply brand revenue splits, while Questel patent analytics hint at innovation pipelines that shape future demand. This list is illustrative, and many other repositories were tapped to complete the evidence base.
Market-Sizing & Forecasting
We start with a top-down build that uses national household sports expenditure, trade flows of finished gear and apparel, and then regional production statistics, which are reconciled through a selective bottom-up check based on sampled brand revenue and channel audits. Key model fingerprints include average pair price of athletic footwear, annual treadmill shipments, per-capita outdoor recreation participation, and fitness club membership growth. Missing datapoints are bridged with logical proxies that mirror historic relationships. Forecasts are generated through multivariate regression where GDP per capita, urbanization rate, e-commerce share, and youth population ratios explain demand shifts; scenario analysis tests macro-shock sensitivity before the final curve is set.
Data Validation & Update Cycle
We pass outputs through a three-layer review that compares totals with external retail sales indicators and inventory movements. Any variance above our threshold triggers source re-contact and model adjustment. Before release, we are carrying out a fresh pass so clients receive the latest view; Mordor analysts refresh each report annually and issue interim updates for material events.
Why Mordor's Sports And Leisure Equipment Baseline Commands Reliability
Published estimates often differ because analysts choose dissimilar product baskets, price definitions, and refresh intervals.
Key gap drivers include whether apparel and footwear are bundled with hard goods, the extent to which online marketplaces are captured, and whether duty-free re-exports are netted out. Mordor's disciplined scope selection and yearly recalibration give decision-makers a dependable anchor.
Benchmark comparison
| Market Size | Anonymized source | Primary gap driver |
|---|---|---|
| USD 482.56 B (2025) | Mordor Intelligence | |
| USD 264.75 B (2024) | Global Consultancy A | Excludes performance apparel and applies static online-share assumptions |
| USD 344.20 B (2023) | Industry Analytics B | Uses uniform ASP across regions and omits household fitness accessories |
In short, we see that by capturing the full value chain and validating every key variable with field inputs, Mordor Intelligence delivers a balanced, transparent baseline that managers can trust.


Key Questions Answered in the Report
How large is the sports and leisure equipment market in 2026?
The sports and leisure equipment market size reached USD 511.56 billion in 2026 and is on track to hit USD 715.45 billion by 2031.
How are brands addressing counterfeit risks in online channels?
Market leaders deploy blockchain authentication, serialized tracking, and direct-to-consumer channels to verify product origin and protect brand equity.
Which product category is growing fastest?
Gears and accessories, particularly smart and sensor-enabled items, are projected to grow at a 7.06% CAGR through 2031.
Why is Asia-Pacific the most attractive region for suppliers?
Government-funded infrastructure projects in China, India, and Saudi Arabia compress adoption cycles and generate large procurement contracts, driving a 7.88% regional CAGR.
Page last updated on:


