Baseball Equipment Market Size and Share
Market Overview
| Study Period | 2021 - 2031 |
|---|---|
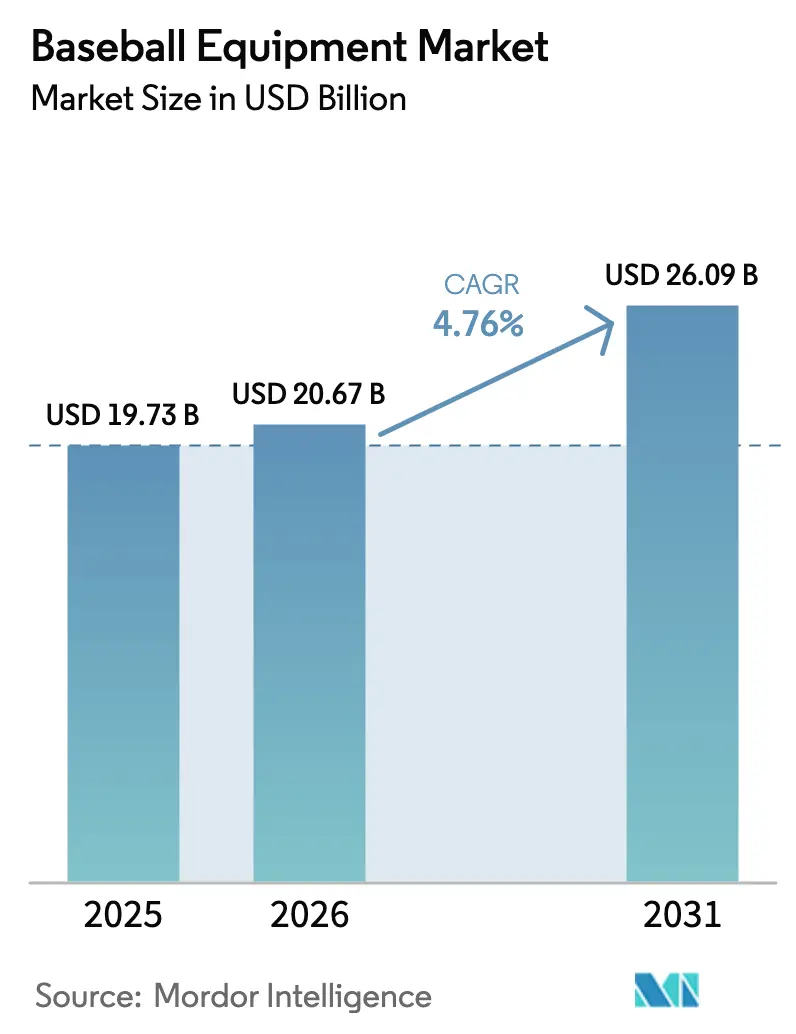
| Market Size (2026) | USD 20.67 Billion |
| Market Size (2031) | USD 26.09 Billion |
| Growth Rate (2026 - 2031) | 4.76% CAGR |
| Fastest Growing Market | Asia-Pacific |
| Largest Market | North America |
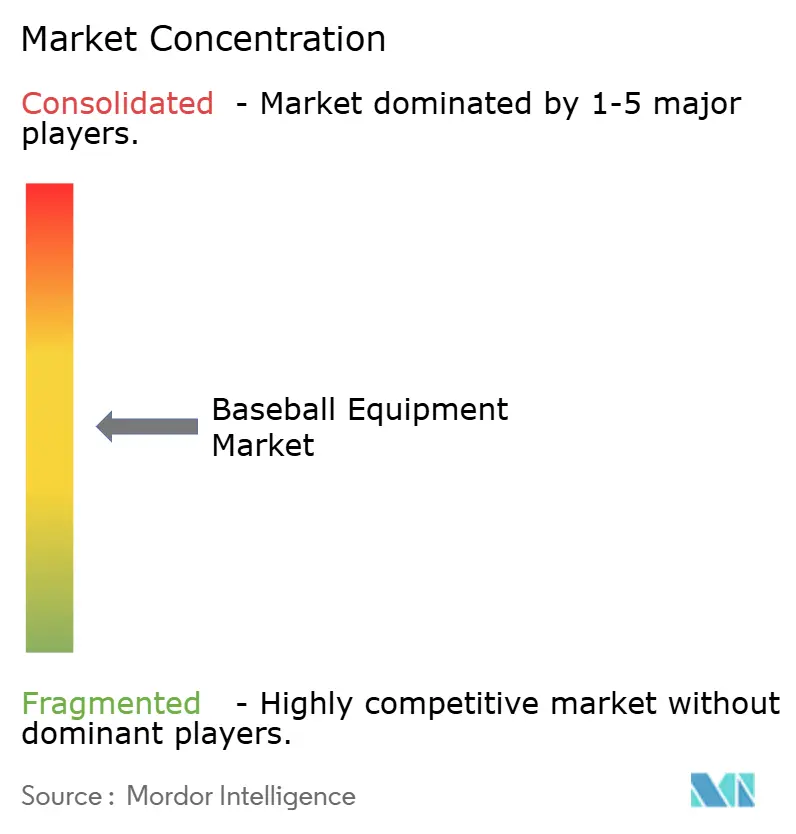
| Market Concentration | Medium |
Major Players
*Disclaimer: Major Players sorted in no particular order Image © Mordor Intelligence. Reuse requires attribution under CC BY 4.0. |
|
Baseball Equipment Market Analysis by Mordor Intelligence
The global baseball equipment market size in 2026 is estimated at USD 20.67 billion, growing from 2025 value of USD 19.73 billion with 2031 projections showing USD 26.09 billion, growing at 4.76% CAGR over 2026-2031. The market is experiencing steady growth, primarily driven by the increasing organization of baseball games and rising participation in baseball and softball, particularly in North America, Japan, and parts of South America. In June 2025, the NCAA Division I baseball tournament, which began with 64 teams, advanced through regional and super regional stages, culminating in the Men’s College World Series (MCWS) in Omaha, Nebraska. Growing youth participation and the expansion of school and college-level tournaments are driving demand for products such as bats, gloves, balls, and protective gear. Technological advancements, including lightweight composite bats and performance-enhancing gloves, are attracting both amateur and professional players. Companies like Easton and Rawlings are investing in product innovation to improve grip and swing dynamics. Additionally, the increasing popularity of women’s baseball leagues and the growth of recreational baseball in emerging markets such as South Korea and Taiwan are contributing to market expansion. Endorsement deals and strategic partnerships with Major League Baseball (MLB) are further enhancing brand visibility and boosting product sales.
Key Report Takeaways
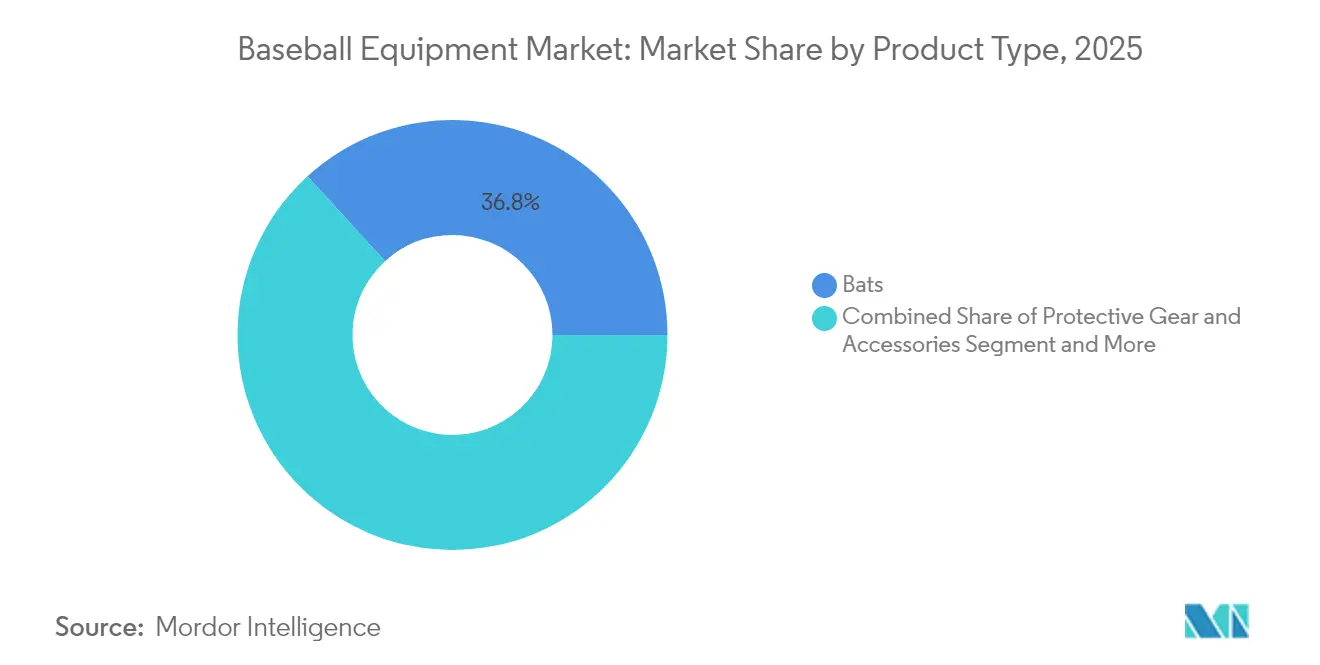
- By product type, bats led with 36.78% of the 2025 baseball equipment market share, while protective gear and accessories registered the fastest 4.92% CAGR.
- By end-user, adult players accounted for 66.88% of 2025 revenue, whereas the children’s segment is projected to expand at a 5.06% CAGR from 2026-2031.
- By buyer type, individual purchasers held 76.13% of 2025 revenue; institutional buyers are forecast to post a 4.9% CAGR through 2031.
- By distribution channel, offline retail stores retained 71.87% of revenue in 2025, while online platforms are on track for a 5.12% CAGR to 2031.
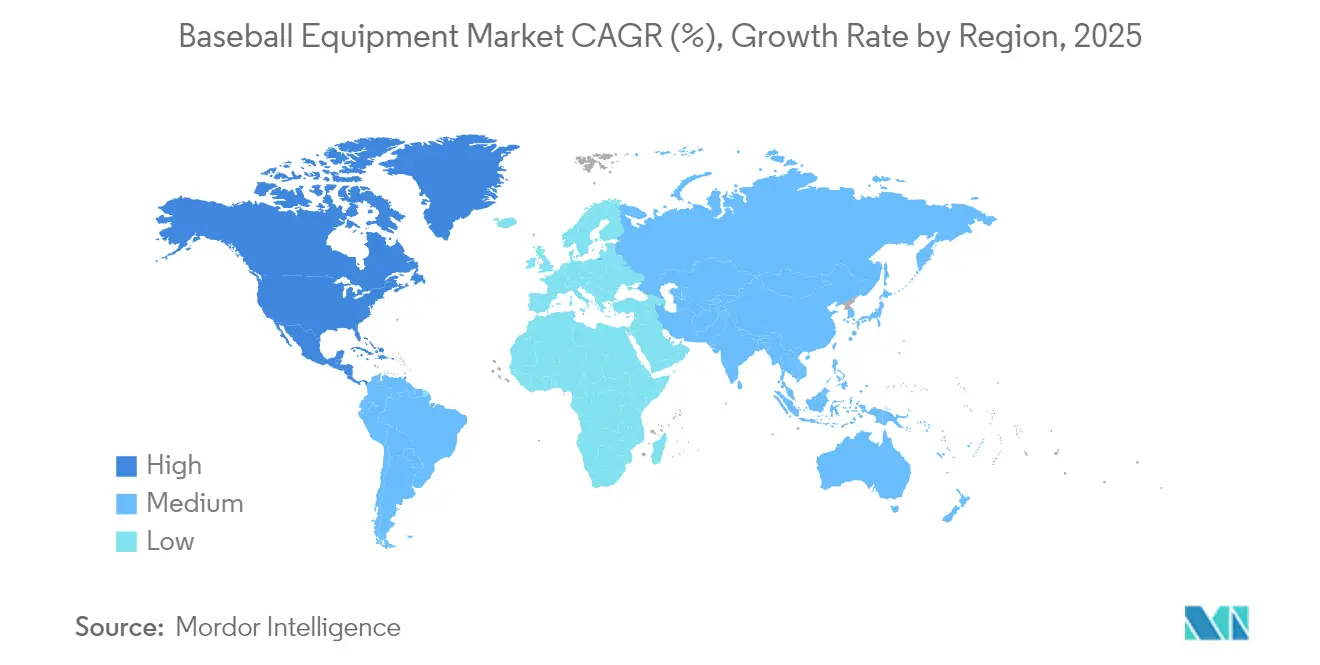
- By geography, North America dominated with 53.33% of 2025 revenue, yet Asia-Pacific is the fastest region with a 5.58% CAGR expected through 2031.
Note: Market size and forecast figures in this report are generated using Mordor Intelligence’s proprietary estimation framework, updated with the latest available data and insights as of 2026.
Global Baseball Equipment Market Trends and Insights
Drivers Impact Analysis*
| Driver | (~) % Impact on CAGR Forecast | Geographic Relevance | Impact Timeline |
|---|---|---|---|
| Increasing Awareness of Health and Fitness | +0.8% | Global, strongest in North America & Europe | Medium term (2-4 years) |
| Expansion of Baseball Leagues and Tournaments | +0.9% | Asia-Pacific core, spill-over to MEA and South America | Long term (≥ 4 years) |
| Government Initiatives and Grassroots Programs | +0.7% | North America & Asia-Pacific, emerging in Europe | Medium term (2-4 years) |
| Increasing Youth Participation | +1.0% | Global, with accelerated growth in Asia-Pacific | Long term (≥ 4 years) |
| Technological Advancements in Equipment | +0.6% | North America & Europe, expanding to Asia-Pacific | Short term (≤ 2 years) |
| Influence of Celebrity Endorsements and Branding | +0.4% | Global, concentrated in major markets | Short term (≤ 2 years) |
| Source: Mordor Intelligence | |||
Increasing Youth Participation
In 2024, baseball participation in the United States increased to 17.3 million individuals aged six and above, compared to 16.7 million in 2023, as reported by the Outdoor Foundation and the Sports and Fitness Industry Association (SFIA)[1]Source: Sports and Fitness Industry Association, "2025 Sports, Fitness, and Leisure Activities Topline Participation Report", www.sfia.org. The World Baseball Softball Confederation (WBSC) continues to drive recurring demand for baseball equipment through U12 and U18 regional championships, where teams frequently upgrade their gear. In Japan, school-based leagues act as critical pathways to professional baseball careers, encouraging families to invest in high-quality bats, helmets, and advanced training tools. Additionally, Asia-Pacific ministries of sport recognize baseball's contribution to social cohesion and allocate funding to develop youth fields, which, in turn, stimulate local retail markets. These factors collectively sustain a steady demand for baseball equipment and normalize replacement cycles. The growing emphasis on youth development and competitive play further drives the need for premium gear. As players advance through different levels, the demand for specialized equipment rises, creating consistent market opportunities. This dynamic underscores the importance of baseball as a key driver of retail activity and equipment innovation in the global sports market.
Government Initiatives and Grassroots Programs
In June 2025, the Oregon Legislature approved Senate Bill 110 with bipartisan support, marking a significant step toward establishing professional baseball in Portland. The bill allocated USD 800 million in bonds to fund the construction of a state-of-the-art baseball stadium on Portland’s South Waterfront [2]Source: Oregon Legislature,"2025 Regular Session", www.oregonlegislature.gov. Globally, municipalities are adopting similar strategies by integrating stadium development with school diamond renovations, driving demand for essential equipment such as bats, helmets, and catcher sets. Nike’s Reviving Baseball in Inner Cities (RBI) initiative strategically addresses these needs by providing no-cost equipment and discounted pricing to eligible clubs, effectively reducing financial barriers for low-income families. Such initiatives not only foster increased participation but also stimulate long-term demand for baseball equipment. Collaborative efforts like these ensure that equipment demand aligns with facility expansion rather than solely relying on player growth. Additionally, standardization requirements within these programs encourage the purchase of certified goods, thereby strengthening the competitive edge of premium brands. Such developments highlight the intersection of infrastructure investment and market growth opportunities in the sports equipment industry.
Expansion of Baseball Leagues and Tournaments
The global expansion of professional baseball leagues and the increasing prominence of international tournaments are driving significant growth in the demand for premium baseball equipment. In November 2024, Baseball United, the first professional baseball league catering to the Middle East and South Asia, announced the official schedule for its inaugural Baseball United Arab Classic tournament. The event will be hosted at the newly launched Baseball United Ballpark in Dubai. Emerging leagues across various regions are creating new opportunities for manufacturers of bats, gloves, and protective gear. As professional standards continue to rise, teams and players are prioritizing investments in advanced equipment to enhance both performance and safety. For example, the growing global audience for the World Baseball Classic has not only fueled interest in the sport but also led to increased sales of baseball equipment. Additionally, sponsorship agreements and broadcasting rights are fostering brand collaborations, encouraging companies like Mizuno and Wilson to introduce high-end product lines. This professionalization trend is also influencing amateur players, who are increasingly purchasing professional-grade gear to emulate their role models.
Technological Advancements in Equipment
Technological advancements in baseball equipment are significantly transforming the market by enhancing performance, safety, and user experience, thereby driving global growth. Innovations such as carbon fiber composite bats are delivering superior swing speed and durability, making them highly appealing to both amateur and professional players. Smart gloves equipped with pressure sensors are undergoing testing to assist players in analyzing grip strength and catching efficiency, showcasing the integration of technology into traditional equipment. In January 2024, a 'Smart Glove' developed at UBC was introduced with the primary aim of aiding stroke recovery, highlighting the potential for cross-industry applications. Leading companies like Wilson and Rawlings are incorporating advanced materials, such as moisture-wicking and breathable fabrics, into gloves and apparel to improve player comfort. Additionally, bat sensors like Blast Motion are enabling players to track swing metrics, facilitating data-driven training and technique refinement. These technologically advanced products are attracting players seeking a competitive edge, thereby driving repeat purchases and increasing demand for premium offerings. As high-tech gear gains traction among teams and training academies, demand is expanding beyond traditional markets like the United States and Japan to emerging baseball hubs worldwide.
Restraints Impact Analysis*
| Restraint | (~) % Impact on CAGR Forecast | Geographic Relevance | Impact Timeline |
|---|---|---|---|
| Risk of Injury and Safety Concerns | –0.3% | Global, heightened focus in North America | Medium term (2-4 years) |
| Lack of Time and Lifestyle Constraints | –0.4% | Developed markets, particularly North America & Europe | Long term (≥ 4 years) |
| Limited Access to Facilities and Infrastructure | –0.5% | Emerging markets, concentrated in Asia-Pacific & MEA | Long term (≥ 4 years) |
| Counterfeit and Low-quality Products | –0.2% | Global, concentrated in price-sensitive markets | Short term (≤ 2 years) |
| Source: Mordor Intelligence | |||
Risk of Injury and Safety Concerns
Concussion studies and arm overuse data highlight injury risks, shaping parental decisions on sports enrollment. In 2023, 14.2% of U.S. high school students reported at least one concussion from sports or physical activities, as per the Centers for Disease Control and Prevention. Updated bat standards and age-specific pitching guidelines from USA Baseball’s Medical Safety Committee have increased compliance costs. National Operating Committee on Standards for Athletic Equipment's third-party certification requirements further elevate development expenses, particularly for smaller brands. Premium safety equipment, such as helmets and chest guards, justifies higher price points, but cost-conscious households may delay purchases, affecting short-term sales growth. Clubs and leagues also face financial challenges when required to upgrade full gear inventories, adding to budgetary pressures.
Limited Access to Facilities and Infrastructure
Facility shortages in emerging markets, including rural Indonesia, Vietnam, and parts of Africa, hinder team formation and market growth. World Baseball Softball Confederation Oceania reports indicate that over half of the Pacific Island nations lack sufficient regulation of diamonds, leading to shared practice slots and inconsistent participation. In the United States and Europe, urban expansion and limited maintenance budgets strain field availability. Delayed turf renewal forces leagues to postpone schedules, while families defer equipment purchases. Without adequate investment in infrastructure, grassroots campaigns fail to maximize participation potential. This limitation directly impacts the growth trajectory of the baseball equipment market. Addressing these challenges is critical to unlocking market opportunities.
*Our forecasts treat driver/restraint impacts as directional, not additive. The impact forecasts reflect baseline growth, mix effects, and variable interactions.
Segment Analysis
By Product Type: Smart Technology Elevates Premium Categories
In 2025, the bat segment emerged as the largest revenue contributor in the baseball equipment market, accounting for 36.78% of total earnings. The introduction of premium sensor-enabled bats, such as the CATX2 Smart model priced above USD 499, has significantly increased average selling prices and improved brand profitability. Apparel ranked as the second-highest revenue generator, driven by consistent replacement cycles and its growing appeal as a fashion statement beyond the field. Ball sales, while characterized by high volumes, generate lower revenue per unit; however, frequent usage ensures a steady demand for replenishment. Protective gear is projected to experience the fastest growth, with a 4.92% CAGR, as stricter safety standards enforced by medical committees and insurance policies drive demand.
Product offerings such as NOCSAE-approved helmets and Nextiles-backed sleeves are reshaping the market by combining safety with performance, encouraging stakeholders to prioritize advanced equipment. The U12 segment has seen a rise in protective gear purchases following USA Baseball's mandate requiring composite helmets with extended ear coverage, leading to recurring seasonal demand. Additionally, smart accessories, such as Diamond Kinetics’ swing trackers and pocket radars, are creating new revenue streams through subscription models, further enhancing the market's overall growth by increasing per-player spending.


By End-User: Adult Dominance Faces Youth Acceleration
In 2025, adult players accounted for 66.88% of the turnover, driven by increased discretionary spending, multiple league memberships, and a preference for owning various bats for wood, alloy, and composite competitions. Premium gloves, often made from steerhide or kip leather and priced over USD 300 per unit, are favored by adult recreation leagues, contributing to the growth in padding value. Meanwhile, the children's segment is witnessing a robust 5.06% CAGR, spurred by WBSC-sanctioned youth events and the heightened visibility of Little League broadcasts, which in turn drive equipment upgrades. As per e-Stat (Japan), in a survey conducted in November 2024 in Japan, the age group with the highest sports participation rate among adults in Japan was the cohort between 18 and 19 years, with 84.4%.
In emerging Asian markets, parents are making early investments in youth development academies, often bundling equipment packages into tuition fees, which stabilizes demand. Local federations are echoing this trend by offering gear subsidies, especially to boost rural participation. Furthermore, safety regulations like the USABAT certification are prompting families to adopt standardized barrel performances, leading to predictable replacement cycles as children transition to the next age category. Collectively, these dynamics are expanding the baseball equipment market, prompting brands to customize sizing, colors, and technological features for younger athletes.
By Buyer Type: Individual Preferences Drive Institutional Growth
In 2025, individuals contributed 76.13% of the revenue, driven by the strong culture of personal ownership prevalent in regions such as North America and Japan. Consumers increasingly prefer personalized equipment, with players customizing glove lacing and bat knob designs. This trend has bolstered the popularity of direct-to-consumer platforms offering advanced tools like volumetric bat builders and engraving services. On the other hand, institutional demand, forecasted to grow at a compound annual growth rate (CAGR) of 4.9%, is fueled by bulk purchases from school districts, travel programs, and academies, which align their orders with roster requirements. The recent merger of Rawlings and Easton Diamond Sports has enhanced product catalog depth, enabling the combined entity to efficiently supply season-start kits, including helmets, catcher sets, and equipment bags, tailored for entire rosters.
Bulk purchasing provides institutions with greater negotiation leverage; however, many are now prioritizing investments in advanced technology solutions. These institutions are increasingly adopting unified analytics ecosystems that integrate with coaching dashboards, offering a premium service. Subscription-based platforms that connect sensor-equipped bats to team accounts enable centralized data management, allowing coaches to monitor swing metrics across multiple age groups through a single interface. This integrated approach not only drives recurring hardware upgrades with each software update but also introduces a service-oriented dimension to the baseball equipment market. Consequently, this strategy helps mitigate revenue seasonality and ensures a more consistent revenue stream throughout the year.

By Distribution Channel: Digital Transformation Accelerates Online Growth
In 2025, offline stores accounted for 71.87% of revenue, as many buyers prefer to swing bats in hitting tunnels, check glove fits, and test faceguards before making a purchase. Large-format outlets host demo days with professional staff and promote seasonal trade-in events, recycling gently used gear into beginner programs. Meanwhile, online channels are witnessing a 5.12% CAGR, as e-commerce simplifies repeat orders for items like balls, grip tape, and training aids. Post-pandemic, shoppers have grown to trust sizing guides, and brands now offer virtual bat fittings that analyze swing paths through smartphones.
Direct-to-consumer websites collect detailed data on bat drop preferences and exit velocity goals, allowing for algorithmic recommendations that boost conversion rates. Limited-edition colorways and MLB player signature lines make their online debut, creating a sense of urgency for purchases. Marketplace platforms further enhance the landscape by enabling global cross-border sales, thanks to region-specific compliance filters that assure buyers their bats align with local federation rules. This omnichannel strategy not only broadens reach but also fuels the overall growth of the baseball equipment market, appealing to both tactile shoppers and digital enthusiasts.
Geography Analysis
In 2025, North America contributed 53.33% of the revenue. The region's advanced infrastructure, high discretionary income, and cultural affinity drove multiple league registrations per athlete. Oregon's USD 800 million stadium project reflected ongoing public investment and signaled facility upgrades requiring new gear (oregonlive.com). U.S.-based brands led product development, ensuring domestic consumers accessed new releases first. High sensor adoption boosted spending and drove premium categories in the baseball equipment market.
Asia-Pacific recorded the fastest growth with a 5.58% CAGR, supported by policy initiatives and a large population base. Japan's franchise expansion strengthened talent scouting and boosted high school equipment sales. WBSC Asia events in South Korea, Taiwan, and the Philippines drove demand for NOCSAE-compliant helmets, ensuring tournament standards. Chinese municipal subsidies for field construction in secondary cities expanded baseball's reach. Local factories producing composite bats and gloves enabled brands to quickly adapt SKUs, enhancing market presence.
WBSC Europe enforced stricter equipment certifications, channeling spending to approved suppliers. Germany and the Czech Republic outpaced the average due to school programs promoting baseball for Olympic development. South America, led by Venezuela and Colombia, driven by professional expatriates inspiring local investments. Africa, though nascent, supported by MLB alumni kit donations despite limited diamond access. These regional trends underscored the need for global brands to tailor strategies by market maturity within the baseball equipment sector.

Competitive Landscape
The baseball equipment market is moderately concentrated, with prominent players such as Adidas AG, Franklin Sports Inc., Nike Inc., Anta Sports Products Limited, and Mizuno Corporation. Strategic technology partnerships are reshaping the competitive landscape. For example, Diamond Kinetics has licensed its swing-tracking firmware to manufacturers, embedding advanced analytics into traditional equipment. Similarly, Motus Global has secured collegiate club contracts, integrating injury-prevention metrics through its sensor sleeve. Nextiles, by collaborating with fabric suppliers, has scaled its smart yarn technology to measure joint angles, positioning itself as a key component supplier for glove and apparel brands (nextiles.tech). These collaborations emphasize the growing importance of data platforms, cloud services, and subscription-based models as competitive differentiators in the market.
In emerging markets, local brands focus on cost competitiveness, but compliance with NOCSAE and WBSC standards has introduced significant regulatory challenges. Larger US and Japanese brands leverage their scale to expedite the certification of new models, creating pressure on smaller competitors with limited testing budgets. However, the rise of online marketplaces has lowered entry barriers, enabling micro-brands to specialize in niche products like custom grip wraps and bat-knob accessories. This shift allows smaller players to achieve growth without requiring substantial inventory investments.
Brand visibility remains a critical factor in both mature and developing regions. Sponsorship of youth academies and securing naming rights for major tournaments continue to be effective strategies for building brand recognition. These initiatives not only enhance market presence but also foster long-term customer loyalty, ensuring sustained growth in the competitive baseball equipment market.
Baseball Equipment Industry Leaders
-
Adidas AG
-
Nike, Inc.
-
Franklin Sports Inc.
-
Mizuno Corporation
-
Anta Sports Products Limited
- *Disclaimer: Major Players sorted in no particular order

Recent Industry Developments
- June 2025: Rawlings launched its Heart of the Hide gloves, emphasizing their premium quality. These gloves are manufactured using US steerhide leather, which integrates with a deer-tanned cowhide palm lining, soft full-grain finger back linings, and durable leather laces to ensure longevity.
- April 2025: Easton Diamond Sports introduced “The DUB,” a next-generation composite performance bat featuring an innovative double-barrel construction. “The DUB” is the only USSSA-certified double-wall bat currently available, representing Easton's first implementation of this advanced technology in a baseball bat.
- August 2024: Louisville Slugger announced plans to introduce the 2025 Atlas on its custom design platform. The bat featured a pink-themed Atlas colorway, inspired by the growing trend of customer-driven online customization.


Global Baseball Equipment Market Report Scope
Baseball equipment is a type of sports equipment that is specifically designed for playing baseball.
The baseball equipment market is segmented by product type, distribution channel, and geography. By product type, the market is segmented into bat, ball, helmet, glove, and other product types. By distribution channel, the market is segmented into supermarkets/hypermarkets, specialty sports stores, online stores, and other distribution channels. It provides an analysis of emerging and established economies across the world, comprising North America, Europe, South America, Asia-Pacific, and Middle East and Africa. For each segment, the market sizing and forecasts are provided in terms of value in USD million.
| Bats |
| Apparel |
| Balls |
| Protective Gear and Accessories |
| Adult |
| Kids/Children |
| Individual |
| Institutional |
| Offline Retail Stores |
| Online Retail Stores |
| North America | United States |
| Canada | |
| Mexico | |
| Rest of North America | |
| Europe | Germany |
| United Kingdom | |
| Italy | |
| France | |
| Spain | |
| Netherlands | |
| Poland | |
| Belgium | |
| Sweden | |
| Rest of Europe | |
| Asia-Pacific | China |
| India | |
| Japan | |
| Australia | |
| Indonesia | |
| South Korea | |
| Thailand | |
| Singapore | |
| Rest of Asia-Pacific | |
| South America | Brazil |
| Argentina | |
| Colombia | |
| Chile | |
| Peru | |
| Rest of South America | |
| Middle East and Africa | South Africa |
| Saudi Arabia | |
| United Arab Emirates | |
| Nigeria | |
| Egypt | |
| Morocco | |
| Turkey | |
| Rest of Middle East and Africa |
| By Product Type | Bats | |
| Apparel | ||
| Balls | ||
| Protective Gear and Accessories | ||
| By End-User | Adult | |
| Kids/Children | ||
| By Buyer Type | Individual | |
| Institutional | ||
| By Distribution Channel | Offline Retail Stores | |
| Online Retail Stores | ||
| By Geography | North America | United States |
| Canada | ||
| Mexico | ||
| Rest of North America | ||
| Europe | Germany | |
| United Kingdom | ||
| Italy | ||
| France | ||
| Spain | ||
| Netherlands | ||
| Poland | ||
| Belgium | ||
| Sweden | ||
| Rest of Europe | ||
| Asia-Pacific | China | |
| India | ||
| Japan | ||
| Australia | ||
| Indonesia | ||
| South Korea | ||
| Thailand | ||
| Singapore | ||
| Rest of Asia-Pacific | ||
| South America | Brazil | |
| Argentina | ||
| Colombia | ||
| Chile | ||
| Peru | ||
| Rest of South America | ||
| Middle East and Africa | South Africa | |
| Saudi Arabia | ||
| United Arab Emirates | ||
| Nigeria | ||
| Egypt | ||
| Morocco | ||
| Turkey | ||
| Rest of Middle East and Africa | ||


Key Questions Answered in the Report
What is the current Baseball Equipment Market size?
The Baseball Equipment Market is valued at USD 20.67 billion in 2026 and projected to register a CAGR of 4.76% during the forecast period (2026-2031)
Who are the key players in Baseball Equipment Market?
Adidas AG, Nike, Inc., Franklin Sports Inc., Anta Sports Products Limited, and Mizuno Corporation are the major companies operating in the Baseball Equipment Market.
Which is the fastest growing region in Baseball Equipment Market?
Asia-Pacific is estimated to grow at the highest CAGR over the forecast period (2026-2031).
Which region has the biggest share in Baseball Equipment Market?
In 2025, the North America accounts for the largest market share in Baseball Equipment Market.
Page last updated on:


