
Evidence Management Market Size and Share
Market Overview
| Study Period | 2020 - 2031 |
|---|---|
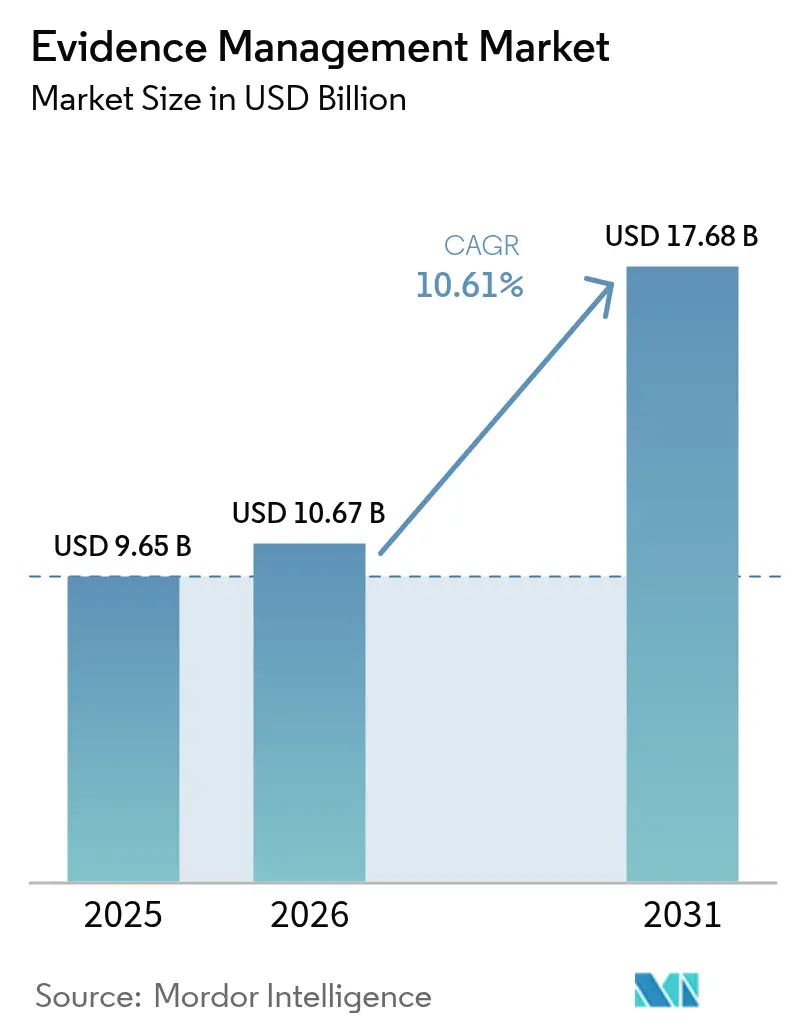
| Market Size (2026) | USD 10.67 Billion |
| Market Size (2031) | USD 17.68 Billion |
| Growth Rate (2026 - 2031) | 10.61 % |
| Fastest Growing Market | Asia Pacific |
| Largest Market | North America |
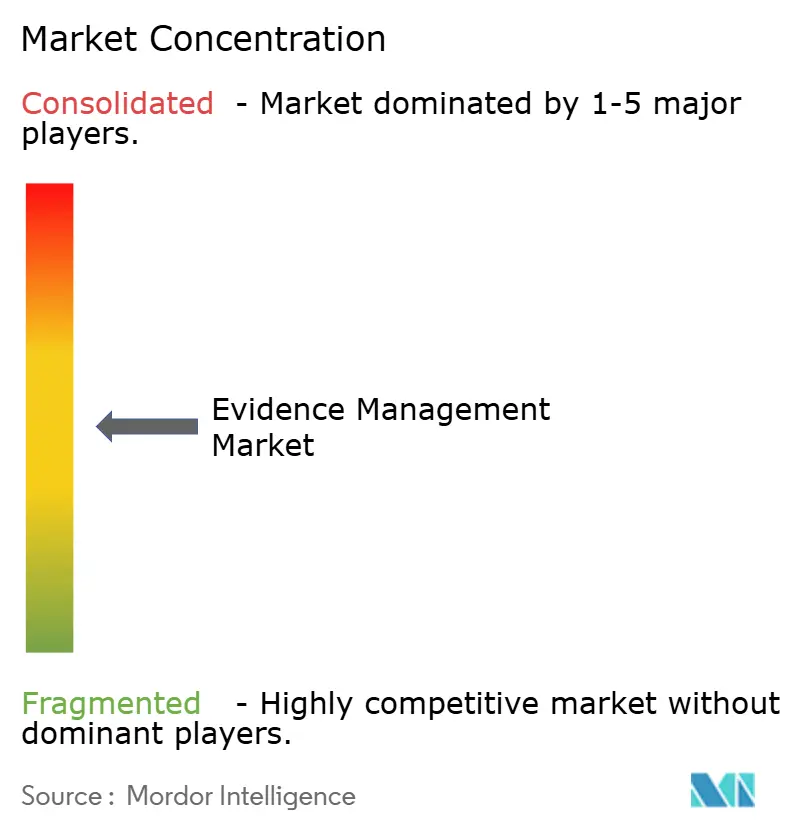
| Market Concentration | Medium |
Major Players *Disclaimer: Major Players sorted in no particular order Image © Mordor Intelligence. Reuse requires attribution under CC BY 4.0. | |
Evidence Management Market Analysis by Mordor Intelligence
The Evidence Management market size is expected to grow from USD 9.65 billion in 2025 to USD 10.67 billion in 2026 and is forecast to reach USD 17.68 billion by 2031 at 10.61% CAGR over 2026-2031. This swift expansion reflects agencies’ shift from basic on-premise storage toward cloud-first, AI-enabled ecosystems that collect, classify, and analyze rapidly growing volumes of multimedia evidence. Cloud deployment, which already supports 63.63% of total workflows, continues to outpace on-premise alternatives because subscription pricing, auto-scaling, and FedRAMP / CJIS compliance reduce both capital cost and procurement friction. At the same time, aggressive federal and state grant programs, such as the Bureau of Justice Assistance’s USD 400 million body-camera fund, are pushing even small departments toward integrated camera-plus-software bundles that guarantee chain-of-custody, facial recognition, and speech-to-text functions out of the box. Hardware still contributes the single largest revenue stream, but professional and managed services are the fastest growing line item as agencies seek vendor expertise to integrate AI analytics, cold-storage tiering, and courtroom presentation modules. In parallel, smart-city surveillance networks, 5G backhaul, and edge compute nodes are injecting petabytes of video into municipal evidence vaults every month, compelling administrators to migrate from siloed record rooms to unified, cross-agency repositories able to flag weapons, vehicles, or license plates in near real time.
Key Report Takeaways
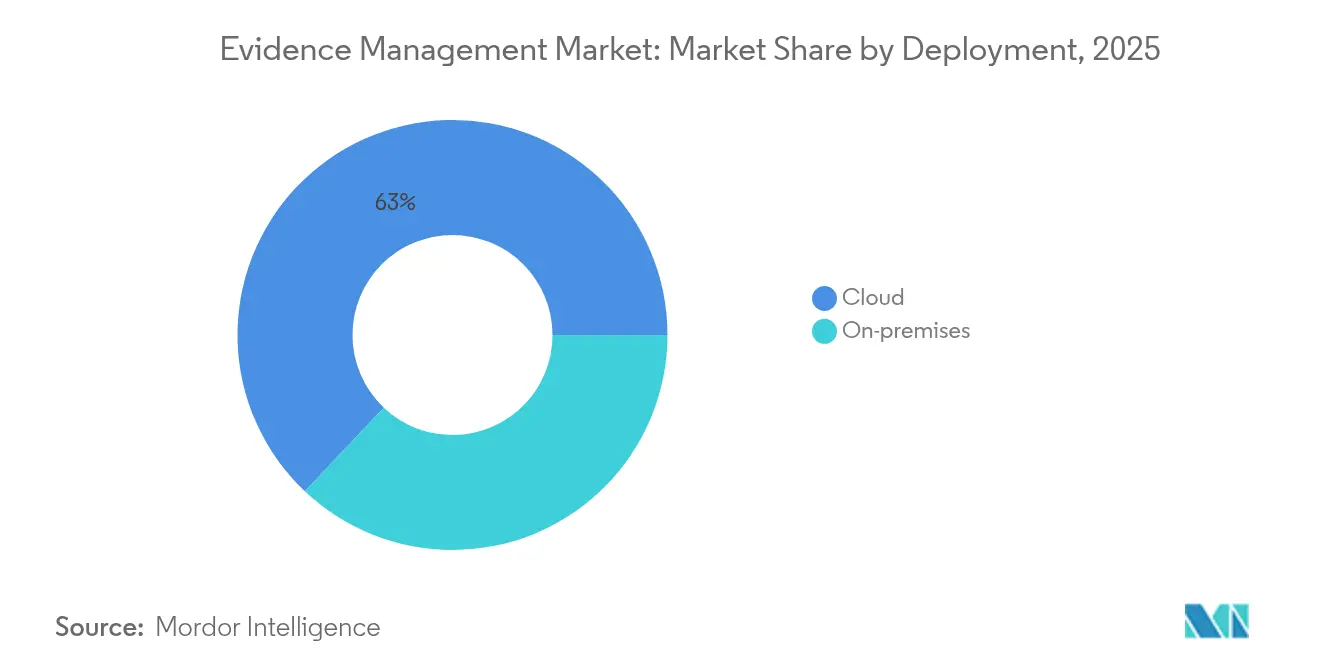
- By deployment, cloud models commanded 62.95% of Evidence Management market share in 2025 and cloud is recording the highest 12.03% CAGR through 2031.
- By component, services are advancing at an 11.28% CAGR through 2031 in the Evidence Management market and hardware recorded the largest share of 48.17% in 2025.
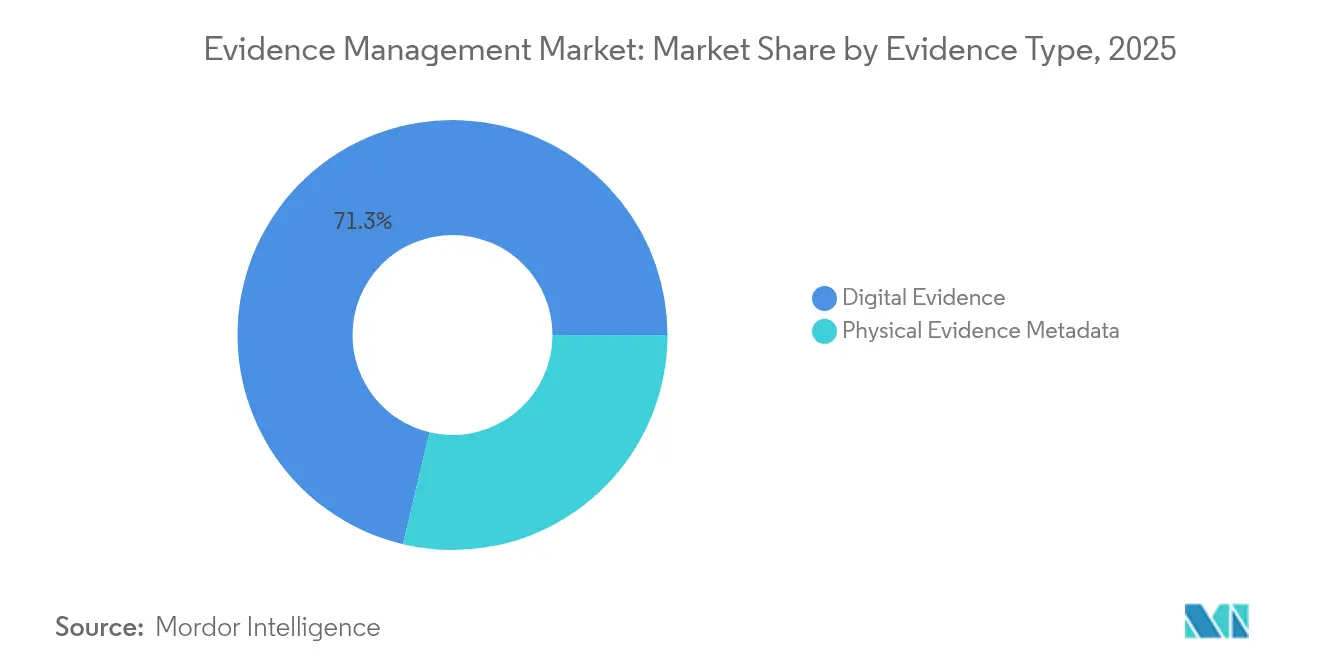
- By evidence type, digital formats accounted for 71.30% of the Evidence Management market size in 2025 digital formats are recording the highest 12.33% CAGR through 2031.
- By end user, transportation agencies are recording the highest 11.72% CAGR through 2031 in the Evidence Management market digital formats and law-enforcement agencies recorded the largest share of 54.08% in 2025.
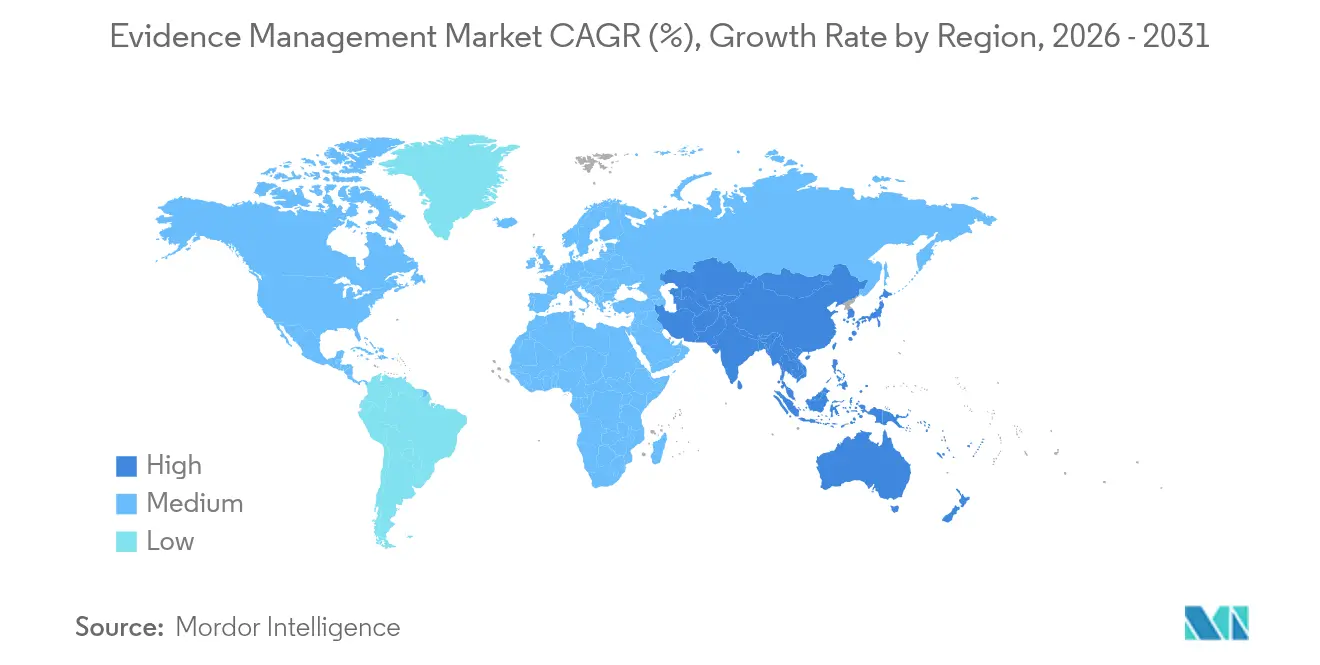
- By geography, Asia-Pacific is projected to expand at an 11.45% CAGR between 2026–2031 in the Evidence Management market and North America recorded the largest share of 38.48% in 2025.
Note: Market size and forecast figures in this report are generated using Mordor Intelligence’s proprietary estimation framework, updated with the latest available data and insights as of 2026.
Market Trends and Insights
Drivers Impact Analysis of Evidence Management Market*
| Driver | (~) % Impact on CAGR Forecast | Geographic Relevance | Impact Timeline |
|---|---|---|---|
| Rising global crime rate boosting digital-evidence demand | +1.8% | Global, with concentration in North America and EU | Medium term (2-4 years) |
| Proliferation of body-worn and in-car cameras among police forces | +2.1% | North America core, expanding to APAC | Short term (≤ 2 years) |
| Government funding waves for public-safety technology upgrades | +1.9% | North America and EU primary, selective APAC markets | Short term (≤ 2 years) |
| Explosive growth in multimedia data generated by smart cities | +1.2% | APAC core, spill-over to MEA and Latin America | Long term (≥ 4 years) |
| AI-driven analytics to clear evidence backlogs | +2.3% | Global, early adoption in North America and EU | Medium term (2-4 years) |
| Cross-agency data-interoperability mandates | +1.5% | North America and EU, emerging in APAC | Long term (≥ 4 years) |
| Source: Mordor Intelligence | |||
Rising Global Crime Rate Boosting Digital-Evidence Demand
Violent-crime and cyber-fraud caseloads remain elevated, prompting prosecutors to demand indisputable digital proof for successful convictions.[1]Federal Bureau of Investigation, “Uniform Crime Reporting Program,” fbi.govPatrol officers now generate 40–60 hours of video each month, quadruple the 2020 baseline, forcing records units to abandon DVD archives for elastic cloud libraries that auto-index every clip. Departments adopting Evidence Management market platforms with built-in transcription shave weeks off discovery timelines because detectives can keyword search across hundreds of terabytes of footage. As cities add license-plate readers and acoustic gunshot sensors, metadata streams flood into the same repositories, strengthening situational awareness and speeding time-to-charge. Without these AI-assisted hubs, agencies risk evidence backlogs that undermine public trust and trial efficiency.
Proliferation of Body-Worn and In-Car Cameras Among Police Forces
More than 20,000 agencies worldwide now deploy body cameras, and large rollouts, such as the Royal Canadian Mounted Police’s 2024 national program, prove the technology’s mainstream status.[2]Royal Canadian Mounted Police, “Body-Worn Camera Program Implementation,” rcmp-grc.gc.ca Each officer produces 8–12 GB of data per shift, which is automatically uploaded once the device docks, eliminating the need for manual file transfer. Modern Evidence Management market software encrypts footage in transit, assigns tamper-proof hashes, and links every clip to CAD incident numbers, creating a cradle-to-courtroom audit trail. Vendors increasingly bundle unlimited tier-one storage and AI redaction, locking customers into multi-year contracts while guaranteeing predictable operating expense. As dash-cam and UAV footage join the mix, multi-sensor stitching enables analysts to track a suspect from the street to the alley to arrest, providing jurors with a seamless narrative that enhances conviction rates.
Government Funding Waves for Public-Safety Technology Upgrades
Federal incentives remain pivotal: the COPS Office disbursed USD 200 million for tech modernization in 2024, while the USD 1.2 billion Infrastructure Act carved out allocations for broadband-ready evidence vaults.[3]U.S. Department of Justice, “COPS Office Technology Grant Programs,” justice.gov Grant guidelines now insist on CJIS-compliant cloud and open-API architectures, nudging departments away from proprietary on-prem frameworks. Smaller towns unable to finance standalone platforms increasingly join county-level consortiums that share a single Evidence Management market instance, saving 30–40% in total cost of ownership while standardizing workflows across jurisdictions. These pooled models also simplify discovery for district attorneys who can subpoena a single repository rather than chase DVDs across multiple precincts.
AI-Driven Analytics to Clear Evidence Backlogs
Axon’s Evidence.com already parses more than 400 petabytes of stored media, surfacing license plates, weapons or faces in minutes.[4]Axon Enterprise, “Evidence.com Platform Capabilities,” axon.com Similar services now integrate large language models, allowing officers to type “show red sedan leaving scene at 14:30” and receive instant clip retrieval. Machine vision narrows review time from hours to seconds, freeing detectives for field work and slashing overtime budgets. Prosecutors leverage autogenerated transcripts and synchronized video-text timelines to build briefs faster, while defense teams benefit from rapid disclosure, supporting fair-trial principles. As algorithms mature, predictive tagging identifies patterns across cases, linking burglaries by common getaway car, for example, accelerating serial-crime resolution and elevating Evidence Management market adoption.
Restraints Impact Analysis of Evidence Management Market*
| Restraint | (~) % Impact on CAGR Forecast | Geographic Relevance | Impact Timeline |
|---|---|---|---|
| High long-term cloud and cold-storage costs | -1.7% | Global, acute in budget-constrained agencies | Medium term (2-4 years) |
| Cyber-security and data-integrity vulnerabilities | -0.9% | Global, heightened in high-profile jurisdictions | Short term (≤ 2 years) |
| Legal uncertainty over jurisdictional data sovereignty | -1.1% | EU and APAC primary, emerging in North America | Long term (≥ 4 years) |
| Limited broadband connectivity in rural policing | -0.8% | Rural North America, APAC, MEA, South America | Medium term (2-4 years) |
| Source: Mordor Intelligence | |||
High Long-Term Cloud and Cold-Storage Costs
CJIS mandates push departments to retain homicide footage for decades, and at USD 0.08–0.12 per GB per month, expenses climb quickly. A mid-size force archiving 5 PB per year spends more than USD 500,000 annually just on storage. Hybrid tiers mitigate cost, hot buckets for active cases, glacier tiers for closed files, but retrieval fees and audit requirements complicate budgeting. Vendors counter with flat-rate “all you can store” plans yet lock agencies into proprietary formats that hinder migration. Municipal CFOs therefore demand rigorous total-cost models before greenlighting multi-year cloud contracts, slowing the broader Evidence Management market rollout.
Cyber-Security and Data-Integrity Vulnerabilities
Ransomware struck several U.S. police evidence systems in 2024, highlighting the attack surface of always-online repositories. Successful breaches expose witness identities, jeopardize ongoing investigations and, in extreme cases, force prosecutors to drop charges when evidence chains are compromised. Agencies now adopt zero-trust frameworks, multifactor authentication and blockchain-anchored hashes, but these safeguards raise complexity and training needs. Cloud vendors boast ISO 27001 and FedRAMP High certifications, yet skeptics argue that any centralized trove presents a tempting target. Insurance premiums for cyber-coverage are rising, penciling an additional 3–5% onto annual Evidence Management market operating costs.
*Our forecasts treat driver/restraint impacts as directional, not additive. The impact forecasts reflect baseline growth, mix effects, and variable interactions.
Evidence Management Market Segment Analysis
By Deployment:
Cloud Models Underpin Inter-Agency CollaborationCloud workflows generated 62.95% of Evidence Management market share in 2025 and are projected to expand at a 12.03% CAGR through 2031. This dominance stems from rapid provisioning, usage-based billing and integrated AI toolkits that on-prem setups rarely match. The Transportation Security Administration’s national rollout of a cloud vault for airport footage underlines federal confidence in third-party infrastructure. Agencies tap global CDNs to stream critical clips to prosecutors within seconds, eliminating courier delays. Meanwhile, hybrid models appease teams worried about subpoena latency by caching recent footage in local appliances while syncing archives to the cloud overnight. Cloud’s elastic edge nodes even enable in-camera analytics, flagging a weapon just seconds after capture, making it the de-facto backbone for multi-agency task forces.
On-premise deployments persist where sovereign-data statutes or low-latency autonomous operation is critical, such as large metropolitan forces with existing data centers. Yet even those environments increasingly bolt on cloud burst capacity during major events to avoid capital spikes. Vendors, sensing the shift, now release updates cloud-first before porting features to on-prem clients, reinforcing a virtuous cycle that cements the cloud as the primary Evidence Management market delivery model.



By Component:
Hardware Purchases Anchor Long-Term Service ContractsHardware captured 48.17% of 2025 revenues, reflecting continual replacement of first-generation body cameras with 4K, wide-dynamic-range units and rugged dash cams built for 5G backhaul. Each hardware order typically bundles multiyear SaaS licenses, ensuring predictable annuity streams. Services, though smaller in absolute terms, are on pace for an 11.28% CAGR, as departments outsource data migration, user training and policy configuration to vendor-led teams. That trend aligns with the Evidence Management market size allocated to services, which is expected to surpass USD 4.47 billion by 2031.
Software revenue follows hardware footprints yet accelerates once agencies exhaust grant funds and shift to evidence analytics, transcription and courtroom-ready packaging. Cross-platform SDKs invite third-party developers to craft redaction, license-plate recognition and chain-of-custody dashboards, widening ecosystem stickiness. Over time, differentiating value lies not in the camera itself but in AI models that cut review labor by 70%, cementing integrated hardware-plus-software stacks as the preferred procurement package.
By Evidence Type:
Digital Formats Eclipse Physical ExhibitsDigital artifacts represented 71.30% of 2025 volumes, a figure poised to climb as video dominates courtroom narratives. Video alone accounts for roughly 60% of incoming bits, followed by audio from interviews and 911 calls. The Evidence Management market size tied to video analytics is forecast to expand at 12.33% CAGR through 2031 as prosecutors demand frame-accurate object tagging to expedite discovery. Document evidence, emails, chat logs, social posts, adds another growth vein, particularly for fraud and cybercrime cases.
Physical items still matter, but sensors, barcodes and RFID tags now digitize chain-of-custody events, inserting metadata directly into the same repository as surveillance clips. Synthetic-content detection modules combat deep-fake contamination, underscoring how Evidence Management market platforms no longer just store files, they adjudicate authenticity, a core requirement for judge acceptance.
By End User:
Transportation Agencies Redefine Growth TrajectoryLaw-enforcement departments generated 54.08% of 2025 demand, confirming their central role in evidence creation. Yet transportation authorities, airports, metros, and port police are the fastest climbers, advancing 11.72% annually thanks to policy mandates and high-density passenger flows. Airport security forces integrate body-cam and CCTV feeds with access-control logs, allowing investigators to reconstruct incidents spanning from the curb to the gate.
Defense, courts, and insurance sectors add breadth: military police seek forward-deployed vaults that function offline, prosecutors request unified portals to pull exhibits directly into case files, and insurers analyze dash-cam footage to detect staged collisions. These adjacent verticals expand the total addressable Evidence Management market, encouraging vendors to modularize their offerings so that non-law enforcement buyers can adopt only the workflows they need.
Geography Analysis
North America Evidence Management Market
North America generated USD 3.71 billion in 2025, equal to 38.48% of the global Evidence Management market share, and benefits from entrenched body-cam mandates plus rich grant funnels that cushion procurement cycles. Agency collaboration across 18,000 municipal departments drives consistent refresh demand, and state legislatures continue to legislate platform interoperability, funneling new funds into software upgrades that align with CJIS and NIJ guidelines. Vendors often pilot R&D features, speech translation, automatic officer de-identifier blurring, within U.S. metropolitan forces before exporting them.
APAC Evidence Management Market
Asia-Pacific, though smaller today, posts the fastest 11.45% CAGR as smart-city grids in India, China, Singapore and Japan plug millions of IoT lenses into centralized vaults. Regional ministries prioritize AI-enabled situational analytics, and public-private consortia finance large-scale cloud pods to satisfy data-sovereignty rules. Japan’s National Police Agency expects to equip every patrol officer with a body camera by 2026, creating an ongoing hardware and license pipeline. Meanwhile, India’s tier-2 cities replicate flagship deployments from Delhi and Mumbai, accelerating downstream demand for multilingual transcription and in-courtroom replay tools.
Europe, LATAM and Middle East Evidence Management Market
Europe advances on the back of cross-border intelligence frameworks that require standardized evidentiary formats among member states. GDPR compels vendors to embed fine-grained retention logic and citizen-deletion workflows that are now influencing feature requests in other regions. Latin America and the Middle East represent emerging frontiers; urbanization and rising public-safety budgets spur pilot projects that bundle drone video, social-media scraping and real-time video analytics. Despite bandwidth gaps in rural provinces, satellite backhaul and 5G Fixed Wireless Access help extend coverage, ensuring every jurisdiction can now subscribe to a credible Evidence Management market solution without erecting new data centers.
Mordor Intelligence provides coverage of the evidence management market across other key regional markets. Detailed country-level analysis extends to United States incorporating local coverage and market participation, as required.

Regulatory Landscape
Evidence management platforms operate across criminal procedure, privacy, and cybersecurity requirements, with compliance typically anchored by justice-sector frameworks such as CJIS in the United States and GDPR-aligned controls in Europe. In the United States, NIST published the Evidence Management Steering Committee Report (NIST SP 1500-33A) in September 2025 (updated May 1, 2026), which consolidates recommendations on retention, preservation, integrity, and disposition across justice systems. This reinforces more standardized handling and interoperable workflows.
In the European Union, the e-evidence package tightens cross-border access rules for electronic evidence through Regulation (EU) 2023/1543 and Directive (EU) 2023/1544, with Regulation (EU) 2023/1543 entering into application on August 17, 2026. The framework introduces European Production Orders and Preservation Orders, including a 10-day production window (8 hours in emergency cases) and preservation requests for 60 days, and requires relevant service providers to designate an EU legal representative by August 18, 2026. These timelines increase the need for automated chain-of-custody, auditability, and faster evidence retrieval capabilities across cloud and hybrid deployments serving EU jurisdictions.
Value Chain Analysis
The value chain starts with evidence capture and ingestion from body-worn cameras, in-car systems, fixed surveillance, public-transit video, and digital sources such as smartphones, documents, and interview audio. Upstream components include ingest connectors, metadata creation, hashing, encryption, and policy-based retention controls that preserve chain-of-custody and readiness for disclosure. Evidence volumes and format diversity (video, audio, images, documents, and device-forensics artifacts) remain the main throughput constraint, which pushes vendors to embed AI-based transcription, redaction, and object recognition to reduce manual review while maintaining admissibility.
Core processing and storage are increasingly delivered through cloud-native or private-tenant cloud architectures that support scalable storage tiers plus identity, logging, and audit functions aligned to justice-sector requirements. Platform vendors also extend into downstream collaboration portals for prosecutors and courts, discovery packaging, and courtroom presentation modules, with interoperability acting as a gating factor as agencies try to consolidate silos across police, prosecutors, and courts. As deployments move away from legacy sharing methods and integrate multiple evidence sources into unified repositories, the services layer (migration, integration, configuration, training, and ongoing support) has become more central.
Competitive Landscape
The Evidence Management market remains moderately fragmented, with the top five vendors controlling roughly 35% of global revenue. Axon leads through a vertically integrated camera-plus-cloud portfolio, reinforced by a USD 200 million expansion of international data centers announced in October 2024. Motorola Solutions follows, leveraging its 2024 acquisition of Ava Security to fold advanced video analytics into its CommandCentral platform. NICE, Genetec, Oracle and Tyler Technologies round out the field, each differentiating via open APIs, analytics libraries or court-system connectors.
Competitive intensity centers on AI features such as real-time transcription, auto-redaction and face or object recognition. Vendors race to reduce review labor hours because agency staffing budgets remain flat. Hardware makers cement relationships by bundling unlimited Evidence Management market cloud licenses with every camera sold, converting capital spend into annuity revenue. Pure-software specialists counter through hardware-agnostic ingestion layers that let agencies mix body-cam brands without losing search functionality.
M&A activity is robust as incumbents seek niche tech: Motorola bought Ava Security for USD 445 million; Genetec acquired Kantech for access-control integration, and Oracle forged a strategic alliance with the International Association of Chiefs of Police to craft cloud standards suitable for small departments. Start-ups focus on blockchain integrity proofs and deep-fake detection, areas where incumbents have yet to establish leadership. Because grant guidelines increasingly demand open-API interoperability, vendors that wall off data risk disqualification from large procurements, nudging the landscape toward more open ecosystems.
Evidence Management Industry Leaders
NICE Ltd
QueTel Corporation (Omnigo)
Hitachi Vantara Corporation
Lexipol LLC
Panasonic Holdings Corporation
- *Disclaimer: Major Players sorted in no particular order
Evidence Management Market Companies Covered in this Report
- NICE Ltd.
- QueTel Corporation
- Lexipol LLC
- Hitachi Vantara Corporation
- Panasonic Holdings Corporation
- Motorola Solutions, Inc.
- Oracle Corporation
- CaseGuard LLC
- COBAN Technologies, Inc.
- Porter Lee Corporation
- Finalcover LLC
- International Business Machines Corporation
- Axon Enterprise, Inc.
- Genetec Inc.
- Digital Ally, Inc.
- Veritone, Inc.
- Tyler Technologies, Inc.
- Safe Fleet Holdco, Inc.
- Reveal Media Ltd.
- Utility Associates, Inc.
- Getac Technology Corporation
- StorMagic Ltd.

Market Opportunities and Future Outlook
A near-term opportunity is tied to compliance-driven refresh cycles as security baselines and cross-border evidence access rules tighten. CJIS Security Policy v6.0 (released December 27, 2024) increases the practical burden on vendors and agencies to align controls with NIST SP 800-53 Revision 5, and to sustain audit-log retention for access events. That, in turn, supports demand for evidence platforms that operationalize logging, role-based access, and verifiable chain-of-custody without adding manual workload. In Europe, the e-evidence package entering application in August 2026 introduces time-bound production and preservation requirements and an EU legal representative obligation for relevant service providers. The change creates additional whitespace for automation that supports faster retrieval, standardized disclosure packaging, and defensible audit trails across jurisdictions.
Another opportunity is broader expansion beyond traditional police use cases into justice-wide workflows, where evidence sharing and review bottlenecks persist. Market evidence points to continuing friction: agencies still report reliance on portable hard drives for sharing and delays from locked devices during forensic intake, which increases demand for interoperable portals, standardized metadata, and workflow connectors between investigators, prosecutors, and courts. Product activity also indicates sustained pull for AI-enabled handling (transcription and redaction) and for deployment choice, including private-tenant cloud options, as agencies balance sovereignty, cybersecurity, and operating costs. Vendors that combine governance, interoperability, and AI assistance into implementable programs, backed by professional and managed services, are positioned to support multi-department and cross-agency rollouts.
Recent Industry Developments in Evidence Management Market
- April 2026: Lexipol launched the Accreditation Workbench for California to help agencies map policies to California Accreditation for Public Safety (CAPS) standards and manage supporting compliance evidence. The release reinforces the convergence of evidence handling with policy, accreditation, and accountability workflows inside broader public-safety software stacks.
- February 2026: Omnigo Software LLC (QueTel) received a Virginia State Police sole source award for physical evidence license support running through February 1, 2027. The contract extends an installed-base relationship around evidence tracking and reinforces the role of support and renewal cycles in sustaining evidence management deployments.
- October 2024: Axon Enterprise committed USD 200 million to expand international data centers, adding capacity in Europe and Asia-Pacific to address latency and data-sovereignty requirements. The investment strengthens cloud evidence hosting footprints that underpin multi-agency sharing and accelerates the shift toward cloud-first evidence workflows.


Evidence Management Market Report Scope and Research Methodology
Market Definition and Coverage
For this methodology, the evidence management market includes the tools and services used to capture, store, organize, preserve, and share evidence records through a controlled chain of custody. It covers hardware, software, and related services used by public agencies and select commercial users.
Scope exclusions: We exclude general IT infrastructure spending that is not bought specifically for evidence workflows (for example, generic storage or networking not dedicated to evidence programs).
Segments Covered in This Report
- By Deployment
- On-premises
- Cloud
- By Component
- Hardware
- Body-worn Cameras
- Vehicle Dash Cameras
- Citywide Cameras
- Public Transit Video
- Software
- Services (Consulting, Training, Support)
- Hardware
- By Evidence Type
- Digital Evidence
- Video
- Audio
- Image
- Documents
- Physical Evidence Metadata
- Digital Evidence
- By End User
- Law-Enforcement Agencies
- Transportation Agencies
- Federal and Defense Agencies
- Courts and Prosecutors
- Insurance Companies
- By Geography
- North America
- United States
- Canada
- Mexico
- South America
- Brazil
- Argentina
- Rest of South America
- Europe
- Germany
- United Kingdom
- France
- Italy
- Spain
- Netherlands
- Rest of Europe
- Asia-Pacific
- China
- Japan
- India
- South Korea
- Australia
- Rest of Asia-Pacific
- Middle East and Africa
- Middle East
- Saudi Arabia
- United Arab Emirates
- Turkey
- Rest of Middle East
- Africa
- South Africa
- Egypt
- Rest of Africa
- Middle East
- North America
Data Sources, Market Sizing, and Validation
Desk Research
Desk research was used to set the fact base and to keep assumptions tied to measurable signals. We reviewed public sources such as US DOJ and NIJ publications, FBI CJIS guidance materials, NIST cybersecurity and digital identity references, and procurement portals that show typical agency buying patterns. We also used statistics and releases from bodies such as the Bureau of Justice Statistics and relevant transportation and public safety agencies when camera and video evidence programs were in scope.
On top of this, we read company filings, investor presentations, product documentation, and credible press coverage to map how revenue is earned across hardware, software, and services. Where public disclosure was thin, we used paid subscriptions for company financials and intelligence, patent databases, and shipment-level import or export signals to validate supplier activity and ASP direction. The sources listed here are illustrative and not exhaustive, and many other public references were used for collection, cross-checking, and clarification.
Primary Interviews and Surveys
Primary work was used to pressure-test the desk assumptions and to close gaps around pricing, deployment mix, and renewal behavior. We interviewed and surveyed a mix of solution providers, system integrators, and end users, including law enforcement agencies, courts, transportation bodies, and insurance-led investigation teams. Coverage was balanced across APAC, EMEA, and the Americas so regional procurement cycles and cloud policy preferences were captured in the pricing and replacement assumptions.
Distribution of primary research fieldwork respondents
| Company type | Respondent position | Region |
|---|---|---|
| Top tier: 33% | CXOs: 18% | APAC: 52% |
| Mid tier: 47% | Functional/Unit leaders: 26% | EMEA: 29% |
| Smaller Players: 20% | Managers: 56% | Americas: 19% |
Market-Sizing & Forecasting
Sizing starts with a top-down build where public spending signals and procurement intensity are reconstructed by region, then allocated into evidence management categories using adoption and replacement cycles observed in the field. The model is cross-checked with selective bottom-up approximations, such as sampled deal-size benchmarks, channel checks with integrators, and an ASP times volume sanity check for common camera and storage-linked workflows.
Inputs that matter for this market include active body-worn and in-vehicle camera program expansion, cloud versus on-premise deployment preferences, typical evidence retention periods, the share of cases that require video handling and secure sharing, and services intensity during implementation and upgrades. Pricing assumptions are handled in a practical way by separating one-time hardware and setup fees from recurring software and support, and then adjusting for expected discounting in large tenders and for inflation in service rates. For forecasting, scenario analysis is used around budget cycles, cloud policy shifts, and replacement waves, and the final growth path is aligned to what interviewees view as realistic adoption speed in their regions. When gaps show up in smaller-country coverage, proxy indicators like agency counts and public safety spend are used, followed by a review to avoid overstating long-tail markets.
Data Validation & Update Cycle
Validation is done through several checks so that large jumps are explained before results are finalized. We compare the modeled totals against independent signals like tender flow, installed base direction, and the expected split between hardware, software, and services, and then investigate outliers by region and end-user type. If a key assumption looks inconsistent, it triggers re-contact with interviewees and a re-check of the underlying desk references.
Each report goes through multi-step analyst review, including variance checks between historical and current inputs and consistency tests across segments. The model is refreshed annually, and interim updates are made when material events change demand signals or pricing, followed by a final pre-delivery pass to ensure clients receive the latest view.
Mordor Intelligence's Evidence Management Market Size Compared Against Other Published Estimates
Different published market sizes for evidence management can look confusing because the timing and the counting rules are not always aligned. The gaps usually come from how each study treats hardware versus recurring software and services, how it handles currency conversion for multi-region revenue, and whether the estimate is anchored to a single base year or blended across a range.
In this study, the refresh-led checks focus first on whether ASP movement, discounting in public tenders, and the USD conversion timing match what buyers and suppliers are seeing today, and then those checks are applied in the same way across regions, which is why the 2026 starting value differs from what some 2024-based snapshots report, a choice implemented by Mordor Intelligence.
Benchmark comparison
| Source | Market Size | Gaps in Research Methodology |
|---|---|---|
| Mordor Intelligence | USD 10.67 B (2026) | |
| Global Consultancy A | USD 8.58 B (2024) | Uses a 2024 base year and a digital-only framing in parts of the scope, which can undercount physical evidence metadata workflows and shift hardware versus software timing when agency refresh cycles peak later. |
| Industry Research Group B | USD 9.11 B (2024) | Starts from a 2024 base and applies a different split for recurring subscriptions versus one-time implementation, so ASP progression and discounting are not always re-validated against recent tender outcomes. |
The table mainly shows that base-year selection and pricing treatment can move the reported size by a noticeable amount even when the topic sounds similar. By keeping the inputs tied to procurement cadence, recurring revenue logic, and repeatable regional checks, the estimate stays transparent and easier to reproduce when assumptions need to be updated.


Key Questions Answered in the Report
How large is the global Evidence Management market in 2026?
The market stands at USD 10.67 billion and is projected to grow at a 10.61% CAGR over 2026-2031.
Which deployment model is expanding fastest?
Cloud workflows lead with 62.95% share in 2025 and are projected to expand at 12.03% CAGR as agencies pursue scalable, CJIS-compliant storage.
What segment provides the highest growth opportunity for vendors?
Services, encompassing consulting, migration and training, are advancing at an 11.28% CAGR as agencies seek help integrating AI analytics into daily workflows.
Which region is forecast to be the fastest growing?
Asia-Pacific is set to expand at 11.45% CAGR, driven by India’s Smart Cities Mission and Japan’s national body-camera rollout.
What is the main cost-related challenge agencies face?
Long-term compliant cloud storage expenses can exceed USD 500,000 annually for mid-size forces, pushing them toward hybrid hot-cold tier models.
Page last updated on:


 Your data is secure and never sold or shared.


