
Market Overview
| Study Period | 2020 - 2031 |
|---|---|
| Forecast Data Period | 2026 - 2031 |
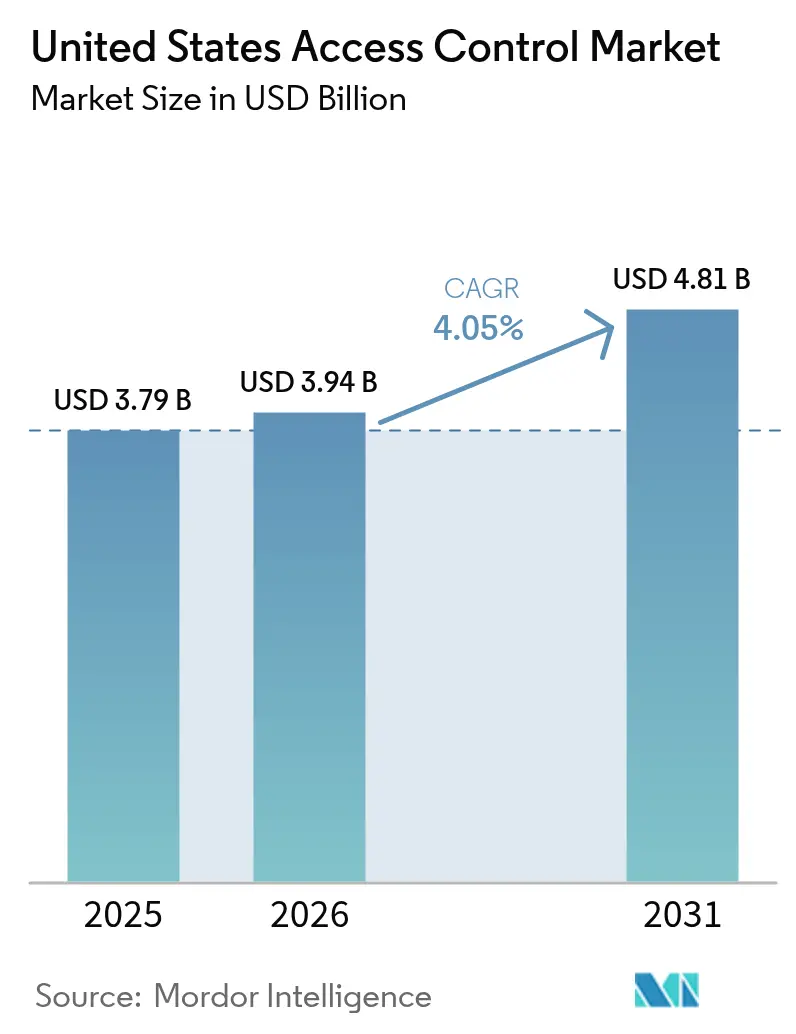
| Base Year Market Size (2025) | USD 3.79 Billion |
| Market Size (2026) | USD 3.94 Billion |
| Market Size (2031) | USD 4.81 Billion |
| Growth Rate (2026 - 2031) | 4.05 % |
| Market Concentration | Medium |
Major Players *Disclaimer: Major Players sorted in no particular order Image © Mordor Intelligence. Reuse requires attribution under CC BY 4.0. | |
United States Access Control Market Analysis by Mordor Intelligence
US access control market size in 2026 is estimated at USD 3.94 billion, growing from 2025 value of USD 3.79 billion with 2031 projections showing USD 4.81 billion, growing at 4.05% CAGR over 2026-2031. Hardware continues to provide the revenue backbone, yet growth is tilting toward software-centric, intelligence-driven platforms that merge physical and cyber identity management. Updated federal authentication rules are forcing agencies and contractors to refresh readers and credentials, locking-in near-term demand while expanding the total addressable pool of compliant endpoints.[1]U.S. General Services Administration, “Federal credentialing services,” gsa.gov Smartphone-based mobile credentials are scaling quickly as organizations look for zero-trust authentication without distributing new plastic cards.[2]NXP Semiconductors, “NXP redefines access control with autonomous secure access solution,” nxp.com Federal cybersecurity grants reward projects that improve logging and encryption, accelerating the gradual pivot from on-premises controllers to cloud and hybrid deployments.[3]Federal Emergency Management Agency, “FY 2024 State and Local Cybersecurity Grant Program fact sheet,” fema.gov Strategic consolidation among incumbents and cloud-native specialists signals a shift from stand-alone devices to integrated ecosystems, reshaping competitive strategy across the US access control market.
Key Report Takeaways
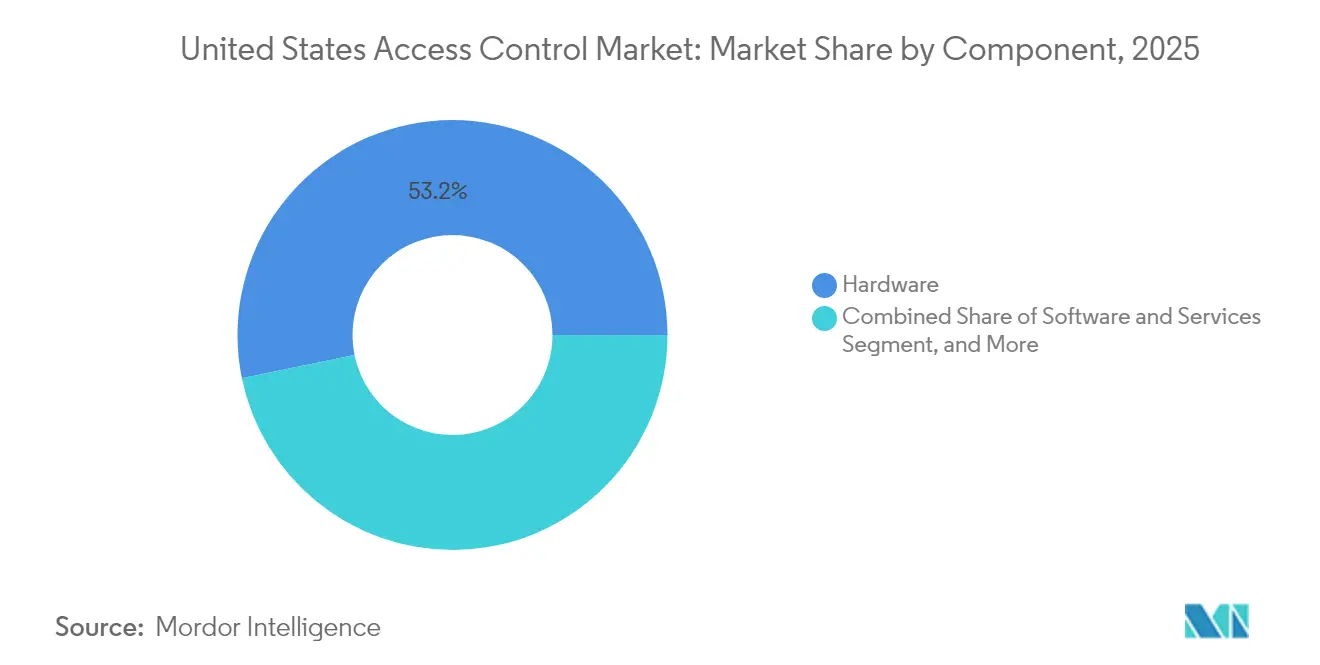
- By component, hardware captured 53.22% of the US access control market share in 2025, while software is projected to advance at a 7.72% CAGR through 2031.
- By technology, card-based and other non-biometric solutions held 46.95% revenue share in 2025; mobile credentials are set to expand at a 6.25% CAGR to 2031.
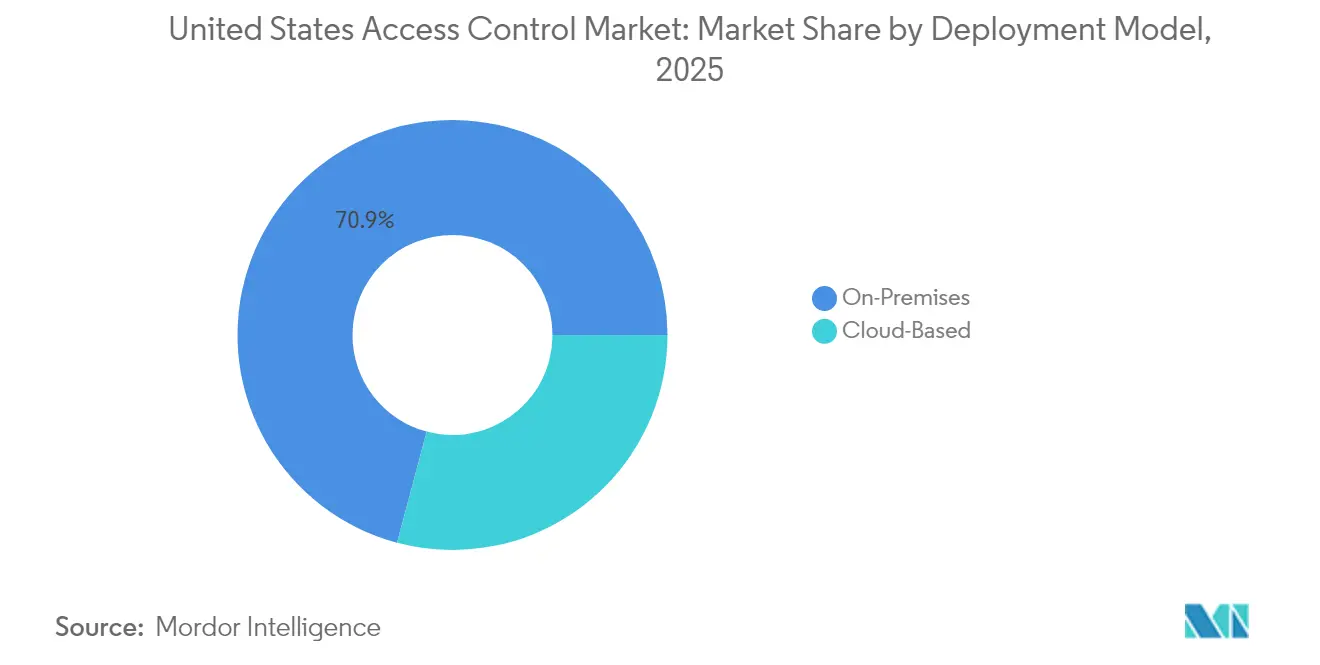
- By deployment model, on-premises systems accounted for 70.85% of 2025 spending, whereas cloud-based offerings are forecast to grow at a 5.63% CAGR over the outlook period.
- By end-user, commercial facilities dominated with 41.90% share in 2025, while residential applications are expected to climb at a 5.92% CAGR through 2031.
Note: Market size and forecast figures in this report are generated using Mordor Intelligence’s proprietary estimation framework, updated with the latest available data and insights as of 2026.
United States Access Control Market Trends and Insights
Drivers Impact Analysis*
| Driver | (~) % Impact on CAGR Forecast | Geographic Relevance | Impact Timeline |
|---|---|---|---|
| Rapid migration toward mobile credential-based systems | +1.20% | National, concentrated in urban centers and federal facilities | Medium term (2-4 years) |
| Growing federal and state funding for critical-infrastructure security upgrades | +0.80% | National, with emphasis on UASI-designated areas and rural communities | Short term (≤ 2 years) |
| Heightened compliance needs under updated FIPS-201-3 and TSCP standards | +0.70% | Federal facilities and contractors nationwide | Medium term (2-4 years) |
| Demand surge for cloud-native platforms that unify physical and cyber access | +0.90% | National, strongest in commercial and enterprise segments | Medium term (2-4 years) |
| Rise of generative-AI-enabled adaptive threat analytics | +0.40% | Early adoption in high-security facilities and tech-forward enterprises | Long term (≥ 4 years) |
| Convergence with smart-building ESG mandates | +0.30% | Metropolitan areas with sustainability requirements | Long term (≥ 4 years) |
| Source: Mordor Intelligence | |||
Rapid Migration Toward Mobile Credential-Based Systems
Mobile credentials are redefining authentication practices across the US access control market. Organizations appreciate the ability to distribute and revoke digital keys in real time without printing new cards or re-keying locks, which lowers administrative overhead and eliminates card-replacement costs. Federal facilities view smartphone access as a bridge between zero-trust mandates and existing infrastructure, because phones already incorporate hardware security modules and biometric unlock features that strengthen multi-factor workflows. Large enterprises report higher employee satisfaction when users carry only their own devices, and property managers value the audit trails that follow every over-the-air credential change. Adoption is also helped by rising NFC and ultra-wide-band inclusion in mainstream handsets, which allows reliable tap-to-enter experiences even in shielded environments. Implementation demands robust mobile-device-management policies and network segmentation to prevent lateral movement from compromised phones, but integrators note that these security steps align with existing cyber hygiene frameworks rather than adding new requirements.
Growing Federal and State Funding for Critical-Infrastructure Security Upgrades
The federal government allocated USD 279.9 million in cybersecurity grants during 2024, and access control deployments that embed encryption, enhanced logging, and multi-factor authentication qualify for reimbursement. The Nonprofit Security Grant Program supplied an additional USD 454.5 million for facility hardening, extending addressable demand into social-service, healthcare, and faith-based campuses. Distribution rules mandate that 80% of state allocations flow to local government or nonprofit recipients, with 25% preserved for rural areas. Vendors positioned with easy-to-deploy mobile credentials and cloud dashboards see faster sales cycles because grant administrators favour solutions that minimize on-site IT labour. Integrators also highlight that rural hospitals and water utilities are retrofitting older electromechanical locks, creating revenue opportunities outside traditional metropolitan hubs. This broad dispersal of funding supports short-term unit growth while reinforcing medium-term platform subscriptions, given that most grants require solutions to remain operational for at least three years.
Heightened Compliance Needs Under Updated FIPS-201-3 and TSCP Standards
Changes finalized in 2024 require stronger cryptography, greener light facial authentication, and full support for Personal Identity Verification (PIV) credentials across more than 5 million federal badges. Legacy readers that cannot process new digital-signature algorithms will be phased out over multi-year replacement schedules, ensuring a stable pipeline of hardware orders. Contractors that wish to maintain facility access must also upgrade their devices, extending the compliance wave beyond federal property lines. Middleware vendors that can natively parse PIV objects and pass attribute-based access rules into IT directories gain competitive advantage, because agencies prefer integrated command centers over patchwork deployments. Market participants expect periodic firmware update windows through 2030 as cryptographic curves evolve, which embeds recurring revenue into maintenance contracts. The US access control market therefore sees compliance as both an immediate sales catalyst and a long-tail support obligation.
Demand Surge for Cloud-Native Platforms That Unify Physical and Cyber Access
Enterprises increasingly treat door controllers as extensions of their zero-trust network, requiring least-privilege rules and centralized logs. Cloud-native platforms meet that requirement by consolidating user identities, building entrance rights, and application permissions under a single policy engine. The funding environment favours this architecture: federal grants specifically list “enhanced logging, encryption, and auditability” as reimbursable milestones, nudging decision-makers toward hosted dashboards.[4] Venture capital continues to fund cloud providers; SwiftConnect added USD 37 million in Series B in late 2024 to scale its AccessCloud platform. Hybrid models remain important in defense, utilities, and finance, because data-sovereignty rules or 24/7 uptime mandates force at-edge fail-safe controls. Vendors respond by shipping local decision engines that sync policy in near real time but run autonomously if the cloud link drops, balancing cybersecurity with operational continuity.
Restraints Impact Analysis*
| Restraint | (~) % Impact on CAGR Forecast | Geographic Relevance | Impact Timeline |
|---|---|---|---|
| Persistent supply-chain volatility in semiconductor components | -0.60% | Global impact with concentrated effects in manufacturing regions | Short term (≤ 2 years) |
| Fragmented legacy infrastructure slowing platform migrations | -0.40% | National, particularly acute in older federal and municipal facilities | Medium term (2-4 years) |
| End-user data-privacy litigation risk around biometric identifiers | -0.30% | Illinois and states with biometric privacy laws | Medium term (2-4 years) |
| Limited skilled-labor pool for OT-IT security convergence projects | -0.50% | National, with acute shortages in rural and secondary markets | Long term (≥ 4 years) |
| Source: Mordor Intelligence | |||
Persistent Supply-Chain Volatility in Semiconductor Components
Continued chip scarcity raises lead times for secure microcontrollers, biometric processors, and radio modules, inflating bill-of-materials costs and delaying project schedules. The Department of Commerce has warned that single-site concentration for advanced lithography amplifies exposure to weather and geopolitical shocks, a situation unlikely to resolve before domestic fabs reach volume later this decade. Manufacturers hedge by redesigning boards around more readily available chipsets, yet each redesign reopens certification cycles and quality-assurance testing. Integrators respond with larger safety stock, but warehousing costs weigh on margins. End customers occasionally postpone refresh plans when pricing for secure elements spikes, trimming near-term shipment volumes in the US access control market.
Fragmented Legacy Infrastructure Slowing Platform Migrations
Many campuses still operate standalone door controllers, proprietary card formats, and siloed directory services installed before 2015. Upgrading these assets requires panel swaps, cabling, and software bridges to sync legacy databases with modern identity platforms. Facilities departments often lack capex budgets for wholesale rip-and-replace initiatives and instead adopt incremental room-by-room rollouts that stretch timelines. Older municipal buildings face additional hurdles such as asbestos abatement when pulling cable, inflating project cost. Integrators must dispatch multi-disciplinary crews spanning electricians, low-voltage technicians, and network specialists, and that coordination lengthens deployment calendars. While federal grants cover some upgrade expenses, paperwork and bid rules can extend approval cycles beyond twelve months, slowing market penetration for advanced platforms.
*Our forecasts treat driver/restraint impacts as directional, not additive. The impact forecasts reflect baseline growth, mix effects, and variable interactions.
Segment Analysis
By Component: Software Gains Strategic Weight
The component mix shows that hardware supplies the bulk of revenues, yet software delivers the fastest incremental growth. In 2025, hardware represented 53.22% of spending in the US access control market; software is on track for a 7.72% CAGR through 2031. The US access control market size for software grew as agencies sought features like real-time analytics, encrypted credential issuance, and policy-based automation. Hardware remains essential because readers, panels, and locks anchor physical security, but pricing trends reveal compression as commoditized electronics face increased supplier competition. By contrast, subscription bundles for cloud dashboards, AI extensions, and compliance reporting sustain double-digit margin profiles and predictable cash flow. Vendors package over-the-air firmware, advanced threat detection, and emergency lockdown macros as recurring options, converting one-time capital purchases into lifetime customer value.
Services hold the smallest share yet function as an annuity layer across the US access control market. Integrators bundle preventive maintenance, 24/7 monitoring, and managed badge issuance, shifting cost from unpredictable site visits to fixed monthly agreements. Federal grant clauses that require multiyear support encourage agencies to sign extended service contracts, anchoring predictable revenue for channel partners. Software also enables template-based rollouts across franchise chains, where a single configuration can replicate to hundreds of stores overnight, minimizing labour per site. Platform providers emphasize open APIs so third-party building management systems can retrieve occupancy feeds, feeding energy optimization algorithms that help owners meet ESG targets. This interoperable design raises exit barriers and extends the lifespan of software subscriptions within the US access control market.



By Technology: Mobile Credentials Accelerate Shift Away from Plastic
Card-based and other non-biometric formats accounted for 46.95% of technology revenues in 2025, benefiting from entrenched infrastructure and cross-vendor compatibility. The US access control market size associated with card technology continues to expand modestly, but growth decelerates as users pivot to phone-based credentials at a projected 6.25% CAGR. Mobile keys leverage secure elements and biometric unlock on handsets, achieving multi-factor authentication without additional reader hardware when NFC is enabled. Facility managers appreciate over-the-air issuance and revocation, eliminating the logistics of printing and shipping badges. Apple Wallet and Google Wallet have integrated employee badge protocols, reducing user-training hurdles.
Biometric modalities such as facial or fingerprint readers concentrate in high-security zones where identity assurance outweighs privacy concerns. Legislated consent and data-retention rules damp adoption within states that enforce strict biometric privacy laws, but airport terminals, pharma labs, and defense sites still justify premium sensors. Alternative low-cost formats like keypad or proximity readers serve small businesses with limited budgets, offering modest tamper resistance but acceptable deterrence. Over the forecast period, expect card numbers to decline in absolute count even while revenue stabilizes, since lifecycle replacements sustain order flow. Meanwhile, mobile-credential software and reader firmware upgrades will drive incremental revenue, solidifying the mobile segment as the principal growth lever inside the US access control market.
By Deployment Model: Cloud Momentum Outpaces Stubborn On-Premises Core
On-premises configurations controlled 70.85% of spending in 2025, showing that many organizations still favour localized decision engines for perceived latency, sovereignty, and uptime benefits. The US access control market share of on-premises architectures dominates in defense facilities, utilities, and heavy-industrial plants, where air-gapped networks remain standard. Yet cloud platforms are expanding at a 5.63% CAGR as support contracts sunset and operators seek unified dashboards that blend cyber and physical alerts. Federal grants underline the trend, reimbursing systems that employ encrypted logs and centralized audit controls only achievable at scale through hosted services.
Hybrid deployments act as transitional bridges, keeping door decisions on site while syncing credentials and analytics to a cloud tenant. Vendors offer redundant path fail-over, ensuring continuity if WAN links fail. Smaller enterprises gravitate directly to full cloud because they lack IT staff to patch Linux kernels on site. Pricing models also differ on-premises buyers pay upfront plus annual support, whereas cloud adopters shift to monthly operating expense, smoothing budgets. Security posture improvements further lure holdouts, since leading cloud providers now furnish FIPS-compliant HSMs and regional data centers. Consequently, the US access control market expects the on-premises slice to narrow steadily even as absolute hardware shipments continue.
By End-User: Commercial Dominance Meets Residential Upsurge
Commercial buildings contributed 41.90% of demand in 2025, reflecting office towers, mixed-use developments, and shopping centers that require multi-tenant credential management. The US access control market size for commercial properties remains robust because retrofits coincide with return-to-office policies and ESG driven upgrades. Offices embed occupancy analytics to revise space allocation and align cooling with real-time headcount, delivering energy savings and improved asset utilization. Retail facilities integrate access logs with loss-prevention analytics, tightening inventory shrink controls. Government installations provide recurring projects spurred by compliance mandates, while industrial operators specify ruggedized hardware that withstands dust, vibration, and extreme temperatures.
Residential deployments, particularly in multifamily complexes, show the fastest trajectory at a forecast 5.92% CAGR. Property owners embrace smart locks and package rooms that reduce concierge costs and improve renter satisfaction. AvalonBay Communities expanded connected lock programs across its 299-property portfolio, highlighting how enterprise-grade cloud platforms can scale to consumer environments. Resident apps package access permissions, maintenance tickets, and amenity bookings inside one interface, building loyalty and justifying premium rents. Single-family builders also pre-wire smart hubs to capture homebuyer demand for turnkey automation. The accelerating share of residential installs introduces consumer channel dynamics, pushing vendors to simplify commissioning and integrate with voice assistants. Collectively, these trends diversify the US access control market away from an exclusive focus on commercial corridors.
Geography Analysis
Regional demand clusters around Washington D.C., Virginia, Maryland, and other areas dense with federal campuses and defense contractors. States with heavy critical-infrastructure footprints, such as Texas and California, ranked among the top recipients of 2024 cybersecurity grants, at USD 12.9 million and USD 12.1 million respectively. Those allocations translate into accelerated bid activity for compliant readers and mobile-credential platforms. The Northeast sees early deployment of facial recognition paired with cloud oversight, due to tighter urban perimeters and higher security budgets. West Coast tech headquarters adopt AI-based anomaly detection, leveraging cloud elasticity to process vast badge and video datasets.
Midwest and Southern states display a higher share of traditional card readers but benefit from competitive pricing as new entrants seek market expansion. Rural counties use the 25% earmark of cybersecurity funds to modernize courthouse locks and water treatment plant gates, markets that previously bought only padlocks. Privacy laws shape the geography of biometric adoption: Illinois operators sometimes avoid fingerprint sensors given the stringent consent requirements, while neighbouring states proceed with fewer constraints. The Pacific Northwest and Northeast lead on ESG-linked retrofits, adding occupancy analytics to meet state climate benchmarks. These geographic disparities ensure that sales cycles and product mixes vary widely across the US access control market, requiring vendors to tailor channel strategies.
Regulatory Landscape
US access control deployments are shaped by federal identity and cybersecurity compliance requirements, particularly for government sites and contractors. NIST FIPS 201-3 (issued in 2022) governs Personal Identity Verification (PIV) credentials, and federal procurement into the sector is commonly gated by alignment with FICAM requirements and placement on the FICAM Approved Products List, pushing agencies toward interoperable readers, credentials, and middleware aligned to HSPD-12 goals.
For electronic physical access control systems (ePACS), agencies treat systems as IT assets with cybersecurity obligations under FISMA. This is reinforced by NIST guidance, including the ePACS overlay aligned to SP 800-53 Rev. 5 controls, and by Interagency Security Committee facility access control best practices. In procurement practice, GSA ordering guidance for Physical Access Control Systems (updated in December 2025) functions as a practical reference point for compliant federal buying, shaping feature checklists around encryption, auditability, and standardized credential support.
Competitive Landscape
The vendor ecosystem remains moderately fragmented, with traditional hardware majors defending share while software-first entrants race to capture platform revenue. Johnson Controls, ASSA ABLOY, and Honeywell maintain extensive channel networks and federal certifications, protecting core segments that value proven compliance. Yet cloud-native challengers promote rapid feature cycles, lower upfront costs, and open APIs that resonate with tech-savvy property owners. Consolidation heated in 2024: ASSA ABLOY folded Level Lock into a new multifamily subsidiary while also acquiring 3millID and Third Millennium Systems, broadening its portfolio beyond mechanical and electronic locks. Vitaprotech’s merger with Identiv’s reader arm revived the Hirsch brand, creating a USD 185 million revenue platform with over 100 software engineers focused on unified management.
Investment momentum underscores the pivot toward software layers within the US access control market. SwiftConnect attracted USD 37 million to extend its mobile-credential cloud, and Acre Security bought generative-AI specialist REKS to offer conversational queries for access logs. These moves illustrate how analytics and identity orchestration now drive differentiation more than metal housings and relay contacts. Legacy players respond by embedding edge-to-cloud conversion kits and launching subscription bundles that wrap readers, firmware, and analytics under one invoice. Meanwhile, smartphone giants Apple and Google influence standards through Wallet APIs but have yet to enter enterprise door hardware directly, leaving room for partnerships with established access vendors. The coming years will test whether incumbents can integrate AI features fast enough to hold share against nimble SaaS competitors.
United States Access Control Industry Leaders
Assa Abloy AB Group
Allegion PLC
Johnson Controls International plc
IDEMIA Identity & Security SAS
Raytheon Technologies Corporation
- *Disclaimer: Major Players sorted in no particular order


Market Opportunities and Future Outlook
Compliance-driven modernization continues to create whitespace for vendors that package interoperable credentialing, strong authentication, and centralized audit logging into deployable upgrades. NIST updates in digital identity (SP 800-63-4, released in August 2025) and biometric data interchange (SP 500-290e4 documenting ANSI/NIST-ITL 1-2025, approved January 15, 2026) raise requirements for identity proofing, authentication, and biometric data handling, supporting opportunities in software layers that convert standards into practical policy engines, enrollment workflows, and reporting.
Sector-specific cybersecurity mandates also drive near-term upgrade demand for access control and adjacent infrastructure. In March 2026, approval of NERC Reliability Standard CIP-003-11 added requirements covering authentication of remote users and protection of authentication information for low-impact Bulk Electric System cyber assets, which increases demand for hardened remote administration, credential lifecycle controls, and logging in utility environments. In June 2026, the FCC adopted an Order requiring broadcasters to place Emergency Alert System and program-chain equipment behind firewalls (or comparable segmentation) and to promptly install security patches, increasing demand for facility and room-level access governance that supports network segmentation practices, including role-based access, tighter visitor controls, and auditable change management for protected areas.
Recent Industry Developments
- June 2026: Allegion US unveiled access and multifamily-focused innovations across Schlage, Zentra, and Gatewise at the Apartmentalize 2026 event. The launches emphasized interoperable electronic access and property workflows, reinforcing the shift toward platform-aligned products in large multifamily portfolios.
- April 2026: Kwikset (ASSA ABLOY) announced an integration of its UNITE electronic locks with the ButterflyMX access control and security platform. The linkage expands multi-tenant and residential access use cases by connecting door hardware to a widely deployed property access ecosystem, supporting app-based credentialing and streamlined deployments.
- February 2025: Acre Security acquired REKS to add natural-language query capabilities to the Acre Access Control platform. The deal strengthened software differentiation around faster investigations and operator workflows by making access-event search and analysis more accessible to non-specialist users.


Research Methodology Framework and Report Scope
Market Definition and Coverage
For this report, the US access control market is defined as revenues earned from systems that control, authenticate, and manage entry to physical spaces in the United States, across commercial, residential, industrial, and public facilities.
Scope exclusions: we exclude adjacent security spend that does not directly enable access decisions, such as general video surveillance-only deployments and non-access identity services.
Segmentation Overview
- By Component
- Hardware
- Software
- Services
- By Technology
- Biometric
- Card-Based / Non-Biometric
- Mobile Credential
- Others Technologies
- By Deployment Model
- On-Premises
- Cloud-Based
- By End-User
- Commercial
- Government
- Industrial
- Residential
Data Sources, Market Sizing, and Validation
Desk Research
Desk research was used to set clear market boundaries and to build the starting demand picture for access control across the United States. We relied on public sources that consistently describe building activity, safety requirements, and identity standards, such as US Census Bureau construction data, NIST digital identity and authentication guidance, GSA facility standards, and DHS or CISA alerts and advisories.
We also used sources that help anchor pricing and mix in a realistic way, such as SEC filings, annual reports, and earnings materials, plus state and local procurement portals, building code references, and reputable association websites tied to physical security and facilities. In a few places, paid subscriptions supporting company financials and patent databases were used to sanity-check product direction and supplier positioning over time. These desk sources are not exhaustive, and we used additional public documents and references to validate inputs and clarify assumptions.
Primary Interviews and Surveys
Primary work was used to pressure-test the model with people who see pricing and demand changes firsthand, including system integrators, channel partners, facility security teams, and product managers. For a US-focused market, interviews covered major demand pockets across regions, and then pricing logic was cross-checked by application type (commercial buildings, critical infrastructure, and multi-site enterprises) to close gaps from desk research.
Distribution of primary research fieldwork respondents
| Company type | Respondent position |
|---|---|
| Top tier: 30% | CXOs: 19% |
| Mid tier: 49% | Functional/Unit leaders: 37% |
| Smaller Players: 21% | Managers: 44% |
Market-Sizing & Forecasting
Our sizing starts with a top-down reconstruction of the US demand pool, where building stock and renovation activity are translated into addressable doors, sites, and users that typically require access control. That demand base is then filtered through adoption indicators so only realistic deployments are counted, followed by an ASP and replacement cycle logic that converts units into annual revenue.
To keep the totals grounded, we corroborate the outputs with selective bottom-up checks, such as sampled project bill-of-material patterns from integrators and a supplier and channel roll-up for a limited set of product lines. Where bottom-up visibility is uneven, such as small retrofit jobs and bundled services, we used interview-led ranges and then adjusted shares so the final totals remain consistent with observable procurement and installation patterns.
Key inputs used in the model include commercial construction and remodeling trends, federal authentication and security guidance that impacts upgrade timing, the split of hardware versus software and services, cloud versus on-premise preference, and observed ASP movement for readers, controllers, and credentials. Forecasting is done using scenario analysis, where the baseline path is shaped by construction outlook, security compliance push, and replacement cycles, and then validated with expert expectations on pricing and conversion rates.
Data Validation & Update Cycle
Validation is done in a few steps so outliers do not slip into the final numbers. Analysts compare model outputs against independent signals, such as construction activity shifts, public security guidance changes, and the direction of vendor-reported mix and margin movement, and then review anomalies before sign-off.
When large variances show up, we re-check assumptions and, if needed, re-contact primary respondents to confirm whether the change is due to pricing, mix, or timing. Reports are refreshed annually, with interim updates triggered by material events that can move adoption or pricing quickly. Before delivery, a final analyst pass is performed so clients receive the latest updated view in the model and write-up.
Mordor Intelligence's US Access Control Market Size Versus Other Published Estimates
Published estimates for this market can look different even when they sound like they cover the same topic, since pricing, what gets counted, and the year of currency conversion can shift the total. Differences also show up when updates lag, which can miss recent changes in cloud mix, retrofit timing, and hardware price resets.
The key gap drivers are usually the refresh cadence of ASP assumptions, whether services and software subscriptions are recognized as recurring revenue or bundled project value, and how retrofit demand is treated versus new construction. A practical check in our process is to re-test pricing and mix using the latest interview inputs and recent public signals before finalizing the year, and that refresh step is one reason the market value can diverge from figures that are not updated as frequently, as applied by Mordor Intelligence.
Benchmark comparison
| Source | Market Size | Gaps in Research Methodology |
|---|---|---|
| Mordor Intelligence | USD 3.94 B (2026) | |
| Industry Association A | USD 3.60 B (2026) | Often emphasizes hardware and installed-base upgrades, with limited normalization for software subscription revenue and faster shifts in cloud-related ASPs. |
| Global Consultancy B | USD 4.30 B (2026) | May include adjacent security and identity spend alongside access control, and can apply stronger ASP escalation without channel checks on retrofit project pricing. |
The spread across sources is mostly explained by what is bundled into access control, how recurring software and services are timed, and how frequently price and mix assumptions are revisited. When the same steps and inputs are applied year after year, the outcome stays easier to trace back to clear demand drivers and repeatable checks.


Key Questions Answered in the Report
How big is the United States access control market in 2026?
The market stands at USD 3.94 billion in 2026 and is projected to reach USD 4.81 billion by 2031.
Which component category is expanding fastest?
Software grows the quickest, supported by a 7.72% CAGR through 2031 as organizations adopt cloud-native management and analytics.
What drives adoption of mobile credentials?
Smartphone ubiquity, zero-trust mandates, and the ability to issue and revoke keys over the air are pushing rapid uptake of phone-based access.
Why are cloud deployments gaining ground?
Federal grants reward enhanced logging and encryption, and hosted dashboards reduce on-premises IT workload, propelling cloud uptake at a 5.63% CAGR.
Which end-user segment shows the highest growth?
Residential applications, especially multifamily properties, lead with a 5.92% CAGR through 2031 thanks to smart-building automation.
What is the main restraint on biometric deployment?
Stringent state privacy laws that impose consent and data-retention requirements create litigation risk, slowing adoption in certain regions.
Page last updated on:





